ORIGINAL RESEARCH
BRAIN
Does the Location of the Arterial Input Function Affect
Quantitative CTP in Patients with Vasospasm?
B.J. Shin, N. Anumula, S. Hurtado-Ru´a, P. Masi, R. Campbell, R. Spandorfer, A. Ferrone, T. Caruso, J. Haseltine, C. Robinson, A. Gupta, and P.C. Sanelli
ABSTRACT
BACKGROUND AND PURPOSE: In recent years, there has been increasing use of CTP imaging in patients with aneurysmal SAH to evaluate for vasospasm. Given the critical role of the arterial input function for generation of accurate CTP data, several studies have evaluated the effect of varying the arterial input function location in patients with acute stroke. Our aim was to determine the effect on quantitative CTP data when the arterial input function location is distal to significant vasospasm in patients with aneurysmal SAH.
MATERIALS AND METHODS: A retrospective study was conducted of patients with aneurysmal SAH admitted from 2005 to 2011. Inclusion criteria were the presence of at least 1 anterior cerebral artery or MCA vessel with a radiologically significant vasospasm and at least 1 of these vessels without vasospasm. We postprocessed each CTP dataset 4 separate times by using standardized methods, only varying the selection of the arterial input function location in the anterior cerebral artery and MCA vessels. For each of the 4 separately processed examinations for each patient, quantitative data for CBF, CBV, and MTT were calculated by region-of-interest sampling of the vascular territories. Statistical analysis was performed by using a linear mixed-effects model.
RESULTS:One hundred twelve uniquely processed CTP levels were analyzed in 28 patients (mean age, 52 years; 24 women and 4 men) recruited from January 2005 to December 2011. The average Hunt and Hess scale score was 2.89⫾0.79. The average time to CTP from initial presentation was 8.2⫾5.1 days. For each vascular territory (right and left anterior cerebral artery, MCA, posterior cerebral artery), there were no significant differences in the quantitative CBF, CBV, and MTT generated by arterial input function locations distal to significant vasospasm compared with nonvasospasm vessels (P⬎.05).
CONCLUSIONS: Arterial input function placement distal to significant vasospasm does not affect the quantitative CTP data in the corresponding vascular territory or any other vascular territory in aneurysmal SAH.
ABBREVIATIONS:ACA⫽anterior cerebral artery; AIF⫽arterial input function; aSAH⫽aneurysmal subarachnoid hemorrhage; VSP⫽vasospasm
I
n recent years, there has been increasing use of CTP imaging in patients with aneurysmal subarachnoid hemorrhage (aSAH) to evaluate vasospasm (VSP). Several studies have reported CTP as a valuable tool for detecting perfusion deficits related to vasospasm,described as focal areas of CBF reduction and/or MTT prolonga-tion.1-5To obtain the CBF, MTT, and CBV maps, one performs
postprocessing of the acquired dataset. Deconvolution-based postprocessing algorithms require selection of an arterial input function (AIF) to represent the actual injection rate of contrast as time-series data during its first pass in the artery. The mathematic algorithm “deconvolves” this arterial attenuation curve from the tissue attenuation curve to compute an impulse residue function. On the basis of the impulse residue function curve, CBF is calcu-lated as the height of this curve, CBV is the area under the curve, and MTT is the area under the curve of the impulse residue func-tion divided by its height.
Given the critical role of the AIF for generation of accurate CTP data, several studies have evaluated the effect of varying the AIF location in patients with acute stroke.6-8These studies
re-vealed no significant difference in the quantitative CTP data with AIF selection ipsilateral or contralateral to the side of MCA vessel
Received January 7, 2013; accepted after revision March 28.
From the Departments of Radiology (B.J.S., N.A., P.M., R.C., R.S., A.F., T.C., J.H., C.R., A.G., P.C.S.) and Public Health (S.H.-R., P.C.S.), Weill Cornell Medical College/ NewYork–Presbyterian Hospital, New York, New York.
This work was supported by grant 5K23NS058387-04 from the National Institute of Neurological Disorders and Stroke (NINDS), a component of the National Insti-tutes of Health (NIH). It was also funded by the Clinical and Translational Science Center (grant UL1-RR024996).
The contents of this publication are solely the responsibility of the authors and do not necessarily represent the official view of NINDS or NIH.
Please address correspondence to Pina C. Sanelli, MD, MPH, Department of Radiol-ogy, Weill Cornell Medical College–NewYork Presbyterian Hospital, 525 East 68th St, Box 141, New York, NY 10065; e-mail: [email protected]
Indicates open access to non-subscribers at www.ajnr.org
occlusion in either the anterior cerebral artery (ACA) or MCA segments. However, AIF selection distal to an embolus revealed sig-nificant differences in the quantitative CTP data recommending avoidance of this location.9It is unclear to what extent these findings
are applicable to patients with aneurysmal subarachnoid hemor-rhage because vasospasm results in narrowing rather than abrupt occlusion of the cerebral arteries. When significant vasospasm (ⱖ50% narrowing) is present, perfusion deficits have been reported in the corresponding vascular territories,1,2supporting the
hypothe-sis that AIF selection distal to severe vasospasm could potentially affect quantitative CTP data. To date, there are no reports in the literature evaluating AIF placement in vasospasm. The purpose of this study was to determine the effect on quantitative CTP when the AIF location is distal to significant vasospasm in patients with aSAH.
MATERIALS AND METHODS
Study DesignA retrospective study of consecutive patients with aSAH enrolled in a prospective clinical trial was performed to compare quanti-tative CTP data when the AIF location is distal to significant va-sospasm (AIFVSP) versus without vasospasm (AIFnon-VSP).
Pa-tients were enrolled in an institutional review board–approved clinical trial at our institution from January 2005 to December 2011. aSAH was diagnosed by NCCT, CTA, DSA, and/or CSF analysis. The following inclusion criteria were applied in this study to compare quantitative CTP data when postprocessing oc-curred with AIFVSPand AIFnon-VSPin each patient: 1) CTA
per-formed at the same time as CTP to determine which vessels were in vasospasm at the time of CTP acquisition, 2) the presence of significant arterial narrowing related to vasospasm on CTA in at least 1 first-order segment of the ACA or MCA, and 3) the absence of significant vasospasm on CTA in at least 1 first-order segment of the ACA or MCA. The exclusion criteria were the following: 1) CTP with extreme patient motion or inadequate contrast bolus for which postprocessing could not be performed, and 2) CTP performed following treatment for vasospasm.
Retrospective chart review was performed to collect demo-graphic data on the study population, including age, sex, Hunt and Hess scale grade, ruptured aneurysm location, and the day CTP was performed following aneurysm rupture.
CTA Scanning and Interpretation
CTA of the head was performed by using a standard scanning protocol at our institution with LightSpeed or Pro 16 scanners (GE Healthcare, Milwaukee, Wisconsin). The scanning parame-ters were 140 kV(peak) and 370 mA at 0.625-mm thickness. A total of 90 mL of nonionic iodinated contrast was administered intravenously at 4 mL/s by using a power injector. Standardized maximum intensity projection images were reconstructed in the coronal, sagittal, and axial planes.
CTA was used to determine the angiographic criteria for prox-imal vasospasm of the first-order cerebral vessels (A1 and M1 segments) on the basis of the arterial luminal narrowing com-pared with the normal parent vessel and baseline CTA performed on admission. On the basis of published data, significant vaso-spasm was defined asⱖ50% narrowing, because this threshold has been shown to be associated with CT perfusion deficits,1,2
while no significant vasospasm was defined as⬍50% narrowing. CTA examinations were interpreted by 2 observers, neuroradi-ologists who performed the clinical interpretation (with 7–27 years’ experience) and another neuroradiologist (with 3 years’ experience) blinded to all clinical and imaging information. Ar-terial caliber measurements were made by measuring the linear diameter of the lumen at the point of greatest narrowing, by using the imaging plane (axial source images or coronal or sagittal ref-ormations) that demonstrated the most severe narrowing and then comparing this diameter with the native arterial luminal di-ameter on baseline imaging performed before the period of vaso-spasm. If no prior imaging was available, the normal-appearing vessel segment immediately proximal to the point of narrowing was used as a reference for normal vessel diameter. If this was also thought to be narrowed secondary to vasospasm, the contralateral vessel was used to approximate normal vessel caliber. If diffuse vasospasm was present and no prior imaging was available for comparison, research reader judgment based on previous clinical experience was used to assess the expected normal vessel caliber to grade vasospasm severity. For disagreements, a third neuroradi-ologist (with 11 years’ experience) independently reviewed the examination in a blinded fashion.
CTP Scanning, Postprocessing, and Data Collection
CTP was performed during the typical time for vasospasm be-tween days 6 and 10 following aneurysm rupture. There is a stan-dard scanning protocol for CTP at our institution by using Light-Speed or Pro 16 scanners (GE Healthcare) with cine 4i scanning mode and 45-second acquisition at 1 rotation per second by using 80 kVp and 190 mA. A scanning volume of 2.0 cm was used, consisting of 4 sections at 5.0-mm thickness with its inferior ex-tent selected at the level of the basal ganglia, above the orbits, to minimize radiation exposure to the lenses. Approximately 45 mL of nonionic iodinated contrast was administered intravenously at 5 mL/s by using a power injector with a 5-second delay.
We performed postprocessing of the acquired dataset into CBF, CBV, and MTT maps on an Advantage Workstation (GE Healthcare) by using CTP software, Version 3.0, using a decon-volution method. The postprocessing technique was standardized for all patients according to recommended guidelines,10selecting
the venous function as the superior sagittal sinus. While we main-tained all postprocessing parameters constant, each CTP dataset was postprocessed 4 times by varying only the AIF location in the A2 segment of the right and left ACAs and M2 segment of the right and left MCAs (Fig 1). Placement of the AIF in the right- and left-sided A2 and M2 segments was performed by a neuroradiologist (with 11 years’ experience) on the basis of the concurrent CTA.
Quantitative analysis was conducted by using a standardized method with contiguous region-of-interest placement, measur-ing 157 mm2, sampling the cerebral cortex. Each CTP section in
each functional map (CBF, MTT, and CBV) had up to 24 ROIs distributed in the following territories: approximately 6 ROIs in the ACA, 12 ROIs in the MCA, and 6 ROIs in the posterior cerebral artery. For accurate comparison of the quantitative CTP data derived from each of the 4 different AIF locations, a region-of-interest tem-plate was created for each patient to replicate the exact size and loca-tion of the region-of-interest sampling at each CTP level.
Statistical Analysis
We performed a power analysis to determine the sample size needed for this study design, analyzing quantitative CTP data from 6 vascular territories (right- and left-sided ACA, MCA, and posterior cerebral artery) in each patient. Bonferroni adjust-ments were performed for multiple comparisons so that the sig-nificance level (␣) remained at .05. An effect size for CBF of 5 mL/100 g/min was used, indicating that the study would be ade-quately powered to detect a mean CBF difference of 5 U (per vascular territory) between the AIFVSPand AIFnon-VSPdata. This
more conservative approach by using a 5-U difference in CBF may not necessarily be clinically significant, but it is important in ensuring that the study design would detect small differences between AIFVSP
and AIFnon-VSPdata. The remaining parameters in the power
analy-sis (mean, SD) were based on pilot data. The sample size calculation was performed by using PASS 2008, Version 8.0.13. All tests were performed as 2-tailed. A sample size of 112 CTP levels (28 patients) achieved 90% power with a significance level (␣) of .05.
Quantitative analysis of the CTP pa-rameters was performed by using a linear mixed-effects model. The response vari-able was CBF; the fixed effects in the model were vascular territory, AIF location, and AIF status (AIFVSPand AIFnon-VSP).
Sub-jects were included as random effects to ac-count for multiple measures per subject. Differences in CBF values in the AIFVSPand
AIFnon-VSP data by vascular territory and
AIF location were reported along with 95% confidence intervals. Overall, this model ac-counts for intersubject variability, variabil-ity in the number of vasospasm and nonva-sospasm vessels among patients, variability in the number of measurements among pa-tients, and missing data. Most important, analysis for all 6 vascu-lar territories can be performed by using this single fitted model. Similar models were fit for the CBV and MTT analysis. Statistical analysis was performed by a biostatistician and con-ducted by using R: A Language and Environment for Statistical Computing (http://www.R-project.org).
RESULTS
Study Population Characteristics
Twenty-eight consecutive patients with aSAH were included to achieve sufficient power for statistical analysis. The mean age was 52⫾11 years. There were 86% (24/28) female and 14% (4/28) male patients. Table 1 demonstrates the characteristics of the study population.
One hundred twelve postprocessed CTP levels were derived from the 28 patients; each patient’s acquired data were repeatedly postprocessed 4 times by varying only the AIF location (right- and left-sided A2 and M2 segments). Of the 112 A1 and M1 vessels assessed for this study, we required a third reader as a tie-breaker in 7.1% (8/112) of vessels. Analysis was performed at the level of the 6 vascular territories (right- and left-sided ACA, MCA, and posterior cerebral artery), resulting in 672 territories for each CBF, CBV, and MTT analysis.
Quantitative CTP Analysis by AIF Location
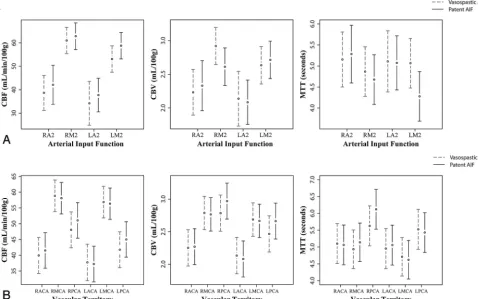
Figure 2Ademonstrates the mean and 95% CI of the quantitative CTP for all vascular territories in both the AIFVSPand AIFnon-VSP
data according to each AIF location. There was no statistically signif-icant difference in the quantitative CBF, CBV, and MTT for any of the AIF locations when they were distal to significant vasospasm.
Quantitative CTP Analysis by Vascular Territory
Figure 2Bdemonstrates the mean and 95% CI of the quantitative CTP for each vascular territory in both the AIFVSPand AIFnon-VSP
data. There was no statistically significant difference in the
[image:3.594.54.370.45.229.2]quan-FIG 1. Examples of the standardized AIF locations selected according to the study protocol. The AIFs (red arrows) are placed in the right and left A2 and M2 segments of the ACA and MCA, respectively, within the same patient. The venous output function (blue arrows) is not varied and held constant within the same patient. The arterial attenuation curves (green) and venous attenuation curves (purple) generated by the respective arterial and venous functions are dem-onstrated to the right of each image. In this particular example, the AIF location in the left M2 segment is distal to vasospasm. Note, the reduced height of its arterial attenuation curve.
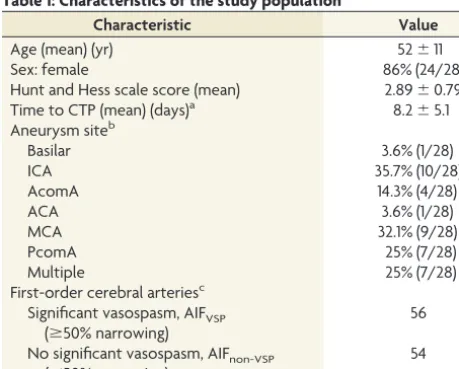
Table 1: Characteristics of the study population
Characteristic Value
Age (mean) (yr) 52⫾11
Sex: female 86% (24/28)
Hunt and Hess scale score (mean) 2.89⫾0.79 Time to CTP (mean) (days)a 8.2⫾5.1
Aneurysm siteb
Basilar 3.6% (1/28)
ICA 35.7% (10/28)
AcomA 14.3% (4/28)
ACA 3.6% (1/28)
MCA 32.1% (9/28)
PcomA 25% (7/28)
Multiple 25% (7/28)
First-order cerebral arteriesc
Significant vasospasm, AIFVSP
(ⱖ50% narrowing)
56
No significant vasospasm, AIFnon-VSP
(⬍50% narrowing)
54
Note:—AcomA indicates anterior communicating artery; PcomA, posterior commu-nicating artery.
aTime from initial diagnosis to CTP scanning. b
Number of patients with an aneurysm at the specified site. Note that the total exceeds 100% because some patients had multiple aneurysms.
c
[image:3.594.53.283.318.503.2]titative CBF, CBV, and MTT for any vascular territory when the AIF location was distal to vasospasm.
Quantitative CTP Analysis by AIF Location and Its Corresponding Vascular Territory
An additional analysis was performed to evaluate quantitative CTP for the MCA and ACA territories when the AIF was located in its supplying artery in both the AIFVSPand AIFnon-VSPdata
(Table 2). There was no statistically significant difference in the
quantitative CBF, CBV, and MTT for any vascular territory when the AIF location in its supplying artery was distal to vasospasm.
DISCUSSION
CTP has been increasingly used in patients with aSAH, given its reported high sensitivity and specificity to detect perfusion abnor-malities thought to occur in vasospasm.1,3-5,10Furthermore,
[image:4.594.54.533.50.349.2]sev-eral studies have reported quantitative threshold values for CBF and MTT to determine perfusion deficits for management and treatment of vasospasm.1,3,4,10 However, generation of FIG 2.A, Model-adjusted mean and 95% CI bars are displayed for the quantitative CBF, CBV and MTT data for all the vascular territories according to the AIF location. The dashed line represents the quantitative data when AIFVSP was used for post-processing and the continuous line represents the quantitative data when AIFnon-VSP was used. B, Model-adjusted mean and 95% CI bars are displayed for the quantitative CBF, CBV and MTT data for each vascular territory when the AIF is located in a vessel with or without proximal vasospasm. The dashed line represents the quantitative data when AIFVSP was used for post-processing and the continuous line represents the quantitative data when AIFnon-VSP was used. ACA indicates anterior cerebral artery; and PCA, posterior cerebral artery.
Table 2: Model-adjusted mean and 95% CI for CBF, CBV, and MTT data classified by the vascular territory and AIF location in its supplying artery in both AIFVSPand AIFnon-VSPdata
Vascular Territory
Cerebral Blood Flow (mL/100 g/min) Cerebral Blood Volume (mL/100 g) Mean Transit Time (sec)
Mean 95% CI Mean 95% CI Mean 95% CI
R ACA
RA2 AIFVSP 38.68 31.23, 46.12 2.23 1.89–2.57 5.16 4.50–5.81
RA2 AIFnon-VSP 42.11 33.79–50.43 2.33 1.96–2.70 5.28 4.60–5.97
R MCA
RM2 AIFVSP 60.99 55.41–66.56 2.92 2.64–3.2 4.87 4.28–5.46
RM2 AIFnon-VSP 62.80 57.13–68.46 2.61 2.33–2.89 4.68 4.09–5.27
L ACA
LA2 AIFVSP 34.23 24.91–43.54 2.14 1.73–2.54 5.11 4.38–5.84
LA2 AIFnon-VSP 37.73 30.58–44.88 2.09 1.76–2.41 5.07 4.43–5.72
L MCA
LM2 AIFVSP 53.09 47.46–58.72 2.63 2.36–2.91 5.07 4.48–5.66
LM2 AIFnon-VSP 58.76 53.14–64.39 2.71 2.44–2.99 4.28 3.69–4.87
Note:—R indicates right; L, left.
[image:4.594.53.533.441.590.2]accurate and reproducible quantitative CTP data relies on se-lecting an appropriate AIF. Standardization of AIF placement by using the A2 segment has been suggested in patients with acute stroke to improve its reproducibility.6This approach is
not feasible in patients with aSAH, given the diffuse and vari-able pattern of vasospasm.
A review of the literature reveals several studies demonstrating the robustness of various AIF locations in patients with acute stroke.6-9,11These studies found that major variations in the AIF
location, whether ipsilateral or contralateral to the affected terri-tory, had no significant effect on the quantitative CTP data.6,8,9,11
Additionally, the ACA and even the superficial temporal artery may be used as appropriate AIF locations in patients with acute stroke, regardless of the cortical region affected; using these loca-tions may assist in its standardization.6,8,9,11Most important,
placement of the AIF in a vessel distal to the embolus has been shown to affect the quantitative CTP data by overestimating MTT and underestimating CBF values due to the marked delay or lack of contrast distal to the clot.9It is physiologically plausible that marked
delay in contrast arrival distal to a vessel in significant vasospasm may also occur in patients with aSAH, affecting the quantitative CTP data, but to our knowledge, this has never been studied.
Significant vasospasm, defined asⱖ50% arterial narrowing, has been found to result in perfusion deficits,1,2suggesting that
this degree of arterial narrowing is hemodynamically significant and potentially could result in delay of contrast arrival in the distal vessel. On the basis of digital subtraction angiography, delay in contrast arrival was found in vessels distal to significant vaso-spasm,12with associated diminished height and prolongation of
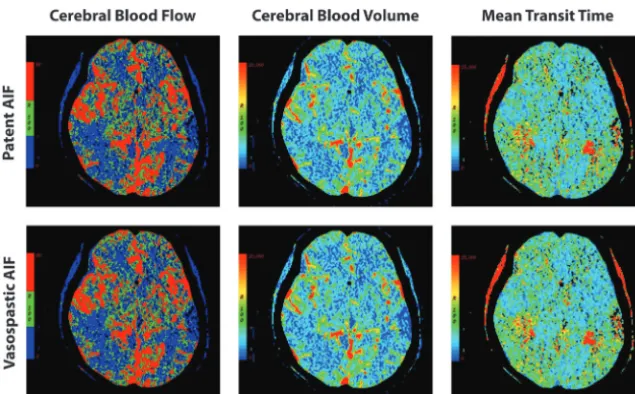
the arterial attenuation curve.13Our study revealed no statistically
significant difference in the quantitative CBF, CBV, or MTT data between AIFVSPand AIFnon-VSPdata (Fig 3) according to the AIF
location and vascular territory. Furthermore, there was no quan-titative difference in these CTP parameters in the ACA or MCA
vascular territories when the AIF location was in its supplying artery distal to signif-icant vasospasm. Even though our soft-ware does not use delay-correction that would likely have demonstrated differ-ences between AIFVSP and AIFnon-VSP
CTP data if present, these findings suggest that the deconvolution-based algorithm is robust to alterations in the arterial at-tenuation curve occurring in significant vasospasm. Similar findings in patients with acute stroke were reported for decon-volution-based algorithms, with delay-in-sensitive techniques producing less pro-nounced differences in quantitative CTP data when AIF placement distal to the em-bolus was used.9Another possible
explana-tion is that the delay in contrast arrival distal to vasospasm is not as severe as that distal to an occlusive embolus, thereby not signifi-cantly affecting CTP quantitation.
These results have several potential implications for patient care in centers us-ing CTP in patients with aSAH. First, flexibility in selectus-ing the AIF location in patients with vasospasm is valuable, given the challenges with streak artifacts from surgical clips or coils and motion degradation in this population. Second, it is not always known at the time of postprocessing the CTP whether a vessel is in vasospasm when selecting the AIF location. Our study suggests that the presence of significant vasospasm does not have to be determined from CTA before selecting an AIF location. Third, given that many postprocessing software programs have fully or semiautomated processing methods to rapidly generate CBF, CBV, and MTT data, our study supports the selection of variable AIF locations in the A2 or M2 segments by automated computer algorithms. Last, AIF placement is not a limiting factor in post-processing CTP data in patients with diffuse vasospasm.
There are several limitations in our study to be considered. We were not able to assess collateral circulation and communicating arteries with great certainty because these vessels were below the diagnostic threshold of the concurrent CTA. Documentation of the collateral circulation would have been helpful to further ex-plore possible explanations of why significant vasospasm does not affect the quantitative data, especially because vasospasm has been shown to delay blood flow and collateral circulation can potentially help maintain perfusion, as seen in acute stroke.14-16
However, the effect of collateral flow on perfusion has not been well-studied in vasospasm and remains uncertain. In addition, AIF location in the posterior circulation was not evaluated because many CTP examinations in this study captured limited areas of the posterior circulation. Finally, because no statisti-cally significant difference was detected between AIFVSPand
AIFnon-VSPCTP data, the risk of our study being underpowered
might be considered as a possible limitation. However, because we were statistically powered to detect differences that are even below the threshold of what many would not consider a clinically signif-icant difference in CBF (5 U), this is unlikely to have affected the
[image:5.594.54.372.45.242.2]significance or validity of our findings. Finally, although we chose a software package without delay-correction that would likely have demonstrated differences between AIFVSPand AIFnon-VSP
CTP data if present, this work will require future validation across multiple software platforms, including those with algorithms in-volving delay-correction, to ensure generalizability across vari-able postprocessing techniques.
CONCLUSIONS
AIF placement distal to significant vasospasm does not signifi-cantly affect the quantitative CTP data in the corresponding vas-cular territory or any other vasvas-cular territory in patients with aSAH. Therefore, vasospasm status should not necessarily influ-ence the selection of the AIF location in either the ACA or MCA segments. This information may be helpful in selecting an AIF location in patients with challenging aSAH with diffuse vaso-spasm and streak artifacts from aneurysm repair or motion.
Disclosures: Benjamin J. Shin—UNRELATED:Stock/Stock Options: I own stock in Amazon, Activision, Disney, Intel, and Verizon (all unrelated). Sandra Hurtado-Ru´a— RELATED:Grant: National Center for Advancing Translational Sciences (NCATS) grant UL1-RR024996,*Comments: This project was supported in part by funds from the Clinical Translational Science Center (CTSC) and NCATS, grant UL1-RR024996. Ranita Campbell—RELATED:Other: Summer Internship Program,Comments: This project was supported in part by funds from the CTSC and NCATS, grant UL1-RR024996. Thomas Caruso—RELATED:Fees for Participation in Review Activities, Such as Data Monitoring Boards, Statistical Analysis, Endpoint Committees, and the Like: Weill Cornell Medical College,Comments: Weill Cornell Medical College paid me a salary that was in return for my input in collecting data for the research stage of the manuscript. Christopher Robinson—UNRELATED:Grants/Grants Pend-ing: Medical Scientist Training Program grant.* Pina C. Sanelli—RELATED:Grant: NINDS NIH grant.* *Money paid to the institution.
REFERENCES
1. Dankbaar JW, Rijsdijk M, van der Schaaf IC, et al.Relationship be-tween vasospasm, cerebral perfusion, and delayed cerebral isch-emia after aneurysmal subarachnoid hemorrhage.Neuroradiology 2009;51:813–19
2. Aralasmak A, Akyuz M, Ozkaynak C, et al.CT angiography and per-fusion imaging in patients with subarachnoid hemorrhage: corre-lation of vasospasm to perfusion abnormality. Neuroradiology 2009;51:85–93
3. Sanelli PC, Ugorec I, Johnson CE, et al.Using quantitative CT
per-fusion for evaluation of delayed cerebral ischemia following aneu-rysmal subarachnoid hemorrhage. AJNR Am J Neuroradiol 2011;32:2047–53
4. Nabavi DG, LeBlanc LM, Baxter B, et al.Monitoring cerebral perfu-sion after subarachnoid hemorrhage using CT. Neuroradiology 2001;43:7–16
5. Binaghi S, Colleoni ML, Maeder P, et al.CT angiography and perfu-sion CT in cerebral vasospasm after subarachnoid hemorrhage.
AJNR Am J Neuroradiol2007;28:750 –58
6. Wintermark M, Lau BC, Chien J, et al.The anterior cerebral artery is an appropriate arterial input function for perfusion-CT processing in patients with acute stroke.Neuroradiology2008;50:227–36 7. Bisdas S, Konstantinou GN, Gurung J, et al.Effect of the arterial
input function on the measured perfusion values and infarct volu-metric in acute cerebral ischemia evaluated by perfusion computed tomography.Invest Radiol2007;42:147–56
8. Sanelli PC, Lev MH, Eastwood JD, et al.The effect of varying user-selected input parameters on quantitative values in CT perfusion maps.Acad Radiol2004;11:1085–92
9. Ferreira RM, Lev MH, Goldmakher GV, et al.Arterial input function placement for accurate CT perfusion map construction in acute stroke.AJR Am J Roentgenol2010;194:1330 –36
10. Wintermark M, Ko NU, Smith WS, et al.Vasospasm after subarach-noid hemorrhage: utility of perfusion CT and CT angiography on diagnosis and management.AJNR Am J Neuroradiol2006;27:26 –34 11. Sheikh K, Schipper MJ, Hoeffner EG.Feasibility of superficial tem-poral artery as the input artery for cerebral perfusion CT.AJR Am J Roentgenol2009;192:W321–29
12. Ohkuma H, Manabe H, Tanaka M, et al.Impact of cerebral micro-circulatory changes on cerebral blood flow during cerebral vaso-spasm after aneurysmal subarachnoid hemorrhage. Stroke 2000;31:1621–27
13. Iwabuchi S, Yokouchi T, Hayashi M, et al.Intra-arterial administra-tion of fasudil hydrochloride for vasospasm following subarach-noid hemorrhage: analysis of time-density curve with digital sub-traction angiography. Neurol Med Chir (Tokyo) 2006;46:535–39, discussion 540
14. Knutsson L, Larsson EM, Thilmann O, et al.Calculation of cerebral perfusion parameters using regional arterial input functions iden-tified by factor analysis.J Magn Reson Imaging2006;23:444 –53 15. Calamante F, Gadian DG, Connelly A.Delay and dispersion effects
in dynamic susceptibility contrast MRI: simulations using singular value decomposition.Magn Reson Med2000;44:466 –73
16. Endo S, Branson PJ, Alksne JF.Experimental model of symptomatic vasospasm in rabbits.Stroke1988;19:1420 –25