warwick.ac.uk/lib-publications
Original citation:
McAllister, M. J., Littlefair, S. P., Baraffe, I., Dhillon, V. S., Marsh, T. R., Bento, J., Bochinski, J.,
Bours, Madelon C. P., Breedt, E., Copperwheat, C. M., Hardy, L. K., Kerry, P., Parsons, S. G.,
Rostron, J. W., Sahman, D. I., Savoury, C. D. J. and Tunnicliffe, R. L.. (2015) PHL 1445 : an
eclipsing cataclysmic variable with a substellar donor near the period minimum. Monthly
Notices of the Royal Astronomical Society, 451 (1). pp. 114-125.
Permanent WRAP URL:
http://wrap.warwick.ac.uk/83091
Copyright and reuse:
The Warwick Research Archive Portal (WRAP) makes this work by researchers of the
University of Warwick available open access under the following conditions. Copyright ©
and all moral rights to the version of the paper presented here belong to the individual
author(s) and/or other copyright owners. To the extent reasonable and practicable the
material made available in WRAP has been checked for eligibility before being made
available.
Copies of full items can be used for personal research or study, educational, or not-for-profit
purposes without prior permission or charge. Provided that the authors, title and full
bibliographic details are credited, a hyperlink and/or URL is given for the original metadata
page and the content is not changed in any way.
Publisher’s statement:
This article has been accepted for publication in Monthly Notices of the Royal Astronomical
Society ©: 2015 The Authors Published by Oxford University Press on behalf of the Royal
Astronomical Society. All rights reserved.
A note on versions:
The version presented in WRAP is the published version or, version of record, and may be
cited as it appears here.
PHL 1445: an eclipsing cataclysmic variable with a substellar donor
near the period minimum
M. J. McAllister,
1‹S. P. Littlefair,
1I. Baraffe,
2V. S. Dhillon,
1T. R. Marsh,
3J. Bento,
4J. Bochinski,
5M. C. P. Bours,
3E. Breedt,
3C. M. Copperwheat,
6L. K. Hardy,
1P. Kerry,
1S. G. Parsons,
7J. W. Rostron,
3D. I. Sahman,
1C. D. J. Savoury
1and R. L. Tunnicliffe
31Department of Physics and Astronomy, University of Sheffield, Sheffield S3 7RH, UK
2Department of Physics and Astronomy, University of Exeter, Exeter EX4 4QL, UK
3Department of Physics, University of Warwick, Coventry CV4 7AL, UK
4Department of Physics and Astronomy, Macquarie University, NSW 2109, Australia
5Department of Physical Sciences, The Open University, Milton Keynes MK7 6AA, UK
6Astrophysics Research Institute, Liverpool John Moores University, Liverpool L3 5RF, UK
7Departmento de F´ısica y Astronom´ıa, Universidad de Valpara´ıso, Avenida Gran Bretana 1111, Valpara´ıso 2360102, Chile
Accepted 2015 April 28. Received 2015 April 27; in original form 2015 March 5
A B S T R A C T
We present high-speed, three-colour photometry of the eclipsing dwarf nova PHL 1445, which, with an orbital period of 76.3 min, lies just below the period minimum of∼82 min for cataclysmic variable stars (CVs). Averaging four eclipses reveals resolved eclipses of the white dwarf and bright spot. We determined the system parameters by fitting a parametrized eclipse model to the averaged light curve. We obtain a mass ratio ofq=0.087±0.006 and inclination
i=85◦.2±0◦.9. The primary and donor masses were found to beMw=0.73±0.03 Mand
Md=0.064±0.005 M, respectively. Through multicolour photometry a temperature of the white dwarf ofTw=13 200±700 K and a distance of 220±50 pc were determined. The evolutionary state of PHL 1445 is uncertain. We are able to rule out a significantly evolved donor, but not one that is slightly evolved. Formation with a brown dwarf donor is plausible, though the brown dwarf would need to be no older than 600 Myr at the start of mass transfer, requiring an extremely low mass ratio (q=0.025) progenitor system. PHL 1445 joins SDSS 1433 as a sub-period minimum CV with a substellar donor. The existence of two such systems raises an alternative possibility that current estimates for the intrinsic scatter and/or position of the period minimum may be in error.
Key words: binaries: close – binaries: eclipsing – brown dwarfs – stars: dwarf novae – stars: individual: PHL 1445.
1 I N T R O D U C T I O N
Cataclysmic variable stars (CVs) are close binary systems, with each system containing a white dwarf primary and low-mass sec-ondary. The secondary star is large enough to fill its Roche lobe and therefore mass is transferred to the white dwarf. In systems with a low-magnetic-field white dwarf, this transferred mass does not immediately accrete on to the surface of the white dwarf, instead forms an accretion disc around it in order to conserve angular
E-mail:[email protected]
mentum. A bright spot forms where the gas stream from the donor impacts the disc. For a general review of CVs, see Hellier (2001).
The structure of CVs can, at some inclinations, result in complex eclipses, with the accretion disc, white dwarf and bright spot all being eclipsed by the secondary star in quick succession. High-time-resolution photometry allows each of these individual features to be observed and their timings determined, which can then be used to determine accurate system parameters (e.g. Wood et al.1986).
Steady mass transfer from the donor secondary to the white dwarf primary is possible due to angular momentum loss from the sys-tem. Without angular momentum loss, mass-loss from the donor increases the size of the Roche lobe until it is no longer filled by the donor, causing mass transfer to cease. Angular momentum loss
at University of Warwick on October 24, 2016
http://mnras.oxfordjournals.org/
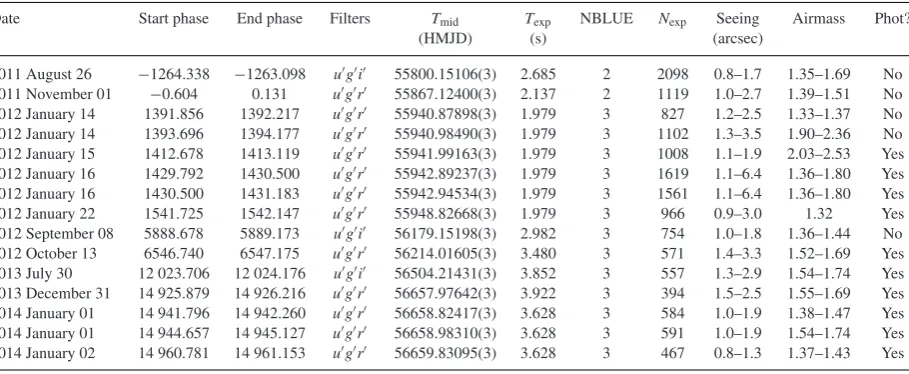
Table 1. Journal of observations. The dead time between exposures was 0.025 s for all observations. The GPS timestamp on each data point is
accurate to 50µs.Tmidrepresents the mid-eclipse time, whileTexpandNexprepresent the exposure time and number of exposures, respectively.
NBLUE indicates the number ofu-band frames which were co-added on-chip to reduce the impact of readout noise. The last column indicates
whether or not the observations were photometric.
Date Start phase End phase Filters Tmid Texp NBLUE Nexp Seeing Airmass Phot?
(HMJD) (s) (arcsec)
2011 August 26 −1264.338 −1263.098 ugi 55800.15106(3) 2.685 2 2098 0.8–1.7 1.35–1.69 No
2011 November 01 −0.604 0.131 ugr 55867.12400(3) 2.137 2 1119 1.0–2.7 1.39–1.51 No
2012 January 14 1391.856 1392.217 ugr 55940.87898(3) 1.979 3 827 1.2–2.5 1.33–1.37 No
2012 January 14 1393.696 1394.177 ugr 55940.98490(3) 1.979 3 1102 1.3–3.5 1.90–2.36 No
2012 January 15 1412.678 1413.119 ugr 55941.99163(3) 1.979 3 1008 1.1–1.9 2.03–2.53 Yes
2012 January 16 1429.792 1430.500 ugr 55942.89237(3) 1.979 3 1619 1.1–6.4 1.36–1.80 Yes
2012 January 16 1430.500 1431.183 ugr 55942.94534(3) 1.979 3 1561 1.1–6.4 1.36–1.80 Yes
2012 January 22 1541.725 1542.147 ugr 55948.82668(3) 1.979 3 966 0.9–3.0 1.32 Yes
2012 September 08 5888.678 5889.173 ugi 56179.15198(3) 2.982 3 754 1.0–1.8 1.36–1.44 No
2012 October 13 6546.740 6547.175 ugr 56214.01605(3) 3.480 3 571 1.4–3.3 1.52–1.69 Yes
2013 July 30 12 023.706 12 024.176 ugi 56504.21431(3) 3.852 3 557 1.3–2.9 1.54–1.74 Yes
2013 December 31 14 925.879 14 926.216 ugr 56657.97642(3) 3.922 3 394 1.5–2.5 1.55–1.69 Yes
2014 January 01 14 941.796 14 942.260 ugr 56658.82417(3) 3.628 3 584 1.0–1.9 1.38–1.47 Yes
2014 January 01 14 944.657 14 945.127 ugr 56658.98310(3) 3.628 3 591 1.0–1.9 1.54–1.74 Yes
2014 January 02 14 960.781 14 961.153 ugr 56659.83095(3) 3.628 3 467 0.8–1.3 1.37–1.43 Yes
reduces the size of the Roche lobe, countering the effect of donor mass-loss and allowing steady mass transfer. Mass transfer in CVs leads to an evolution towards smaller system separations and there-fore shorter orbital periods.
As CVs evolve to shorter orbital periods, their donors are driven further away from thermal equilibrium. This is a quence of mass-loss from the donor, more specifically a conse-quence of the donor’s thermal time-scale increasing at a more rapid rate than its mass-loss time-scale. As mass continues to be transferred from the donor, it eventually enters the substellar regime, and this is approximately where it is far enough away from thermal equilibrium for its radius to no longer decrease in re-sponse to further mass-loss. The degenerate nature of the substellar donor can even cause its radius to increase in response to mass-loss, resulting now in an increasing system separation and orbital period.
CV evolution theory therefore predicts the existence of an orbital period minimum, and this is what is observed, with the period minimum currently estimated to be at 81.8± 0.9 min (Knigge, Baraffe & Patterson 2011). An accumulation of systems is also expected to be found at the period minimum – the ‘period spike’ – due to systems spending more time at this stage in their evolution. This feature has been observed at 82.4±0.7 min (G¨ansicke et al. 2009), in excellent agreement with the period minimum. There are, however, a handful of CVs that have periods below this period minimum.
An example of such a CV, with an orbital period of 76.3 min, is PHL 1445. PHL 1445 was first catalogued as a faint blue object by Haro & Luyten (1962) in the Palomar–Haro–Luyten catalogue, and again (as PB 9151) by Berger & Fringant (1984). It was identified as a CV system by Wils (2009) through spectroscopic analysis of the 6dF Galaxy Survey target 6dFGS g0242429-114646, found to be coincident with PHL 1445. Its spectrum showed double-peaked emission lines, indicating a high inclination and possibly deeply eclipsing system (Wils2009). The eclipsing nature of PHL 1445 was confirmed by Wils et al. (2011) through follow-up photometry, which also gave the first determination of the system’s orbital period. There are multiple ways for a hydrogen-rich CV to have an orbital period shorter than the period minimum. These include
Galactic halo membership (Patterson, Thorstensen & Knigge2008; Uthas et al. 2011), an evolved donor (Thorstensen et al. 2002; Podsiadlowski, Han & Rappaport2003) or formation with a brown dwarf donor (Kolb & Baraffe1999; Politano2004). Obtaining PHL 1445’s donor mass and temperature may help reveal why it lies below the period minimum.
In this paper, we present high-time-resolutionULTRACAMeclipse
light curves of PHL 1445, with system parameters determined through light-curve modelling of an average light curve. Individ-ual light curves are also given the same treatment, in order to see how certain parameters vary between eclipses. The observations are described in Section 2, the results displayed in Section 3, and the analysis of these results in Section 4.
2 O B S E RVAT I O N S
PHL 1445 was observed over seven observing runs (2011 August– 2014 January) usingULTRACAM(Dhillon et al.2007) on the 4.2 m
William Herschel Telescope, La Palma. 15 eclipses were observed in total, the majority observed simultaneously in the SDSS-ugr colour bands, the rest in SDSS-ugi. A complete journal of obser-vations is shown in Table1.
Data reduction was carried out using theULTRACAMpipeline re-duction software (see Feline et al.2004). A nearby, photometrically stable comparison star was used to correct for any transparency vari-ations during observvari-ations. The standard stars Feige 22 (observed at the start of the night on 2012 January 16) and SA92-342 (observed at the end of the night on 2013 July 30) were used to transform the photometry into theugrizstandard system (Smith et al.2002).
The photometry was corrected for extinction using nightly mea-surements of ther-band extinction from the Carlsberg Meridian Telescope,1and subsequently converted intou-,g- andi-band
ex-tinction using the information provided in La Palma Technical Note 31.2
1http://www.ast.cam.ac.uk/ioa/research/cmt/camc_extinction.html 2http://www.ing.iac.es/Astronomy/observing/manuals/ps/tech_notes/
tn031.pdf
at University of Warwick on October 24, 2016
http://mnras.oxfordjournals.org/
The typical out-of-eclipse photometric errors were estimated at 4, 2 and 2 per cent in theu,g andr bands, respectively. These errors increased to approximately 12, 8 and 7 per cent when both the white dwarf and bright spot were eclipsed.
3 R E S U LT S
3.1 Orbital ephemeris
Mid-eclipse times (Tmid) were determined assuming that the white
dwarf eclipse is symmetric around phase zero:Tmid=(Twi+Twe)/2,
whereTwiandTweare the times of white dwarf mid-ingress and
mid-egress, respectively.TwiandTwewere determined by locating
the minimum and maximum times of the smoothedg-band light-curve derivative. TheTmiderrors (see Table1) were adjusted to give
χ2=1 with respect to a linear fit. The eclipse observed on 2011
August 26 is the exception here, as no white dwarf features can be seen in the eclipse due to PHL 1445 being in outburst. In this instance, the time of minimum light was used forTmid.
All eclipses, with the exception of the 2011 August outburst eclipse, were used to determine the following ephemeris:
HMJD=55867.123984(12)+0.0529848884(13)E.
This ephemeris was used to phase-fold the data for the analysis that follows.
3.2 Light-curve morphology and variations
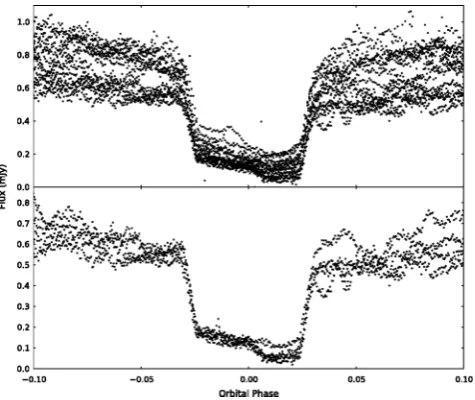
Aside from the single outburst eclipse mentioned above, all other observations listed in Table1show a strong white dwarf eclipse feature. The same cannot be said for a bright spot feature, as a bright spot ingress can be discerned in most cases, but not one eclipse shows a clear egress. The reason for the lack of clear bright spot egress in any of these light curves is the strong flickering seen in this system. The flickering appears to begin immediately after white dwarf egress at around phase 0.03 (see Fig.1), implying that its source is close to the white dwarf, either in the inner disc or boundary layer.
[image:4.595.45.283.505.705.2]To help reduce the prominence of the strong flickering present, and to be able to locate the position of the bright spot egress, it was
Figure 1. Top: all 14 quiescent PHL 1445g-band eclipses observed.
Bottom: four PHL 1445g-band eclipses chosen to create an average.
necessary to average multiple eclipses together. The 10 eclipses showing signs of a bright spot ingress were phase-folded using the ephemeris above and averaged, allowing a broad, faint bright spot egress feature to emerge. Averaging also seemed to reduce the strength of the bright spot ingress. After analysing each individual eclipse, it was apparent that the position of the bright spot ingress varied significantly across the range of observations due to changes in accretion disc radius. This is the reason for the bright spot ingress feature becoming broad and weak in the average eclipse.
To fix this issue, four eclipse light curves (phases 0, 1413, 1430 and 1431) observed not too far apart in time (2011 November–2012 January), with clear bright spot ingresses at a similar position, were phase-folded and averaged. It is apparent from Fig.1that these four chosen eclipses occurred when PHL 1445 was in the lower of two distinct photometric states (clear gap visible in top plot just before white dwarf ingress), although this was not a criterion for choosing candidates for the average. A further two eclipses were observed within this time span (both on January 14), but were not used due to a mixture of bad observing conditions and lack of a visible bright spot ingress. This new average light curve revealed much sharper bright spot features than that consisting of all 10 eclipses, and it is worth noting that the position of the bright spot egress remained unchanged from the 10-eclipse average. The total rms of this average light curve’s residuals is approximately 7 per cent, which is significantly larger than the typical photometric error (∼2 per cent) and shows that while flickering has been decreased through averaging, it continues to be an issue. A model was then fitted to this average light curve, in order to obtain the system parameters (Fig.2).
3.3 Phase-folded average light-curve modelling
The model of the binary system used here to calculate eclipse light curves contains contributions from the white dwarf, bright spot, accretion disc and secondary star, and is described in detail by Savoury et al. (2011). We note briefly that the model constrains the mass ratio (q), white dwarf radius as a fraction of the binary sep-aration (Rw/a), white dwarf eclipse phase full-width at half-depth
(φ) and white dwarf flux; these parameters can then be used to calculate system parameters (see Section 3.4). It is worth noting that we use a simplified version of the bright spot model (as described in Littlefair et al.2007), as none of the derived system parameters were found to change significantly between models, and an F-test (Press et al.2007) showed the extra complexity is not justified for PHL 1445. The model requires a number of assumptions, including that of an unobscured white dwarf (Savoury et al.2011). The va-lidity of this assumption has recently been questioned by Spark & O’Donoghue (2015), through fast photometry observations of the dwarf nova OY Car. It is not yet completely clear that the results of Spark & O’Donoghue (2015) cannot be explained by flicker-ing in the boundary layer and inner disc, and coupled with agree-ment between photometric and spectroscopic parameter estimates (Copperwheat et al.2012; Savoury et al.2012) we feel an unob-scured white dwarf is still a reasonable assumption to make.
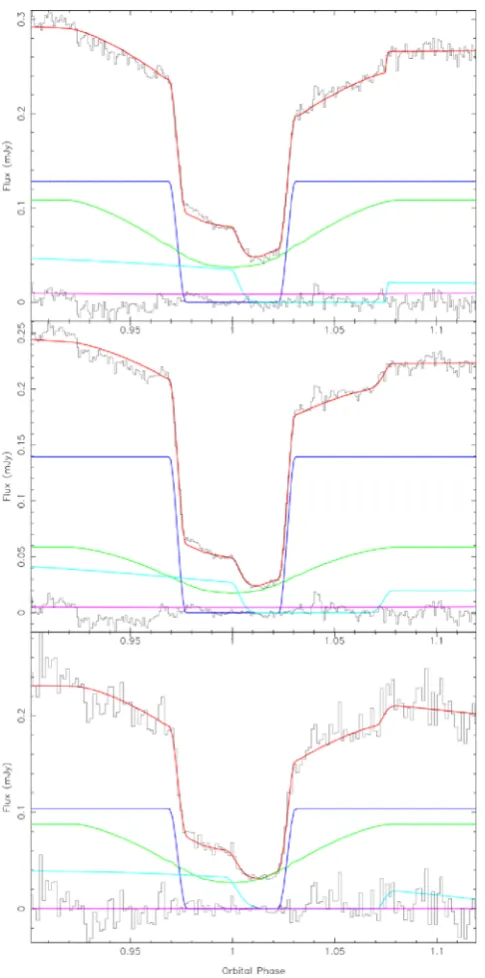
As discussed in Section 3.2, four PHL 1445 eclipses were phase-folded and averaged, with the resulting light curves in theu, g andr bands shown in Fig.2. Initial Markov chain Monte Carlo (MCMC) fits to theu-,g- andr-band data were carried out. All model parameters were left to be fitted freely, apart from the white dwarf limb-darkening parameter (Uw), which was kept fixed at an
initial value of 0.345. The reason for keepingUwfixed is that we
at University of Warwick on October 24, 2016
http://mnras.oxfordjournals.org/
Figure 2. Model fits (red) to average PHL 1445 light curves (black) in
r (top),g (middle) andu(bottom) bands. Also shown are the different
components of the model: white dwarf (dark blue), bright spot (light blue), accretion disc (green) and donor (purple). The residuals are at the bottom of each plot.
cannot accurately constrain this parameter with the quality of data available.
The white dwarf fluxes returned from these initial model fits were then fitted – again using MCMC routines – to white dwarf atmosphere predictions (Bergeron, Wesemael & Beauchamp1995), in order to derive initial estimates of the temperature, loggand distance. Reddening was also included as a parameter, in order for its uncertainty to be taken into account when determining the error in temperature, but is not constrained by our data. All priors used were uninformative and uniform. Systematic errors of 5 per cent were added to the white dwarf fluxes returned by the model fitting,
as the formal errors did not take into account any uncertainties in our absolute photometry.
With rough estimates of the white dwarf temperature and logg known, more reliableUwvalues could be obtained using the data
tables in Gianninas et al. (2013). Limb-darkening parameters of 0.469, 0.390 and 0.340 were determined for theu,gandrbands, respectively. The typical value of 0.345 forUwwas replaced with
these new values and – again keepingUwfixed – the eclipse model
fits were carried out for a second and final time.
3.4 System parameters
The mass ratio (q), white dwarf eclipse phase full-width at half-depth (φ) and scaled white dwarf radius (Rw/a) posterior
probabil-ity distributions returned by the MCMC fits described in Section 3.3 can be used along with Kepler’s third law, the system orbital period and a temperature-corrected white dwarf mass–radius relationship (Wood1995) to calculate the posterior probability distributions of the system parameters (Savoury et al.2011). These system param-eters include
(i) mass ratio,q;
(ii) white dwarf mass,Mw;
(iii) white dwarf radius,Rw;
(iv) white dwarf logg; (v) donor mass,Md;
(vi) donor radius,Rd;
(vii) binary separation,a;
(viii) white dwarf radial velocity,Kw;
(ix) donor radial velocity,Kd;
(x) inclination,i.
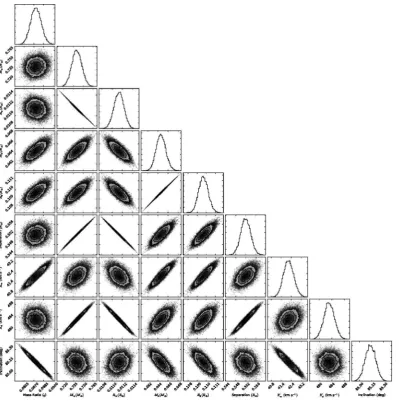
Combining the posterior probability distributions from theu, g andrbands gave the total posterior distributions for each system parameter (Fig.3), with the peak of this distribution taken as the value of that particular system parameter. Upper and lower error bounds are derived from the 67 per cent confidence levels. Fig.4 shows a corner plot for theg-band fit, which exposes degeneracies between certain system parameters.
[image:5.595.309.549.517.694.2]The system parameters were calculated twice in total. The value for loggreturned from the first calculation was used to constrain the loggprior in a second MCMC fit involving the white dwarf
Figure 3. Normalized posterior probability density functions (black) for each parameter of the model. The red, green and blue distributions represent
ther-,g- andu-band fits, respectively.
at University of Warwick on October 24, 2016
http://mnras.oxfordjournals.org/
Figure 4. Corner plot ofg-band fit showing correlations of varying strengths between system parameters.
atmosphere predictions (Bergeron et al.1995). This second MCMC fit also used white dwarf fluxes from four wavelength bands instead of the three used previously. The additionali-band white dwarf flux was obtained through fitting the eclipse model to the individuali -band eclipse from the 2012 September observation (see Section 3.5 for more details on this and other individual eclipse fitting). A systematic error of 3 per cent had to be added to the fluxes in order to reach a χ2of ∼1, which is of the same order as the
out-of-eclipse photometric error (∼2 per cent) and approximately half that of the error associated with flickering (∼5 per cent). The use of an additional bandpass and a constraint on loggresulted in more precise values for the white dwarf temperature and distance. This new temperature was then used to obtain a more reliable white dwarf mass–radius relationship, which was used in the second calculation of the system parameters.
Fig.5shows a white dwarf colour–colour plot, containing both the colour of the white dwarf in PHL 1445 and models from Bergeron et al. (1995). As expected, there is good agreement between the colour of the white dwarf and the temperature and log gvalues determined from fitting to these models.
Figure 5. White dwarf colour–colour plot. The PHL 1445 white dwarf is shown by the red data point and the black lines represent white dwarf models
of varying loggfrom Bergeron et al. (1995).
at University of Warwick on October 24, 2016
http://mnras.oxfordjournals.org/
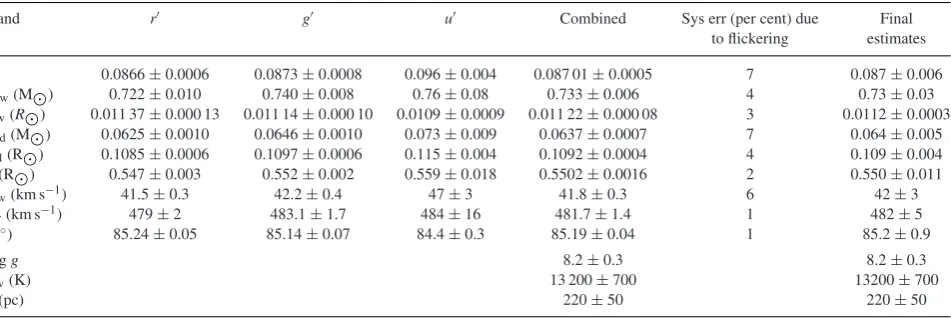
[image:6.595.306.546.504.683.2]Table 2. System parameters for PHL 1445. The errors in the combined column are returned by the model and are purely statistical. The errors in the
final column take into account the systematic error due to flickering.Twanddrepresent the temperature and distance of the white dwarf, respectively.
Band r g u Combined Sys err (per cent) due Final
to flickering estimates
q 0.0866±0.0006 0.0873±0.0008 0.096±0.004 0.087 01±0.0005 7 0.087±0.006
Mw(M) 0.722±0.010 0.740±0.008 0.76±0.08 0.733±0.006 4 0.73±0.03
Rw(R) 0.011 37±0.000 13 0.011 14±0.000 10 0.0109±0.0009 0.011 22±0.000 08 3 0.0112±0.0003
Md(M) 0.0625±0.0010 0.0646±0.0010 0.073±0.009 0.0637±0.0007 7 0.064±0.005
Rd(R) 0.1085±0.0006 0.1097±0.0006 0.115±0.004 0.1092±0.0004 4 0.109±0.004
a(R) 0.547±0.003 0.552±0.002 0.559±0.018 0.5502±0.0016 2 0.550±0.011
Kw(km s−1) 41.5±0.3 42.2±0.4 47±3 41.8±0.3 6 42±3
Kr(km s−1) 479±2 483.1±1.7 484±16 481.7±1.4 1 482±5
i(◦) 85.24±0.05 85.14±0.07 84.4±0.3 85.19±0.04 1 85.2±0.9
logg 8.2±0.3 8.2±0.3
Tw(K) 13 200±700 13200±700
d(pc) 220±50 220±50
The calculated system parameters can be found in Table2. The errors in the first three columns of Table2are those resulting from the MCMC fitting only, and do not account for uncertainties related to the assumptions associated with the model (see Savoury et al. 2011) or those arising from the effects of flickering. Flickering affects the system parameters because it decreases the accuracy to which the eclipse timings – especially bright spot ingress and egress – can be measured. As this particular system displays strong flickering, it is clear that the errors on the system parameters from the model are underestimated, even though multiple light curves have been averaged.
To probe the effects of flickering, four additionalg-band average light curves were produced and fitted with the eclipse model. Each of these new light curves contained a different combination of three of the four individual light curves used in the originalg-band average light curve. The spread of system parameters obtained from these four MCMC fits gives a more realistic idea of the errors involved; the errors in the final column of Table2include our estimate of the uncertainty introduced by flickering.
3.5 Individual light-curve modelling
After determining various system parameters using an average eclipse light curve, the eclipse model could now be fitted to in-dividual light curves (as long as they showed signs of a bright spot ingress), using the model fit parameters as a starting point. The eclipse model parametersq,φ,Rw/aandUwdo not vary with
time, so these parameter values were kept fixed in the individual fits.
In total there were 10 eclipses that showed signs of a bright spot ingress feature, and therefore qualified for individual MCMC fitting, including the four used in the phase-folded average fitting. All but one of these eclipses were observed in the wavelength bands ugr; the other inugi. Each individual eclipse was fitted in each of the three bands, with the starting model parameters depending on the band. The one i-band eclipse (2012 September 08) was given the overallg-band model parameters as a starting point in the MCMC fitting, but using ani-bandUwvalue of 0.301 (Gianninas
et al.2013). Successful fits to bright spot ingress were achieved for all 10 eclipses. Sinceqandφ were held fixed, and bright spot ingress/egress timings are functions ofq,φand radius of the
accretion disc as a fraction of the binary separation (Rdisc/a),Rdisc/a
could be constrained for all 10 eclipses.
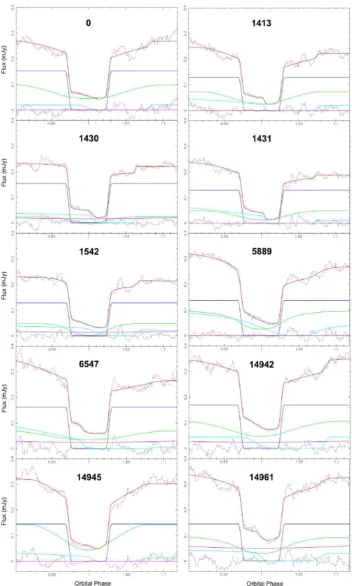
The individualg-band light curves and corresponding eclipse model fits are shown in Fig.6. Individual eclipse fitting should enable us to analyse how various parameters vary from eclipse to eclipse, for example disc radii and component fluxes. However, due to the strong flickering present in each light curve, it is important to check these fits are genuine and interpret the results with care. Looking at the individual fits in Fig.6, it is clear that not all achieve a true fit to the bright spot features (e.g. cycle numbers 5889, 14942 and 14945), and this will be taken into account in the following discussion.
The individual eclipse fitting carried out on PHL 1445 provided nine separate sets ofugrfluxes for the white dwarf, accretion disc and bright spot. Following Section 3.4, a systematic error of 3 per cent was added to all fluxes returned by the individual fits. There was no evidence for a varying white dwarf temperature across these nine observations.
3.5.1 Accretion disc
Individual eclipse fitting produced a value of Rdisc/afor all 10
eclipses. This value from the model is actually the bright spot’s distance from the white dwarf as a fraction of the binary separation, but we assume that the bright spot is lying at the edge of the accretion disc. With theu-band fits being the least reliable due to the low quality of light curves, only the r-,i- andg-bandRdisc/awere
used. For each eclipse, an average of ther-,i- andg-bandRdisc/a
was plotted againstTmidto show how the disc varies with time, as
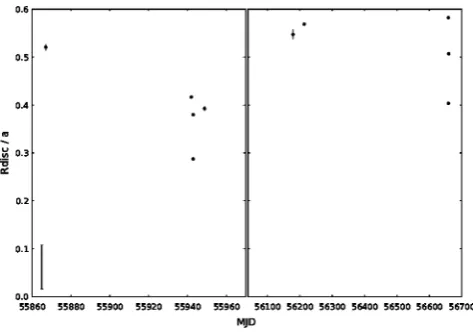
shown in Fig.7. The plot is split into two due to a sizeable time gap between observations.
The individual errors displayed in Fig.7are from the model fits, and are dramatically underestimated due to the effects of flickering. There is a systematic error on the disc radius of approximately 10 per cent due to flickering, and this is represented by the bar in the bottom-left corner of Fig. 7. Without the introduction of this systematic error, the disc changes appear to be very large, for example take the successive eclipses of 1430 and 1431. In the time of just one orbital period (76.3 min),Rdisc/aincreases from
approximately 0.288 to 0.380, implying a disc expansion velocity of 7200 m s−1, which is significantly faster than the 2 m s−1‘viscous
velocity’ of material within the disc. As Fig.6shows, both of these
at University of Warwick on October 24, 2016
http://mnras.oxfordjournals.org/
Figure 6. Model fits (red) to individual PHL 1445g-band eclipses (black). The additional coloured lines are explained in Fig.2. The cycle numbers of each eclipse are also displayed.
eclipses have clear bright spot ingress features. The fit to the bright spot ingress in the 1431 eclipse is far better than that in the 1430 eclipse, and this may be the real reason for the large disc radius expansion observed over this orbital cycle. The poor fit to the bright
spot ingress in cycle 1430, and in many other individual eclipses (Fig.6), is most likely due to the large amount of flickering, which we address with the introduction of a 10 per cent systematic error. It must be noted that in some individual eclipses with weak bright
at University of Warwick on October 24, 2016
http://mnras.oxfordjournals.org/
Figure 7. PHL 1445 accretion disc radius (Rdisc) as a fraction of the binary
separation (a) versus time (in MJD). Individual errors are purely statistical,
and in most cases the error bars are smaller than the data points. The bar in the bottom-left corner gives an indication of the real error due to flickering.
The figure is split into two due to a large gap in time (∼200 d) between
observations.
spot features (e.g. cycle numbers 1542 and 5889) the bright spot ingress is hardly fit at all, resulting in much more uncertain values ofRdisc/ain these cases.
The left-hand plot in Fig.8shows how the flux of the disc varies with disc radius. Again, the individual errors are underestimated, and the errors introduced by flickering are represented by the bars in the top-left corner of each plot. To measure the reliability of these flux changes, we again turn to the successive eclipse cycles 1430 and 1431. Here we find that in one orbital period the disc flux increases by∼0.025 mJy, but at the same time the white dwarf flux drops by the same amount. Such a change in white dwarf flux over one orbital cycle is not expected, and it is clear by looking at Fig.6that a fraction of the white dwarf flux in cycle 1430 has in the following cycle been fitted by the disc component instead. This may not be the case for all individual eclipse fits, but it does question the reliability of the model disc flux values. The most likely cause for this is the large amount of flickering in these individual eclipse light curves, which confirms the need for a large systematic error to account for it. Despite the large errors, there does appear to be a
positive correlation between these two disc parameters. There is no evidence for changes in disc temperature, so the trend in Fig.8, if real, appears to be simply due to a larger disc radius resulting in a larger disc surface area and therefore flux.
3.5.2 Bright spot
The bright spot fluxes were also plotted againstRdisc/a(see the
right-hand plot in Fig.8). Unlike the disc fluxes, on the whole the bright spot fluxes appear to stay relatively constant across the different disc radii. Assuming that the main contributor to bright spot flux is the relative velocity of the gas stream as it impacts with the disc, we modelled the gas stream and calculated its velocity relative to the disc for a number of disc radii across the range 0.2<Rdisc/a<0.6.
The relative velocity of the gas stream only increased by a factor of 2 across this range, which could explain why we see little variation in bright spot fluxes.
An attempt was also made to determine bright spot temperatures from the bright spot fluxes. The bright spot fluxes in each band from each eclipse were used to calculate bright spot colours, and then compared to local thermal equilibrium hydrogen slab models calculated usingSYNPHOT in IRAF. Due to the large error bars on
the eclipse fluxes, and the rapid changes in colour with variations in temperature and density associated with the models, accurate bright spot temperatures could not be determined in this particular case.
4 D I S C U S S I O N
4.1 Component masses
[image:9.595.73.526.516.696.2]We find a white dwarf mass of 0.73± 0.03 Min PHL 1445, which is much larger than that of white dwarfs in single and pre-CV systems (Kepler et al.2007; Zorotovic, Schreiber & G¨ansicke 2011), but is identical to the average white dwarf mass in CV systems below the period gap (0.73±0.05 M) found by Knigge (2006). It is however lower than the mean white dwarf mass found by Savoury et al. (2011) within a group of 14 short-period CVs (0.81± 0.04 M). We expect this mass for the white dwarf in PHL 1445 to be reliable, as previous mass determinations using this method agree with those obtained through spectroscopic methods
Figure 8. PHL 1445 accretion disc flux (left) and bright spot flux (right) versus radius (Rdisc) as a fraction of the binary separation (a). Red, green and blue
data points representr-,g- andu-band observations, respectively. Individual errors are purely statistical, and in most cases the error bars are smaller than the
data points. The bars in the top-left corners of each plot give an indication of the real error due to flickering.
at University of Warwick on October 24, 2016
http://mnras.oxfordjournals.org/
(Tulloch, Rodr´ıguez-Gil & Dhillon2009; Copperwheat et al.2012; Savoury et al.2012).
As for the donor in PHL 1445, we find that it has a mass of 0.064±0.005 M. This is just below the hydrogen burning mass limit of∼0.075 M(Kumar1963; Hayashi & Nakano1963), which suggests that it is substellar.
4.2 Flickering
One particular feature of the PHL 1445 eclipses is high-amplitude flickering. This is much larger than the flickering observed in other known CVs with substellar donors (see Section 4.4), and appears to be originating from the inner accretion disc, near the white dwarf. The accretion disc and bright spot fluxes as a fraction of the white dwarf flux were calculated inu,gandr, and compared with those from other CVs with substellar donors. PHL 1445’s disc fluxes are nearly double those of the second highest disc flux system, which suggests that the enhanced flickering is associated with a brighter disc.
4.3 Evolutionary state of PHL 1445
It is known that PHL 1445 consists of an accreting white dwarf and a donor star, but what is not known is the nature of this donor star. It is possible that PHL 1445 lies below the period minimum because it contains an unusual donor star, one most likely off the main sequence. We have determined a mass, radius and flux for the donor star of PHL 1445, allowing us to investigate this.
One possibility is that PHL 1445 is a Galactic halo object. A system belonging to the Galactic halo would typically have a metal-poor donor star, meaning a smaller-than-expected radius for its mass and therefore a higher density. Due to the inverse relation between density of a Roche lobe-filling donor star and the orbital period of a system, a metal-poor donor is one way for a CV system to have an orbital period below the period minimum (Patterson et al. 2008). This was found to be the case for SDSS J150722.30+52309.8 (SDSS 1507), another CV with an orbital period (67 min) below the minimum (Patterson et al.2008; Uthas et al.2011).
SDSS 1507’s halo membership is supported by both its unusually high space velocity (167 km s−1), calculated from its distance and
proper motions by Patterson et al. (2008), and sub-solar metallicity determined from UV spectroscopy by Uthas et al. (2011). Using our distance to PHL 1445 and proper motions listed in the PPMXL catalogue (Roeser, Demleitner & Schilbach2010), a transverse ve-locity of 39±9 km s−1was calculated. This is significantly lower
than that for SDSS 1507, and is very close to the average trans-verse velocity of 33 km s−1for CVs (Patterson et al.2008), which
is evidence against PHL 1445 being a member of the Galactic halo. Another explanation for the short orbital period is a donor star that is already evolved at the start of mass transfer. One way of determining the evolutionary stage of a star is through its compo-sition, which can be determined from its spectrum. A spectrum for PHL 1445 is shown in Wils (2009), but this is not useful to us as it is dominated by the other components of the CV, not the donor. This is not surprising, as we also fail to directly detect the donor (see Fig.2). Through model fitting we do obtain an upper limit for the donor flux, which is actually a measure of the total uneclipsed flux from the system.
Thorstensen et al. (2002) show that an evolved donor with a central hydrogen abundance ofXc =0.05, in a system with PHL
1445’s orbital period, should have a temperature in excess of 4000 K, while Podsiadlowski et al. (2003) show anXc=0.1 evolved donor
in a similar system to have a temperature somewhere between 1500 and 2000 K. Through knowledge of PHL 1445’s donor angular diameter and flux from the eclipse model, we are able to rule out a 4000 K donor, but do find some agreement with a 1500–2000 K donor.
g −r colours were estimated for both a 4000 K and 1800 K donor. The colour for the 4000 K donor was found through the linear relation betweenTeffandg−r (Fukugita et al.2011), but
this relation does not extend to below∼3800 K so semi-empirical model isochrones had to be used in order to obtain a colour for the 1800 K donor (Baraffe et al.1998; Allard, Homeier & Freytag 2011; Bell et al.2014). From these colours,r-band zero-magnitude angular diameters were calculated and used together with the donor angular diameter to produce an apparentr-band donor magnitude at each temperature (Boyajian, van Belle & von Braun2014). It must be noted that the colour obtained for the 1800 K donor lies outside the valid range given by Boyajian et al. (2014) for their magnitude–angular diameter relation.
Donor fluxes of (15.9 ± 1.1) × 10−2 and (0.33 ±
0.18)×10−2mJy were calculated for 4000 and 1800 K,
respec-tively. The 4000 K donor is approximately 13 times the (1.27± 0.08)×10−2mJy upper limit for ther-band donor flux from the
eclipse model, while the 1800 K donor flux is approximately four times smaller. Analysis of the donor flux hence shows that a slightly evolved donor (Xc =0.1) cannot be ruled out for PHL 1445, and
may be the reason for its unusually short orbital period.
PHL 1445 could also lie below the period minimum because it formed directly with a brown dwarf donor. These systems can start out with periods much shorter than the period minimum, but evolve towards longer orbital periods like post-period bounce CVs (Kolb & Baraffe1999). We investigate whether PHL 1445 could have formed with a brown dwarf donor by studying the relation between donor mass and orbital period (see Fig.9). Fig.9shows a number of different evolutionary tracks. The red track is from Knigge et al. (2011) and represents a CV with a main-sequence donor. These CVs evolve from longer periods to shorter ones until the period minimum (vertical dashed line) is reached, at which point the track inverts and heads back to longer periods. The green track is from Thorstensen et al. (2002) and represents a system containing an evolved donor withXc =0.05. Above we rule out
the possibility of such a highly evolved donor, and this is supported by the fact that the PHL 1445 data point lies comfortably below this line. The solid blue line is from Kolb & Baraffe (1999) and represents a system that formed with a brown dwarf donor. It would appear that the PHL 1445 data point lies far from this track, but this track is computed from an old model, using a gravitational-radiation (GR) based angular momentum loss rate and ignoring deformation of the donor. Knigge et al. (2011) showed that tracks with these assumptions cannot fit the observed locus of CVs in the MdversusPorbdiagram, and that models which include deformation
and an angular momentum loss rate of 2.47×GR are required. The main-sequence donor track (red) in Fig.9takes into account both a 2.47×GR angular momentum loss rate and deformation (Renvoiz´e et al.2002), and for the additional brown dwarf donor tracks (blue: dashed, dot–dashed and dotted) we have done the same. All three of these tracks have been calculated from a model containing a 0.75 Mprimary and a donor of initial mass 0.07 M, with an additional variable parameter being the age of the donor at the start of mass transfer (tinit). This is an important parameter with regard
to understanding the subsequent evolution of such a system, since a substellar object has a time-dependent radius. The dashed, dot– dashed and dotted blue lines representtinit’s of 2 Gyr, 1 Gyr and
at University of Warwick on October 24, 2016
http://mnras.oxfordjournals.org/
Figure 9. Donor mass (Md) versus orbital period (Porb) for PHL 1445 and other substellar donor CVs: SDSS 1433, SDSS 1035 and SDSS 1507 (Savoury
et al.2011). Also plotted are a number of evolutionary tracks: main-sequence donor (red line; Knigge et al.2011), evolved donor withXc=0.05 (green line;
Thorstensen et al.2002) and brown dwarf donor (solid blue line; Kolb & Baraffe1999). The three additional blue lines also show tracks for brown dwarf
donors but with modified physics and varying donor age at the start of mass transfer (tinit). The dashed, dot–dashed and dotted blue lines representtinit’s of
2 Gyr, 1 Gyr and 600 Myr, respectively. The vertical dashed black line represents the location of the CV period minimum determined by Knigge et al. (2011),
with the shaded area representing the error on this value. The bar across the top of the plot shows the FWHM of the CV period spike observed by G¨ansicke
et al. (2009).
600 Myr, respectively. The latter of these tracks – with atinit of
600 Myr – is consistent with the PHL 1445 data point, but how feasible is such a proposed system?
In order for mass transfer to start so early in the system’s life-time, the primary star must have evolved off the main sequence very quickly to leave a white dwarf ready for mass transfer. This puts a lower limit on the initial primary mass of 2.8 M(Girardi et al. 2000). Considering that the secondary has an initial mass no greater than 0.07 Mwould mean an initial mass ratio of approximately 0.025 or less. This is extremely low, and main-sequence star/brown dwarf binaries with extreme mass ratios are rare, but it would seem that they are able to form (Grether & Lineweaver2006). Binaries with such low mass ratios have been observed, for example HIP 77900B, which has a mass ratio as low as 0.005 (Aller et al.2013), although its separation is also extreme at 3200 au. There is also ob-servational evidence for binaries with A-type star primaries to have a bias towards low mass ratios of less than 0.1 (Kouwenhoven et al. 2005). It is thus a possibility that PHL 1445 formed directly from a binary system with a very low mass ratio containing a>2.8 M primary and brown dwarf secondary.
4.4 PHL 1445: a possible period bouncer?
Another CV, SDSS J143317.78+101123.3 (SDSS 1433), has also been found to host a substellar donor (Littlefair et al.2008; Savoury et al.2011). SDSS 1433 – with an orbital period of 78.1 min and donor mass of 0.0571±0.0007 M– was claimed to be a post-period bounce system by both Littlefair et al. (2008) and Savoury et al. (2011). Current estimates now place the period minimum at 81.8±0.9 min (Knigge et al.2011), suggesting that SDSS 1433 may not, in fact, be a period bouncer.
With an orbital period below the period minimum and a substel-lar donor, SDSS 1433 may be another system that formed with a brown dwarf donor. This is supported by plotting SDSS 1443 on
the sameMdversusPorbdiagram as PHL 1445 (see Fig.9). SDSS
1433 also appears to lie on the evolutionary track associated with a brown dwarf donor of age 600 Myr at the start of mass transfer, and therefore may have had a progenitor system with the same, ex-tremely low mass ratio as that of PHL 1445. The chances of finding two systems with such similar, extreme initial mass ratios should be very low, so the fact we do raises some suspicion.
There are currently only four CV systems that have been found to contain substellar donors: PHL 1445, SDSS 1433, SDSS 1507 and SDSS J103533.03+055158.4 (SDSS 1035) (Littlefair et al.2008; Savoury et al.2011). SDSS 1507 was mentioned in the previous section, and lies below the period minimum due to being a member of the Galactic halo. SDSS 1035 has an orbital period slightly above the period minimum (82.1 min; Savoury et al.2011), and is thought to be a period bouncer. So out of a sample of just four systems known to contain substellar donors, 50 per cent of them may have formed with a brown dwarf donor, and in progenitor systems with a similar mass ratio.
This does not fit with the observation of a ‘brown dwarf desert’ (Duquennoy & Mayor 1991; Marcy & Butler 2000; Grether & Lineweaver2006): the lack of brown dwarfs observed in binaries with main-sequence primaries and separations<3 au. The link be-tween the ‘brown dwarf desert’ and CVs formed with brown dwarf secondaries was made by Politano (2004). Through population syn-thesis, Politano (2004) found that the majority of progenitors of zero-age CVs with brown dwarf secondaries have orbital separa-tions and primary masses that coincide with this ‘desert’, explaining the dearth of CVs with substellar donors and periods below the pe-riod minimum.
The ‘desert’ is not completely arid, however, and a number of such systems do exist (Duchˆene & Kraus2013). Taking all of this into consideration, we would expect to see significantly more post-period bounce systems than those formed directly with a brown dwarf donor, not the equal numbers found. This may be due to an
at University of Warwick on October 24, 2016
http://mnras.oxfordjournals.org/
observational bias against period-bounce CVs, but it is unclear what would cause this. It is therefore unlikely that PHL 1445 and SDSS 1433 are systems that formed with a brown dwarf donor, which opens up the possibility that both may actually be normal CVs, lying within the intrinsic scatter of the period minimum.
The current period minimum at 81.8±0.9 min (vertical dashed line in Fig.9) was determined by Knigge et al. (2011) through fit-ting a semi-empirical donor-based CV evolution track (red track in Fig. 9) to the masses of a sample of CV donors. This sample of donors contains an intrinsic dispersion ofσint=0.02 dex (Knigge
et al.2011), introducing an intrinsic scatter around the period min-imum of equal value. This is equivalent to an intrinsic dispersion ofσint=3.7 min, significantly larger than the 0.9 min error on the
period minimum location. Approximately one third of this intrinsic scatter is due to the∼20 per cent dispersion in white dwarf masses of the sample (Knigge2006). The majority of the remaining er-ror can probably be attributed to a distribution in mass-loss rates, associated with residual magnetic braking below the CV period gap. This residual magnetic braking may explain why Knigge et al. (2011) require additional angular momentum loss below the period gap in order to produce a CV evolution track that is in agreement with the donor sample.
An independent measure of the intrinsic scatter can be obtained from the ‘period spike’ analysis in G¨ansicke et al. (2009). The position of the period spike at 82.4±0.7 min is a good match to the period minimum from Knigge et al. (2011), and G¨ansicke et al. (2009) – assuming a Gaussian distribution – find a full width at half-maximum (FWHM) of 5.7 min for this feature (see Fig.9). The intrinsic scatter on the period spike is thereforeσint=2.4 min.
Usingσintof the period spike from G¨ansicke et al. (2009) as the
dispersion of systems around the period minimum, PHL 1445 and SDSS 1433 turn out to be 2.3σ and 1.5σ outliers, respectively.
In the sample of short-period eclipsing CV systems in Savoury et al. (2011), four systems have periods between 80 and 86 min, making them period spike systems according to G¨ansicke et al. (2009). Assuming that PHL 1445 and SDSS 1433 are also systems near the period minimum brings the total to 6. We must also assume here that no selection biases were involved with Savoury et al. (2011) choosing systems for model fitting. If CVs are distributed around a period minimum of 81.8 min, with an intrinsic scatter of 2.4 min, then the chances of finding these two outlying systems in such a small sample are approximately 6 per cent. This confirms the seemingly unlikely occurrence of finding two period minimum systems with periods as short as SDSS 1433 and PHL 1445, if the existing estimates for the position of the period minimum andσint
are correct.
It may be that the intrinsic scatter around the period minimum is underestimated, or that the position of the period minimum is incorrect. Being able to join the three substellar donor systems, PHL 1445, SDSS 1433 and SDSS 1035 with a single evolutionary track in Fig.9would provide evidence for the latter of these two possibilities, as this would suggest that all three are period minimum systems that are of similar nature but just at different evolutionary stages. This would involve tweaking the parameters of the evolutionary model (e.g. angular momentum loss) and is beyond the scope of this paper, but the results would be of interest.
5 C O N C L U S I O N S
We have presented high-speed, three-colour photometry of the short-period eclipsing dwarf nova PHL 1445. Four eclipses were averaged to overcome the presence of flickering, making bright
spot features visible and therefore enabling the determination of system parameters through eclipse model fitting. These system pa-rameters include mass ratioq=0.087±0.006, orbital inclination i=85◦.2±0◦.9, primary massMw=0.73±0.03 Mand donor
massMd=0.064±0.005 M, amongst others. The white dwarf
temperatureTw=13200±700 K and photometric distance to the
systemd=220±50 pc were also found through multicolour white dwarf flux fitting to model-atmosphere predictions.
We considered a number of possible reasons for PHL 1445 hav-ing an orbital period below the period minimum and determined their plausibility. PHL 1445’s small proper motion does not make Galactic halo membership likely. Analysis of the donor’sr-band flux was used to rule out a significantly evolved donor, but one that is only slightly evolved (Xc=0.1) remains a possibility. Formation
with a brown dwarf donor cannot be ruled out, although the brown dwarf would have to be older than 600 Myr at the start of mass transfer, which requires a progenitor system with an extremely low mass ratio ofq=0.025. Both PHL 1445 and SDSS 1433 – another CV with a substellar donor – lie below the period minimum for CVs, and their frequency may be evidence for error in the estimates for the intrinsic scatter and/or position of the period minimum.
AC K N OW L E D G E M E N T S
MJM acknowledges the support of a UK Science and Technology Facilities Council (STFC) funded PhD. SPL, VSD andULTRACAM
are supported by STFC grant ST/J001589/1. TRM and EB are sup-ported by STFC grant ST/L000733/1. SGP acknowledges financial support from FONDECYT in the form of grant number 3140585. The results presented in this paper are based on observations made with the William Herschel Telescope operated on the island of La Palma by the Isaac Newton Group in the Spanish Observato-rio del Roque de Los Muchachos of the Instituto de Astrof´ısica de Canarias. This research has made use of NASA’s Astrophysics Data System Bibliographic Services.
R E F E R E N C E S
Allard F., Homeier D., Freytag B., 2011, in Johns-Krull C., Browning M. K., West A. A., eds, ASP Conf. Ser. Vol. 448, 16th Cambridge Workshop on Cool Stars, Stellar Systems, and the Sun. Astron. Soc. Pac., San Francisco, p. 91
Aller K. M. et al., 2013, ApJ, 773, 63
Baraffe I., Chabrier G., Allard F., Hauschildt P. H., 1998, A&A, 337, 403 Bell C. P. M., Rees J. M., Naylor T., Mayne N. J., Jeffries R. D., Mamajek
E. E., Rowe J., 2014, MNRAS, 445, 3496 Berger J., Fringant A.-M., 1984, A&AS, 58, 565
Bergeron P., Wesemael F., Beauchamp A., 1995, PASP, 107, 1047 Boyajian T. S., van Belle G., von Braun K., 2014, AJ, 147, 47 Copperwheat C. M. et al., 2012, MNRAS, 421, 149 Dhillon V. S. et al., 2007, MNRAS, 378, 825 Duchˆene G., Kraus A., 2013, ARA&A, 51, 269 Duquennoy A., Mayor M., 1991, A&A, 248, 485
Feline W. J., Dhillon V. S., Marsh T. R., Stevenson M. J., Watson C. A., Brinkworth C. S., 2004, MNRAS, 347, 1173
Fukugita M., Yasuda N., Doi M., Gunn J. E., York D. G., 2011, AJ, 141, 47 G¨ansicke B. T. et al., 2009, MNRAS, 397, 2170
Gianninas A., Strickland B. D., Kilic M., Bergeron P., 2013, ApJ, 766, 3 Girardi L., Bressan A., Bertelli G., Chiosi C., 2000, A&AS, 141, 371 Grether D., Lineweaver C. H., 2006, ApJ, 640, 1051
Haro G., Luyten W. J., 1962, Bol. Obs. Tonantzintla Tacubaya, 3, 37 Hayashi C., Nakano T., 1963, Prog. Theor. Phys., 30, 460
Hellier C., 2001, Cataclysmic Variable Stars: How and Why they Vary. Springer-Praxis, New York
at University of Warwick on October 24, 2016
http://mnras.oxfordjournals.org/
Kepler S. O., Kleinman S. J., Nitta A., Koester D., Castanheira B. G., Giovannini O., Costa A. F. M., Althaus L., 2007, MNRAS, 375, 1315 Knigge C., 2006, MNRAS, 373, 484
Knigge C., Baraffe I., Patterson J., 2011, ApJS, 194, 28 Kolb U., Baraffe I., 1999, MNRAS, 309, 1034
Kouwenhoven M. B. N., Brown A. G. A., Zinnecker H., Kaper L., Portegies Zwart S. F., 2005, A&A, 430, 137
Kumar S. S., 1963, ApJ, 137, 1121
Littlefair S. P., Dhillon V. S., Marsh T. R., G¨ansicke B. T., Baraffe I., Watson C. A., 2007, MNRAS, 381, 827
Littlefair S. P., Dhillon V. S., Marsh T. R., G¨ansicke B. T., Southworth J., Baraffe I., Watson C. A., Copperwheat C., 2008, MNRAS, 388, 1582 Marcy G. W., Butler R. P., 2000, PASP, 112, 137
Patterson J., Thorstensen J. R., Knigge C., 2008, PASP, 120, 510
Podsiadlowski P., Han Z., Rappaport S., 2003, MNRAS, 340,
1214
Politano M., 2004, ApJ, 604, 817
Press W. H., Teukolsky S. A., Vetterling W. T., Flannery B. P., 2007, Nu-merical Recipes: The Art of Scientific Computing, 3rd edn. Cambridge Univ. Press, New York
Renvoiz´e V., Baraffe I., Kolb U., Ritter H., 2002, A&A, 389, 485 Roeser S., Demleitner M., Schilbach E., 2010, AJ, 139, 2440
Savoury C. D. J. et al., 2011, MNRAS, 415, 2025
Savoury C. D. J., Littlefair S. P., Marsh T. R., Dhillon V. S., Parsons S. G., Copperwheat C. M., Steeghs D., 2012, MNRAS, 422, 469
Smith J. A. et al., 2002, AJ, 123, 2121
Spark M. K., O’Donoghue D., 2015, MNRAS, 449, 175
Thorstensen J. R., Fenton W. H., Patterson J., Kemp J., Halpern J., Baraffe I., 2002, PASP, 114, 1117
Tulloch S. M., Rodr´ıguez-Gil P., Dhillon V. S., 2009, MNRAS, 397, L82 Uthas H., Knigge C., Long K. S., Patterson J., Thorstensen J., 2011,
MNRAS, 414, L85
Wils P., 2009, Inf. Bull. Var. Stars, 5916, 1
Wils P., Krajci T., Hambsch F.-J., Muyllaert E., 2011, Inf. Bull. Var. Stars, 5982, 1
Wood M. A., 1995, in Koester D., Werner K., eds, Lecture Notes in Physics, Vol. 443, White Dwarfs. Springer-Verlag, Berlin, p. 41
Wood J., Horne K., Berriman G., Wade R., O’Donoghue D., Warner B., 1986, MNRAS, 219, 629
Zorotovic M., Schreiber M. R., G¨ansicke B. T., 2011, A&A, 536, A42
This paper has been typeset from a TEX/LATEX file prepared by the author.
at University of Warwick on October 24, 2016
http://mnras.oxfordjournals.org/