Granular compaction
Bachelor thesis
Mike Rolink
Benjamin van Elburg
Universiteit Twente
Enschede, the Netherlands
February – July 2014
Physics of Fluids
Supervisors
Rianne de Jong
Devaraj van der Meer
Summary
The goal of this research was to look at the behavior of a loosely-packed granular material after an impulse was delivered. To accomplish this, a container was filled with sand and a metal ball was mounted, such that it could tap to the side of the container. After fluidizing the sand, taps were delivered, and the sand bed collapsed slightly. How much it collapsed was measured with a camera. These measurements run up to 233 taps, and it became clear that in this regime the largest collapse occurs in the beginning. After these taps, the bed height hasn’t reached a stable height. To verify if the relaxation time of the sand is lower than the time between the applied taps, the experiment is performed with both one and ten seconds between the taps. A clear difference between the measurements couldn’t be found.
The interesting parameter in this experiment is the release distance of the ball. Therefore, five different release points are chosen, and the measurements were repeated. From this release distance the impulse was calculated, because this is the relevant physical quantity. This was done by analyzing the velocity of the ball with a high-speed camera, before and after impacting the container. A higher impulse caused a larger collapse of the bed, which is not surprising. Moreover, the collapse scales linearly with the applied impulse for the first taps. For the first 34 taps the height versus tap curves can be collapsed by dividing the height change by the impulse. Collapsing the different curves onto a single master curve yielded a height dependence upon the amount of taps times the impulse to the power 3.3.
3
Table of contents
Title
Summary
Table of contents
1.
Introduction
4
2.
Theoretical aspects
5
3.
Experimental aspects
7
4.
Results
12
5.
Conclusion
17
6.
Discussion
18
7.
References
20
4
1. Introduction
Granular materials are everywhere. It is the second most processed material after water in industry. They play an important role in mining, agriculture, civil engineering and pharmaceutical manufacturing. Also in geological phenomena granular material plays its part, for example in landslides or erosion.
A granular material is a collection of solid macroscopic particles. The individual grains must be large enough so they are not subject to thermal fluctuation; their minimal size is limited to about one µm. Examples of granular materials are sand, coal, cornflakes, nuts and ball bearings. Depending on the average energy per particle, a granular material can act like a solid, a liquid or a gas. When the average energy is low, the grains are stationary relative to each other and behave like a solid, when the energy is high, the contact between individual grains become infrequent, the material behaves more like a fluid.
This research focuses on the compaction behavior of very loose sand. The sand is fluidized by blowing dry air through the sand, converting it from a static solid-like state to a dynamic fluid-like state. By slowly turning off the airflow, the sand will settle in its least dense stable state.
Papers on this subject [1,2] focused on the density change as result of a single compaction tap or multiple shakes. The experiment with a single tap was conducted at different ambient air pressures to study the effect of the interstitial air. The multiple shake experiment was carried out under vacuum and focused on the compaction behavior after many taps and for different shaking strengths. It was found that a stronger shock compactifies the material more than weaker shocks. Increasing the ambient air pressure causes a small increase in compaction and this compaction decreases with the amount of taps in a complex manner depending on the shake strength eventually leading to a steady state.
This thesis is about the effect of multiple taps on the compaction of an initially loosely packed sand bed at various ambient pressures and impact strengths. Sand in a transparent container is fluidized and then the height of the sand bed is measured after each tap. The compaction is a function of the height.
5
2. Theoretical aspects
Granular matter behaves differently than regular liquids, gases and solids, therefore it is a very interesting material to investigate. Experiments concerning a granular collapse with a single tap have been done before, and it turned out that the presence of air amplified the compaction process [1]. However, experiments with multiple taps are rare, a comparable experiment was done by Knight et al, which consisted of a granular shaker. The behavior of the granular material turned out to be complex [2]. The packing fraction changed approximately linearly as function of the logarithm of the amount of shakes. For low shaking strength this linear curve continues throughout 10,000 shakes. For high shaking strengths this behavior would continue about 200 shakes, which after the change would level off. The highest shaking strengths did not show this saturation phenomenon, there the shake strength was strong enough to move the sand grains to a very dense configuration, unattainable by the lower shaking strengths.
The role of the interstitial air has a significant importance on dynamics of the granular material, however, how this influences the compaction of the material is only partially understood. Interesting experiments involving the role of interstitial air are the Faraday heaping experiment [3], where heaping isn’t observed at low pressures, and the granular jet formation, in which an object falls on a pre-fluidized granular material and shoots a jet upward [4].
Packing fraction
In this research, where the side of the container will be tapped at, the dimensionless packing fraction ( ) is the system parameter of interest. It is assumed that is constant as a function of the height of the container. The packing fraction is defined as the total volume of the sand grains divided by volume occupied by the sand in the container. The sand inside the container is a polydisperse granular material, with grains between 20 and 60 micrometer in size, and a eccentricity between 0.2 and 0.6 [1]. The density of these grains is 2.21 ± 0.04 g/cm3 [4]. The packing fraction of this sand, when it is put into the container, is about 0.46. The volume of the sand is given by , the mass of the sand m (g) divided by the given density (g/cm3). The volume of the container is simply
where A (cm2) is the surface area of the container and h (cm) the height of the sand bed. Therefore, for every height of the sand bed, the packing fraction can be calculated. The formula for packing fraction therefore becomes:
(1)
Because of this fact that the packing fraction is dimensionless, it is not necessary to use SI units. It is assumed that the packing fraction is constant in the whole container. This phenomenon is explained by Janssen’s Law, which states that the pressure in a narrow column filled with granular material approaches a constant [5].
Impulse
To quantify the impact on the container the impulse is calculated. Impulse, or momentum exchange, is defined as the force integrated to time, so . Newton’s force law says that , this gives . Mass is of course independent of time, and the acceleration integrated gives a velocity, so
6 In this case, it is necessary to use SI units, m (kg) is the mass of the steel ball, v1 (m/s) is the absolute speed just before impact, v2 (m/s) is the absolute speed just after impact. J is the impulse, the unit of measurement is therefore , which reduces to N*s.
Because only the velocity should be measured to obtain the impulse, it is possible to determine this impulse with a high-speed camera. This is done by analyzing the speed of the ball right before and after the impact with the container.
Expectations
It’s anticipated that the height or packing faction graph depending on taps for different impulse can be collapsed onto one curve. The height profile might depend on the total impulse transferred; the amount of taps times the impulse. Then the height is a function of taps times impulse, 10 taps of impulse 1, should produce an equal height difference as 5 taps of impulse 2.
7
3. Experimental aspects
The setup
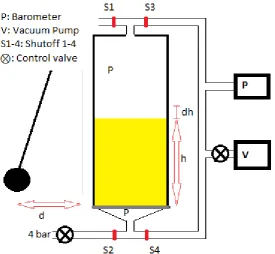
In all of the experiments, the same setup was used. This setup is shown in figure 1. It consists of a large perspex container, with a known amount of sand in it. Connected to both sides of the containers are pipes, which can be opened or closed with shutoffs. To vacuum the container, a vacuum pump is connected as well as a barometer. The valves control the airflow of the fluidization and rate of vacuumizing. As impacting object, a steel ball with a diameter of 5.08 cm and mass of 521.52 g is connected to a wire, making it a nearly ideal pendulum. The wire is suspended to a steel construction and the container is unable to move as well, so the distance between the container and the vertical line below the rotation point stays constant. The ball is released at a constant distance from the container, the distance is kept constant by a metal bar placed at the desired distance from the container to make sure each tap delivers the same impulse.
Figure 1 Schematic view of the setup used in the experiments.
Pictures are taken with a Nikon D800E or the D300E camera, this camera was mounted on a large Manfrotto tripod. On the other side of the container, a Hella flood light was mounted on a smaller tripod, also a Manfrotto. A Carl Zeiss-lens was used to take the pictures.
[image:7.595.74.350.269.523.2]8
Fluidization process
The filling process starts with measuring the mass of a partially filled bottle with a very accurate balance (0.01 g error). After that, the bottle is emptied in the container and then measured again. The difference between the first and the second measurement equals the amount of sand added to the container. The mass of the bottle is measured and subtracted from the filled bottle after it is emptied to account for any sand left in the bottle. This process is repeated until the 40 cm mark is reached. The total amount of sand is the sum of the individual fill processes. After ten repetitions the 40 cm mark is reached, the total mass of the sand was 8038.65 gram. Sometimes a little bit of dust leaves the bottle, so there might be a small error of approximately 0.05 gram every time. Adding a maximum 0.01 gram error from the balance scale and multiplying by 10, because this process was repeated ten times, gives a possible error in the mass of 0.60 gram, which is negligible. Because of the fact that there might have been at highest one gram of sand in the container before the filling process started, the possible error becomes 1.60 gram. Calculating the packing fraction for this quantity gives 0.443.
Now that the desired amount of sand is put into the container, the fluidization process can start. Shutoffs 1 and 2 are opened, the other two remain closed. In this process, air is blown from below through the sand, which decompactifies the sand. When the sand reaches its highest level, the air supply is very slowly lowered until zero. At this moment, the bed height lowers, but it won’t reach the same compactified state it was in before the fluidization. The height the sand reaches is around 43.8 cm1, which is about ten percent higher than before fluidization. In this case the packing fraction is reduced to 0.405, just like Caballero et al. [4] measured.
Optimizing the experiment
Previous experimenters using this container filled half the container. Therefore it’s a possibility to look at the behavior of the sand when there is more sand inside the container, this might give a smaller error compared to the height differences measured. After fluidization, the sand level reaches about 43.8 cm. Every time, there will be sand poured into the container, just enough to increase the bed height by four cm after fluidization. According to formula (1), this amount should be precisely 734.28 gram. After six repetitions, the mass of the sand was 12444 ± 2 gram. For the seven different masses, the bed height was determined three times after fluidization, and the packing fraction calculated. This packing fraction turned out to be almost independent of the bed height (figure 2), hence the next experiments are all done with this amount of sand in the container. In the figure, the average height is shown as a point, the vertical error bars represent the standard deviation. The horizontal error bar is the small possible error in the mass of the sand which is very small compared to the total mass in the container. Assuming that a higher bed level results in bigger height differences when the container is tapped by the ball, the experiments can be done more precisely.
9 Figure 2 The packing fraction plotted as a function of the total mass of the sand inside the container.
Measuring and analyzing the heights
With this higher sand level, the experiments are started with the steel ball tapping to the container. The ball is tapped to the side of the container, close to the bottom, transferring an impulse to the container. This causes a collapse of the sand bed in the order of millimeters. In this process, all the shutoffs should be closed. After the fluidization process, the bed reached a height of around 67.4 cm. With the camera, a picture is taken and after the first tap, two pictures are taken. This is repeated five times, from that point an increasing number of taps are given before taking pictures. In these height measurements, there are thirteen heights measured for taps spaced between 1 and 233. With these values of the taps, with more values in the beginning, the full range can be looked at.
To get the bed height and packing fraction as a function of taps, the pictures made with the camera are analyzed, and the first picture before the first tap is used to get the initial height using a tape measure. The tape measure is placed next to the container and included on the photographs. Using the highest and lowest visible bars on the tape a Matlab program calculates the pixel to cm ratio and the sand bed height. For the next height the program compares the bed height difference with the previous picture, after several taps the sand bed has decreased beyond the focus of the camera, therefore two pictures are taken between each tap, such that the second picture can be the new base line when the camera has been lowered after the first picture. The program of course make a small error in determining the height of the sand bed. This error is at most 0.02 cm.
System parameters
The measurement procedure is the same for all measurements varying two system parameters, the release distance of the ball and the air pressure in the container. In total, five different distances are measured, for all distances there are at least three series of measurements. These results will give a clear view of the dependence of release distance, which scales with impulse, on the bed height after a certain number of taps.
10 minutes and 10 seconds. To keep the pressure as constant as possible, the amount of taps is limited to 89. The sand bed might collapse during the vacuumization process, therefore pictures are made before and after lowering the pressure to spot this undesirable phenomenon. The bed might collapse a bit while the pressure is being lowered, to spot this undesirable phenomenon, a picture is made before and after the lowering of the pressure. In the case of a collapse during the vacuum process the whole measurement is cast away and repeated. Again, for each pressure there are three series, and the same number of taps (89) will be used for all pressures.
There is a time constraint in the low-pressure experiments. Because of the pressure rise due to leakage, the measurements should be done as fast as possible. However, the sand has a certain relaxation time, hence tapping too fast might result in false measurements, because the system might still be in an unstable state. In the experiments described, the time between the taps was about two seconds which varied strongly depending on the tap number (not after every tap a photograph was taken). Homan et al. [1] stated that after tapping the bed needs about 30 ms to reach its new height.
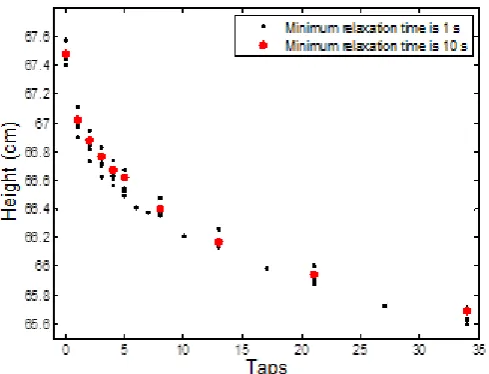
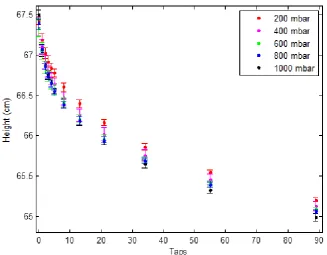
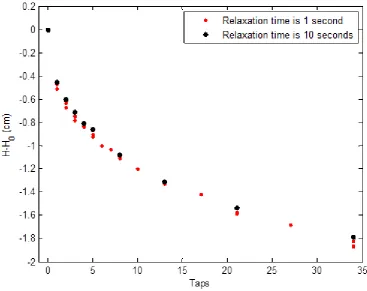
Because of this, it is not expected that two seconds between taps gives different results than ten seconds between the taps. To test if this relaxation time suffices, a new measurement at 1000 mbar has been done. The time between the taps is ten seconds, and will be compared with the normal measurements, where the relaxation time is at least one second. The results can be seen in figure 3.
Figure 3 Height of the sand bed for different relaxation times, the black dots above each other represent different measurements (d=30cm, J= 0.61 Ns).
The larger red data points correspond to the high relaxation time. The relaxation time of the normal measurements (black dots) is not continuous throughout the measurement. For the first five taps the relaxation time is long (about three seconds) because at each tap the height of the bed is measured. For higher number of taps the relaxation time is shorter (just over one second), because there aren’t pictures made between every tap. It’s clear from the figure that the longer relaxation time follow the same curve as the shorter relaxation time. Therefore the assumption that the time between taps is unrelated to the height and packing fraction holds. This means that the container can be tapped safely every second. Now, the measurements for different impulses and ambient pressures can begin.
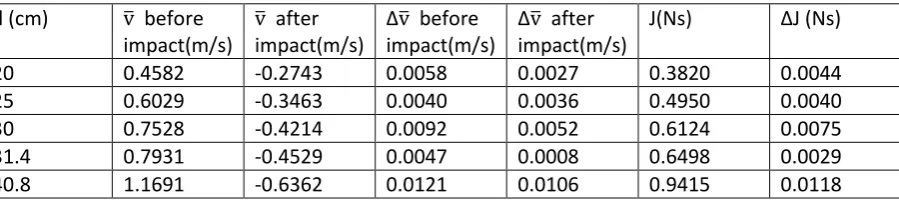
[image:10.595.72.317.342.529.2]11 Therefore, the speed of the ball before and after impact are determined, using a Photron SA-x Fastcam high-speed camera. With the camera, it’s possible to see very accurately at which time the ball touches the perspex, and at what velocity it arrives and leaves. Analyzing the frames just before and after the impact provides the velocities necessary to calculate the impulse. Using Matlab to translate the pixel velocity to real velocity, the impulse can be determined using formula (2).This is done for all the five distances. The averaged results can be seen in table 1. The errors in the velocities are the standard deviation calculated from the individual measurements. The ‘Algemene Practicumhandleiding’ [6]is used to calculate the possible error in impulse.
d (cm) ̅ before impact(m/s)
̅ after impact(m/s)
Δ ̅ before impact(m/s)
Δ ̅ after impact(m/s)
J(Ns) ΔJ (Ns)
[image:11.595.75.525.190.290.2]12
4. Results
Measurements
In the first experiments the impulse is varied and the height is measured. Several release distances are used, so the effect of variation in impulse can be shown. The results for different impacts on the container are shown in figure 4.
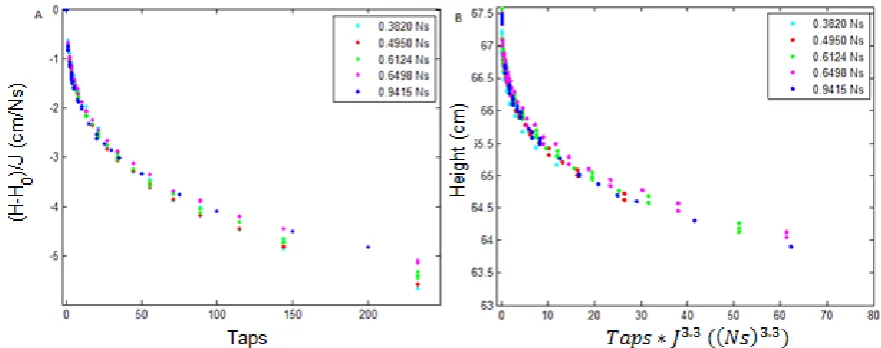
Figure 4 A) Height of the sand bed for different impulses. B) The corresponding packing fraction.
The height of the bed is almost the same after each fluidization, however, after the first tap the sand bed collapses more for a higher impulse which discriminates the curves. Therefore the high impulse taps result in a lower bed height. The corresponding increase in packing fraction is shown in figure 4b.
Analysis
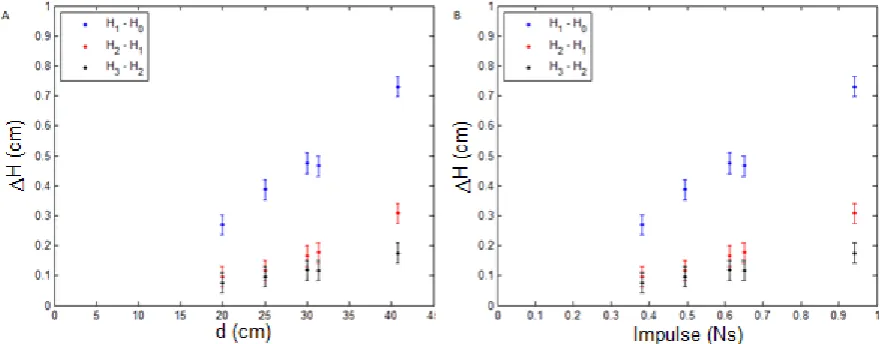
To compare the effect of one tap with Homan et al. [1], the height differences caused by one tap for several release distances are plotted in figure 5. In addition the height difference between the next two taps is also plotted. The general shape of the blue curve agrees with Homan et al, the height difference increases linearly with impulse.
[image:12.595.80.518.162.339.2] [image:12.595.74.517.505.677.2]13 The plots in figure 5 for the next tap suggest that the bed height change remains linear with the release distance, even after several taps. This supposition can be checked by collapsing the values of figure 4a onto one graph by dividing the height difference by the release distance.
Figure 5b plots the height difference as function of the impulse. The figures are almost identical, since d is linear with the velocity in the regime where the rope length is much larger than the release distance.
To collapse the profile in figure 4 onto one curve all the bed heights before the first tap are subtracted and then the curves are divided by their corresponding impulse. The result is figure 6a.
Figure 6 A) The height profiles divided by their corresponding impulse. The curves collapse for small tap amounts, however, for more taps the points disperse with the higher impulse at the lower height. B) Here the height is plotted as a function of taps times the impulse to the power 3.3.
From figure 6a it’s clear the curves do collapse for less than 30 taps, however for many taps the curves disperse. In the end of the graph, above 100 taps, the higher impulse measurements are lying above the lower impulse. At 233 taps the collapsed heights are clearly ranked from the lowest point to the highest by increasing impulse. The high impact compactifies the sand more than the lower impact, therefore the sand reaches its highest possible packing fraction faster with higher impulse impacts. Possibly the linear relation between impact and height difference breaks down, when the sand is at a different packing fraction. This relation might not be valid anymore after many taps, but maybe it still holds when the sand bed is at an equal height after a different amount of taps. This makes sense since the initial height difference after one tap is described by the linear relation with impulse, however for each next tap the height difference (and packing fraction difference) gives a different slope of the ΔH/J curve. So for many taps, when all the little height differences have accumulated, the curves do not collapse linearly with impulse since their initial condition is different.
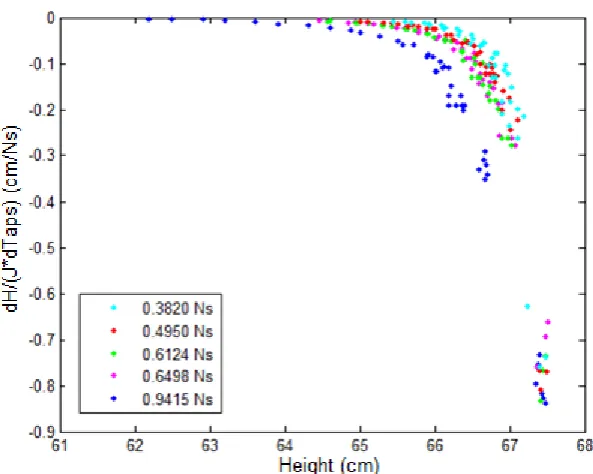
14 Figure 7 The sand bed height change divided by impulse.
However, the points at a lower height do not group together. The low impulse impacts are always lying above the high impulse impacts. The linear relationship between height change and impulse breaks down. Comparing the results with figure 6a, the linear relationship looks just as valid or even better for the same tap number instead of the same height.
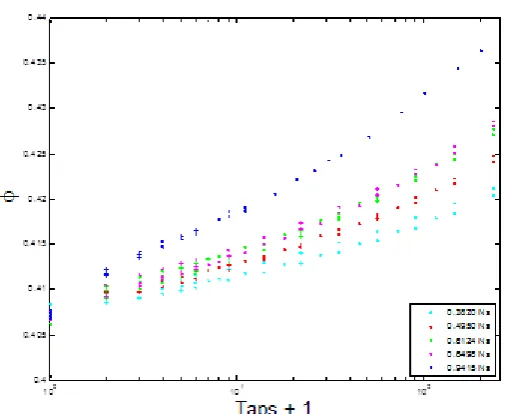
[image:14.595.85.382.74.311.2]15 Figure 8 Packing fraction plotting as a function of the logarithm of the taps, the tap number has been offset by one to include the origin in the plot.
This plot shows the same behavior as in the paper. The paper specifies different regimes depending on the shake strength, the results obtained by tapping are very similar to the low strength regime. The system is relaxing towards a steady state but will reach it after a very long time. In the paper this behavior goes on for at least 10,000 shakes, in these measurements the final state is nowhere near this value. The packing fraction continues to increase approximately the same for each order of taps at these values of the impulse.
Role of air
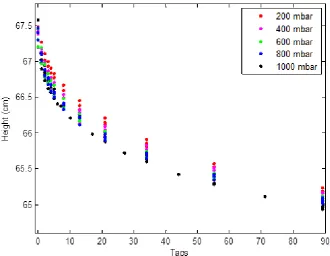
Figure 92 shows the height versus taps for different ambient pressures. The lower pressures end up with a higher sand bed after the same number of taps. At zero taps the sand bed is fluidized and the height difference is a result of that process, after tapping the role of the interstitial air comes into play and the dots untangle more and more after each tap. The difference in height after 89 taps is small but it is clear that the final height has increased for lower pressure and vice versa. This corresponds to the results of Homan et al. for the first tap, where it was stated that the height difference between the fluidization height and the height after the first tap increases slightly when the air pressure gets higher [1]. For the first few taps, this phenomenon is clearly visible, just like Homan et al. showed. The reason for this might be that air works as a lubrication layer. At lower packing fractions this layer reduces the friction, but at higher packing fractions the effect is almost gone.
2
[image:15.595.84.337.79.286.2]16 Figure 9 Height of the sand bed for different ambient pressures, the dots are the average three measurements, the error bar the corresponding standard deviation.
[image:16.595.77.405.70.325.2]After about eight taps, the color pattern stays almost the same with increasing taps, showing that the pressure in the sand becomes irrelevant for the height difference after each tap. This might be because the packing fraction is too high; the individual sand grains have more contact points with other sand grains. Therefore the role of interstitial air is negligible in this regime, and the impulse is the only parameter effecting the height change. This effect can be seen in figure 10, where height difference between the taps is shown, as a function of pressure. It becomes clear that after eight taps the pressure does not longer influence the drop of the sand bed. The plot excludes the height difference for more than ten taps since they are close to zero and all at the same value.
Figure 10 Height difference between taps, it’s the height difference between tap(n) and tap(n+1) divided by the tap difference where n is the measurement number; so for the point at 8 it’s the height difference between tap 13 and 8 divided by 5.
[image:16.595.77.300.483.654.2]17
5. Conclusion
The response of a sand bed during multiple compaction events has been studied. A stronger shock compactifies the sand more, a linear relation between height difference and the impulse of the shock is found. This linear relation is most valid for the first ten impacts. A possible reason this relation fails to describe the system after multiple taps is the height difference resulting from the taps. After ten high impulse taps the system is in a more dense state than after ten low impulse impacts. However, looking at the height difference divided by the impulse as a function of number of taps (figure 6a), showed that even for the second tap the height difference is linear with impulse. This result is surprising since the system is better described by a linear function between height difference and impulse for each tap rather than height of the sand bed. A more sensible physical model to describe the system is looking at the total impulse transferred to the system, however this doesn’t yield one curve for the height as function of impulse. Surprisingly the height of the system is a function of taps times impulse to the power 3.3 (figure 6b).
18
6. Discussion
Comparison
Homan et al. [1] showed that the drop of the sand bed increases linearly with increasing release distance. This result has been reproduced and confirmed in this report, in fact, this relation holds for the first few taps, whereas Homan et al. only looked at the first tap. The fact that the relation remains valid is counterintuitive since the grains have a different packing fraction after the first tap. In the multiple tap experiments, the results are more interesting. Because it seems that this experiment hasn’t been done, or at least not reported before, the reference material is rare. A different, but in some way similar experiment has been done by Knight et al. [2]. Instead of tapping to a container, the shock was delivered by shaking the container at high frequencies, providingsome reference material. Because of the high frequencies the long term behavior can be seen, where the manual taps and analog measurements used in this experiment made tapping over 200 times impractical.
Knight et al. finds a relation between number of taps and packing fraction which is modeled with two exponentials and several parameters, and in their graphs a straight line can be seen in the semi-logarithmic plot. However, they show that after about 200 taps at high shaking strength, the behavior of the sand changes, and the sand collapses less than at the first 200 taps. This behavior is not observed, most likely the taps applied correspond with their low shaking strength, in that case, the results obtained match Knights’.
Effect of impulse on the container
In the analysis of the height as function of impulse it’s assumed the packing fraction is homogeneous in the entire container even after an impact. The impact is causing a shock which travels through the whole container and makes it collapse. Hence the packing fraction remains independent of the place in the container after a shock. However, it is possible that the impact and resulting shock on the container have a local instead of a global effect on the sand. Not all the sand in the container has to be compacted by the same amount. For the same impulse, different air pressures, breaking this assumption would not be terrible for the result. The packing fraction would not be homogeneous but each region would be affected by the same amount. However, if the compaction did depend on the distance and magnitude of the shock, the assumption that the packing fraction is homogeneous would give false results for different impulses since a larger shock could affect more of the container. Measuring the packing fraction inside the container on several location will validate the assumption.
Effect of interstitial air
In the pressure measurements, again Homan et al. [1] provided most of the background information. But again, their results are limited to one tap. They stated that the bed drop is smaller at lower pressures. This is indeed the case when only one tap is applied. For the next tap however, this effect is smaller, after eight taps the effect is negligible. The packing fraction becomes relatively low, and from this point on the pressure inside the sand does not longer influence the drop of the sand bed. These experiments have been done with up to 89 taps, the height drop is identical, and the air is irrelevant in this regime. Most likely the height difference, caused by the air, behaves like an offset in the amount of taps applied. When the influence of the ambient air is nullified, the shape of the curves for different ambient air pressure are the same. To fully justify this ‘tap shift’, the amount of taps need to be increased until a maximum compaction is reached. If the air has no influence the curves would reach the same packing fraction. If this is the case, the air has no influence on the collapse and all the curves after eight taps could be superimposed on each other by a small horizontal shift depending on the pressure.
19 minimum packing fraction. This would suggest that the effect of air is important for one to infinitely many taps. This is unlikely since intuitively the role of air becomes less for higher compaction. Measuring more taps, to see if the curves do go to a same minimum height would prove the ‘tap shift’ theory.
Improvements
In the setup, there are a few things that could have improved the measurements. The release mechanism of the ball was labor intensive, this proved to be a problem when it became clear that a minimal height could not be reached within several taps. The system needs well over 200 taps to reach a maximum compact state, possibly in the thousands.
The Matlab program used to analyze the height was sufficient to calculate the heights out of the photos of the bed but unfit to produce fast measurements. Reading the height directly from the photos that was mounted to the container might have been as efficient. However, this would increase the error in the height to 0.03 cm approximately, whereas the Matlab program has an estimated error of 0.02 cm.
The biggest improvement can be made by electronically measuring the packing fraction inside the container instead of the height. This would result in fast measurements with only relative data, while pictures are inefficient in storing one number of interest.
In the pressure measurement, it was observed that after measuring, the pressure was significantly higher than after turning off the vacuum pump. The increase in pressure in three minutes turned out to be 47 mbar, when the initial pressure was 100 mbar. After using duct tape to close a small hole that was found at the side of the container, this loss dropped to 31 mbar. Of course, there will always be a small pressure drop, but in an ideal setup this would have been smaller. With better tubes, this pressure increase might have been reduced. Improvements in maintaining a constant pressure would result in more taps since the pressure change is limiting the time, and therefore taps, to do measurements at low pressure. These measurements are vital to validate the ‘tap shift’ explanation.
Moreover, without the expensive equipment, like the high-speed camera, the results would have greater errors. The measurement of the impulse for example, has been done quite accurately, thanks to this device.
Finally, the parameters chosen were not ideal at the start. Time was lost measuring taps 1 to 30, while a bigger range of taps proved to give more information. The release distance wasn’t measured before but after the measurement. This gave an unimportant release distance; 31.4 cm. Later 30 cm was chosen as one of the release distances, but the two distances so close to each other gave little new information. In the graphs these points are lying very close to each other, and when error bars are added it gets even harder to distinguish them.
Suggestions
Further research to validate the conclusions in this report, should consider a bigger range of impulses, more taps and digital measurement of the packing fraction as function of taps. Also an air tight container would be vital for high tap, low pressure measurements.
20
7. References
[1] T. Homan, C. Gjaltema and D. van der Meer, Collapsing granular beds: The role of interstitial air, Phys. Rev. E 89, 052204 (2014)
[2] J. B. Knight, C. G. Fandrich, C.N. Lau, H. M. Jaeger and S. R. Nagel, Phys. Rev. E 51 (1995)
[3] M. Faraday, Philos. Trans. R. Soc. London 52, 299 (1831)
[4] G. Caballero, R. Bergmann, D. van der Meer, A. Prosperetti and D. Lohse, Role of Air in Granular Jet Formation, Phys. Rev. Lett. 99, 018001 (2007)
[5] H. A. Janssen, Z. Verein Deutsch. Ing. 39, 1045 (1895)
21
8. Appendix A
Attempt 1 2 3 4 5
Height M (cm) 43.71 43.77 43.80 43.75 43.85 Height B (cm) 43.62 43.71 43.70 43.72 43.79 Table 2 Fluidization height for each person.
Table 2 lists the first attempts to fluidize the sand. Practice makes perfect and the sand bed height increased until a maximum was reached, in all the other measurements the same person fluidized the bed.
[image:21.595.59.529.103.148.2]In the result section, it became clear that the relaxation time has no influence on the measurements. The absolute height as a function of number of taps was shown, both for a relaxation time of one and ten seconds. Because of the randomness in height after fluidization, this starting height was subtracted from all the measured heights. Therefore, the starting point is always of zero height, and the collapse of the sand bed will be better visible. This can be seen in figure 11.
Figure 11 The relative height of the bed as a function of taps, for different relaxation times.
[image:21.595.78.446.308.599.2]22 Figure 12 The relative height of the bed as a function of taps, for different impulses.
Indeed, the behavior of the sand in the first part of the measurements can be seen much better in this type of plot. Even after the first tap, there is a clear difference in the height drop, which strongly depends on the delivered impulse.
In the result section, there was also a height versus taps plot for different pressures. For every pressure, there were at least three measurements, but the average was shown in that plot. From the standard deviation of those values, an error bar was created. Figure 13 shows all the individual measurements, but in this plot it’s harder to see which values belong to each other. Moreover, the dot density is high in this plot, so it is hard to draw conclusions from this figure.
[image:22.595.75.406.479.735.2]23 To complete the story, the average relative height versus taps was plotted, for a few different pressures. Again, because the fluidization height is subtracted from the measured values, there is a better view of what happens in the beginning. It is obvious that the height drops faster in the beginning, which can be concluded with more certainty than without this relative plot. The results can be seen in figure 14.