IJSRR, 7(3) July – Sep., 2018 Page 1843
Research article Available online www.ijsrr.org
ISSN: 2279–0543
International Journal of Scientific Research and Reviews
Electrochemical Studies of Reactive Orange 12 on Glassy Carbon
Electrode
M. Revathi
1and N.Senthil Kumar
*1,21
Research Development Centre Chemistry, Part Time Research Scholar, Bharathiar University,
Coimbatore - 641046, Tamilnadu. India
2
Department of Chemistry, Arignar Anna Government Arts College, Cheyyar – 604407. Tiruvannamalai, Tamilnadu. India,
ABSTRACT
The cyclic voltammetric studies of reactive orange 12 (RO 12) was carried out in aqueous solution on glassy carbon electrode (GCE). The effect of pH on the electrochemical behaviour of reactive orange 12 was performed from pH 1.0 to 13.0 at scan rate 50 mV/s. The maximum peak current response was found in pH 4.0 others little bit less. At all pHs three anodic peaks in forward scan and two cathodic peak in the reverse scan were observed. The dye solution of RO 12 was exhibits oxidation and reduction peaks potentials at around -190, 030, 650 mV and –220, -6750 mV respectively vs Ag/AgCl The voltammogram of. A systematic study of the experimental parameters that affect the anodic differential pulse stripping voltammetric response was carried out. Maximum peak current conditions were arrived. Calibration curve was made under the maximum peak current conditions at different concentration RO 12. The concentration range studied for the determination of 300 to 700 ppb. The lower limit of detection is 200 ppb for GCE and the RSD 3.2%. The suitability of this method for the quantisation of dye in textile industries effluents was also ascertained.
KEY WORDS:
Cyclic voltammetry, Reactive Orange 12, Stripping voltammetry, Glassy Carbon Electrode*Corresponding author
Dr. N. Senthil kumar
Department of Chemistry,
Arignar Anna Government Arts College, Cheyyar–604407.
Tiruvannamalai, Tamilnadu. India,
IJSRR, 7(3) July – Sep., 2018 Page 1844
INTRODUCTION
The textile industry is one of the most polluting industries in terms of discharge volume and effluent composition1. Reactive dyes are extensively used in the textile industry due to the presence of reactive groups in their molecules, which bind to fibers through covalent bonds. The main problem associated with the use of reactive dyes is their low affinity for fabrics resulting in relatively high dye concentrations in textile wastewater2. Reactive dyes exhibit a wide range of different chemical structures, primarily based on substituted aromatic and heterocyclic groups. Since reactive dyes are highly soluble in water, their removal from wastewater is difficult by conventional treatment processes3, 4, 5. A moderate difference was discussed in our preliminary study of the morphology of graphite anode electrode before and after the electrochemical process6. In the electrochemical oxidation process anode reaction, the substrate oxidation involves the transfer of one or more electrons from the substrate to the anode—direct electron transfer (DET). However, substrate oxidation rarely occurs without simultaneous oxidation of water, especially under amperostatic conditions. This opens up the possibility that attack on the substrate is initiated by reactive intermediates of water oxidation, such as hydroxyl radicals, hydrogen peroxide, hydroperoxy radicals and their basic conjugates, either free in solution or bound to the anode surface7.
Ceria-based composites have been previously developed as functional electrolytes for high performance of solid oxide fuel cells that require high functional electrolyte materials that can provide high ion conductivity for sufficient current output. These composites display hybrid proton and oxygen ion conduction. We developed further composite electrolyte materials containing a catalyst such as rare earth elements; gadolinium (Gd3+), neodymium (Nd3+) and samarium (Sm3+) doped ceria (Ce0.8Gd0.2O2, Ce0.8Nd0.2O2 and Ce0.8Sm0.2O2) to investigate the electrochemical
treatment of C.I. Reactive Orange 1078. The discharge of dyes is a worldwide environmental problem. These dyes are widely applied in industries namely dyestuff, rubber, paper, leather, textiles,
plastics and cosmetics9, 10, 11. Reactive azo dyes are highly soluble in water and differ from all other
categories of dyes in which they bind to the textile fibers namely cotton, wool and silk to form
covalent bonds12.
The effect of pH on the adsorption of the reactive orange 12 dye by rice husk was
investigated at ambient temperature (25 ºC). pH is one of the most significant parameters controlling
the adsorption of dye by adsorbent particles, which changes both the surface charge of the adsorbents
and the degree of ionization of different adsorbates13. Huge amounts of synthetic dyes are used in
IJSRR, 7(3) July – Sep., 2018 Page 1845 estimated that approximately 10%–15% of total dyes utilized were lost during the dyeing processes
and released into wastewater14. More than 60% of dyestuffs manufactured around the world are azo
dyes15, which are recalcitrant, no biodegradable, carcinogenic, mutagenic, and toxic16. Wastewaters
that include azo dyes must be effectively treated to prevent possible harm to aquatic life, since they
may contain different pollutants such as dyestuff with various structures and textile auxiliary
materials such as surface active materials and polyvinyl alcohol utilized in sizing processes17. The
color removal efficiencies were 85% by ferrate (VI) method and 91% by sono-ferrate (VI) method.
Kinetic studies were also performed for the decolonization of RO 16 under the optimized conditions
at room temperature18. pH has the significant impact on absorption process and affected absorption
capacity, dye solubility19, solution chemistry, and a surface of absorbent pore20. The effect of pH on
the adsorption capability was investigated between pH 2.0 and 12 at 30°C and the shaking rate was
set at 150 rpm. The percentage removal of RO16 increased from 95% to 98.12% with an increase of
the pH from 2 to 821. The study was to develop electro-analytical strategies based on certain
voltammetric techniques for the sensitive determination of RO12 in aqueous solution on glassy
carbon electrode. Direct redox behavior of reactive orange 12 on GCE and as consequence, their
determination was investigated by cyclicvoltammetry (CV) and differential-pulsed voltammetry
(DPV) techniques-based procedures were tested, developed and optimized for selective and detection
of reactive orange 12.
EXPERIMENTAL METHODS
All reagents were of AR grade purchased commercially. The stock solution of reactive
orange 12 was prepared by dissolving the substances in double distilled water purified from SG
purification system. The supporting electrolyte (pHs) solutions were also prepared by same water.
The pH values of the buffer solutions were measured by Hanna HI 2211 pH/ORP meter.
The electrochemical studies were carried out in exploratory and determination mode on a
software connected CH Instruments Electrochemical Workstation (model CH 650C). The cell was
made of glass, having a capacity of 15 mL and the Teflon made cell top was comprised of three
separate holes for the insertion of electrodes viz. working electrode (Glassy Carbon), counter
electrode(platinum foil) and reference electrode (Saturated calomel) . The cell setup is kept in a CH
Instrument Picoamp Booster and Faraday cage. The cell top also has the purging and blanketing
facilities of nitrogen gas with separate tubes to remove oxygen gas. This setup enables to maintain an
inert atmosphere above the sample solution throughout the experiment.
The surface of the glassy carbon electrode is apt to be contaminated by surface-active
IJSRR, 7(3) July – Sep., 2018 Page 1846 changed. Hence, it is necessary to treat the electrode before use, if a good reproducibility is required.
Well-known and accepted procedures for the treatment of glassy carbon electrode were adopted.
First the electrode was washed with water-ethanol-ammonia mixture followed by ethanol-ammonia,
ethanol-acetic acid and ethyl acetate-ethanol mixture. It was then washed with distilled water and
trichloro ethylene. With this method, oxides and surface-active substances and organic compounds
were removed from the electrode surface. When electrode surface seriously contaminated, the most
effective and, at the same time the simplest way employed for the renewal of the surface was to
remove a layer of it by rubbing with 0.05 M of fine powder of -Al2O3. After rubbing, the electrode
was wiped with a filter paper and then rinsed with water. The fine particles of alumina adsorbed on
glassy carbon electrode were removed by ultrasonication in the presence of water. Then, the
electrode was thoroughly degreased with trichoroethylene and washed with deionized water and
acetone. Glassy carbon electrode (GCE) surface was well developed for determination of trace
amount of dye. The dye adsorbed on GCE is now a day’s very useful for determination of ultra trace
materials.
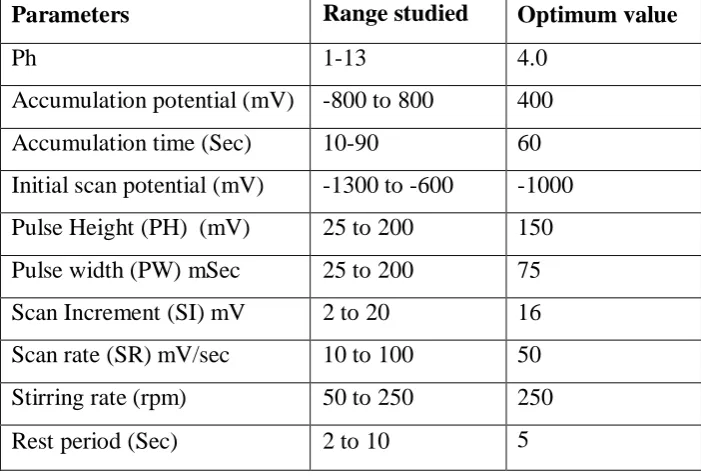
Table 1: Studied range and optimum experimental conditions in DPSV
Parameters Range studied Optimum value
Ph 1-13 4.0
Accumulation potential (mV) -800 to 800 400
Accumulation time (Sec) 10-90 60
Initial scan potential (mV) -1300 to -600 -1000
Pulse Height (PH) (mV) 25 to 200 150
Pulse width (PW) mSec 25 to 200 75
Scan Increment (SI) mV 2 to 20 16
Scan rate (SR) mV/sec 10 to 100 50
Stirring rate (rpm) 50 to 250 250
Rest period (Sec) 2 to 10 5
RESULTS AND DISCUSSION
Cyclic Voltammetric Behaviour
Cyclic voltammograms of RO 12 on GCE in acid, neutral and alkaline media, at different
scan rates from 25 to 500 mV/s were recorded. There was significant response when the studies were
IJSRR, 7(3) July – Sep., 2018 Page 1847 subtracted in the appropriate potential range. The peak potential Ep (in milli volts) and peak current
ip (in microamperes) for respective concentrations and scan rates were measured. The data are
obtained and discussed.
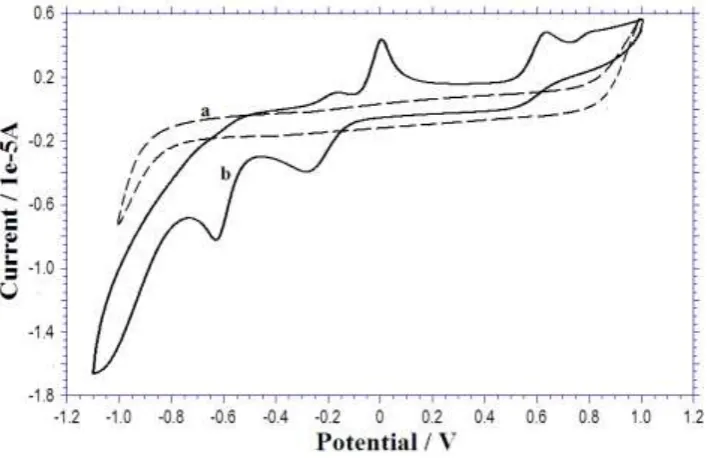
Figure 1, Cylic voltammetric behavior of 300 ppm concentration of RO 12 on GCE in pH 4.0 and at 50 mV/s
Effect of pH
Since there was characteristic effect from pH 1.0, the cyclic voltammetric studies of RO 12
were carried out in the pH range 1.0 to 13.0. At all pHs three anodic peaks and two cathodic peak
(Fig.1) in the reverse scan were observed. Of the three peaks, anodic peak III showed prominence
with higher current in the pH range 1.0 to 13.0. The anodic peak III and cathodic peak lost their
sharpness when the pH was increased. Hence the anodic peak III was considered for further studies
to probe the oxidation mechanism. For the study of influence of pH on the cyclic voltammetric
response, at pH 4 were chosen and the cyclic voltammograms were recorded for 300 ppm RO 12 at a
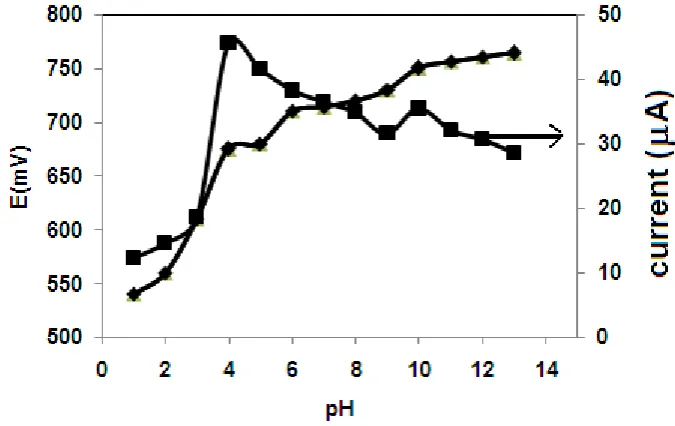
scan rate of 100 mV/s. The peak currents and peak potentials were plotted against pH and the plots
are given in figures 2. The peak current decreased with increase in pHs. The maximum peak current
response was found in pH 4.0. This is due to faster electron transfer at acid pH 4.0 and indicates that
the electrochemical oxidation of RO 12 is facilitated in acidic media. Hence it can be considered as
an optimum pH for the study of RO 12. The peak potential also decreased with increase in pHs. The
peak potential of anodic peak III shifted anodically with pH whereas that of cathodic peak shifted
IJSRR, 7(3) July – Sep., 2018 Page 1848
Figure 2, Effect of pH vs. peak current, potential curve on GCE
Effect of Scan Rate and Concentration
The scan rate was varied from 25 to 500 mV/s at the selected pH medium and the cyclic
voltammetric behaviour of 300 ppm RO 12 was understood. Peak current was correlated with scan
rate and square root of scan rate. The plot of log current versus log scan rate was also made. At
constant scan rate 100 mV/s, the concentration of the substrate was varied and the effect on peak
current was observed. The plot of current versus concentration of RO 12 was also made.
An aqueous solution of pH 4.0was chosen as the medium for the study. Fig.1 represents the cyclic
voltammogram of RO 12 recorded at pH 4.0. Three anodic peaks were observed at the potentials
around 190, 030, 650 mV. In the reverse scan two cathodic peak was observed around at –220 and
-6750 mV. The effect of scan rate was studied for the anodic peak I at a scan rate from 25 to 500
mV/s. The peak current was plotted against scan rate and resulted in a slightly curved line whereas
the peak current increased linearly with square root of scan rate and resulted in a straight line with
good correlation (R2 = 0.9902). The log ip vs. log plot yielded a straight line with slope 0.1002.
These facts revealed the nature of electrode reaction as diffusion controlled. The variation of peak potential with log scan rate resulted in a straight line (n = 0.8855). The potential difference between
the anodic peak I and the cathodic peak was found to be around 100 mV. Hence, it can be considered
that the oxidation of RO 12 at pH 4.0 may be considered as quasi reversible. The effect of
concentration on peak current at a constant scan rate 100 mV/s was carried out by changing the
concentration from 300 to 700 ppm. Increase in the concentration of RO 12 showed increase in the
IJSRR, 7(3) July – Sep., 2018 Page 1849 line. Hence, it may be concluded that at pH 4.0, irreversible diffusion controlled oxidation and
reduction reactions are taking place apart from another oxidation at higher anodic potential.
Chronocoulometry
Diffusion coefficient is required for most electrochemical studies since the current response
at an electrode depends on the rate of mass transport of the electroactive species to the electrode
surface. The diffusion coefficient value of the compound was calculated from the slope of Anson’s
plot, if other parameters are known. In this case, the geometric area of the glassy carbon electrode
used is 0.0314cm2. A plot of total charge passed, Q vs. square root of time, t½ transforms the data
into a linear relationship whose slope is 2nFACD½ -½. The plot of Q vs. t½ for 1.6x10⁻⁷ M/cm3
concentration of RO 12 is obtained. Using the value of the forward slope in the Cottrell equation, the
diffusion coefficient ‘D’ of the compound is calculated as 2.261 x 10⁻⁵
cm2s-1 at pH 4.0.
Controlled Potential Coulometry
Controlled potential coulometry was performed at pH 4.0 in the same cell setup. The
coulometric ‘n’ value was determined after exhaustive electrolysis 10 ml of 3.2x10⁻⁷
M dm-3 RO 12
solution (pH 4.0) and it was found to be 2. This indicates the two-electron transfer in the
electrooxidation of RO 12.
Reaction Mechanism
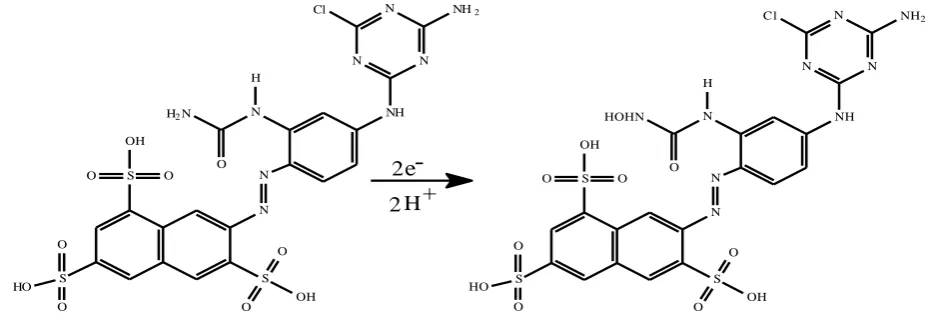
On the bases of above discussion the following mechanism was derived. The reactive orange
12 contain primary and secondary amine. The oxidation of primary amine takes place with 2
electron and proton reaction mechanism and the product is hydroxyl amine (Figure 3).
Fig 3, Reaction mechanism of reactive orange 12
N N S O O OH S HO S N H O
H2N NH
-IJSRR, 7(3) July – Sep., 2018 Page 1850
DIFFERENTIAL PULSE STRIPPING VOLTAMMETRY
Having chosen the best pH trial experiments on GCE were carried out to optimize various
parameters with the solution containing 300 ppb RO12. The adsorptive stripping voltammetry of
RO12 was carried out on plain GCE at a positive potential and the stripping peak potential was close
to the anodic oxidation potential observed in CV. This suggests the adsorptive accumulation and
anodic stripping of the substrate. The factors affecting the electrode process were optimized and
discussed as follows. Generally adsorptive stripping voltammetry involves two major steps. The
analyte molecules were first accumulated by adsorption on the electrode surface from the bulk and
then the accumulated molecules were stripped out giving specific signals. Hence, optimization of
accumulation potential was done in the first part by fixing other parameters as in default setup. The
effect of accumulation potential was studied by varying it from –800 to 800 mV. Maximum peak
current was observed at 400 mV and it was fixed as the maximum peak current accumulation
potential. The anion of the dye adsorbed easily at a positive potential due to electrostatic attraction.
The effect of deposition time on the stripping signal in the range 15 to 90 sec was studied and the
peak current reached maximum value at 60 seconds. The initial scan potential is another important
parameter as it confirms the non-faradaic nature of the preconcentration step. It also controls both the
peak potential and peak current in the stripping voltammogram. The influence of initial potential on
the peak current was studied by varying from –1300 to -600 mV. Better response was observed at –
1000 mV. The pulse height was varied from 25 to 200 mV and the maximum value was obtained at
150 mV. The effect of pulse width was studied in between 25 to 200 msec and was found that
maximum peak current was at 75 msec. Effect of scan increment was studied by varying it from 2 to
20 mV. The peak current was linearly dependent on the scan increment up to 16 mV. The maximum
peak current was observed at the scan increment 16 mV and hence it was chosen as the best and
optimized scan increment. After fixing the above parameters the peak current response on scan rate
was also studied. The scan rate was varied from 20 to 120 mV/s. Highly resolved stripping response
with maximum peak current was obtained at the scan rate 50 mV/s. Hence, it was taken as the
optimum scan rate for studying the effect of the concentration.
ANALYTICAL CHARACTERISTICS
The dependence of peak current on concentration was studied under the above fixed optimum
parameters. The studies were carried out on glassy carbon electrode. A representative voltamogram
is presented in figure 4. Experimental results showed that the peak current increased with increase in
concentration of RO 12 on electrode and calibration plot arrived and are given figure 5. The
IJSRR, 7(3) July – Sep., 2018 Page 1851 identical measurements carried out at a concentration level of 300 ppb and the RSD values were
3.0% and the lower level of detection is 100 ppb.
Figure 4, Differential pulse stripping voltammetry behavior of 300 ppb of RO 12 on GCE
Figure 5, calibration plot of differential pulse stripping voltammetry
CONCLUSION
First attempt for studies of reactive orange 12 dye on glassy carbon electrode. The
electrochemical behavior of RO12 was studied in different pH media. All the pH s shows three
oxidation and two reduction peaks on GCE. Among the 13 medium of pH the cyclic voltammetric of
RO12 illustrate best responds in pH 4.0. The best medium used to studies of further electrochemical
behaviors. From five redox peaks the III anodic oxidation shows higher peak current and used for y = 0.012x - 2.133
R² = 0.992
0 1 2 3 4 5 6 7
200 300 400 500 600 700
C
urre
nt
(
A)
IJSRR, 7(3) July – Sep., 2018 Page 1852 other correlations. The peak current against scan rate and square root of scan rate and log of current
responds vs log of scan rate revealed the nature of electrode reaction as irreversible diffusion
controlled. The plot of Q vs. t½ for 1.6x10⁻⁷ M/cm3 concentration of RO 12 is obtained 2.261 x 10⁻⁵
cm2sec-1 diffusion coefficient ‘D. The bolometric ‘n’ value was determined after exhaustive
electrolysis 10 ml of 3.2x10⁻⁷ M dm-3 RO 12 solution (pH 4.0) and it was found to be 2. The
oxidation of primary amine takes place with 2 electron and proton reaction mechanism and the
product is hydroxyl amine. The dependence of peak current on concentration was studied under the
fixed optimum parameters. The amount of RO 12 was determined through differential pulse
voltammetrically and the lower level of detection is 100 ppb.
REFERENCE
1. Mohan N, Balasubramanian N. In situ electrocatalytic oxidation of acid violet 12 dye
effluent. J Hazard Mater. 2006; 136: 239–243.
2. Siddique M, Farooq R, Khan ZM, Khan Z, Shaukat SF. Enhanced decomposition of reactive
blue 19 dye in ultrasound assisted electrochemical reactor. Ultra Sonochem. 2011; 18: 190–
196.
3. Gouvea CA, Wypych F, Moraes SG, Duran N, Nagata N, Peralta-Zamora P.
Semiconductor-assisted photocatalytic degradation of reactive dyes in aqueous solution. Chemosphere.
2000; 40(4): 433–440
4. Tang C, Chen V. The photocatalytic degradation of reactive black 5 using TiO2/UV in an
annular photoreactor. Water Res. 2004; 38(11): 2775–2781
5. Lucas M, Mertens V, Corbisier A, Vanhulle S. Synthetic dyes decolourisation by white rot
fungi: development of original microtitre plate method and screening. Enzym Microb
Technol. 2008; 42: 97–106
6. Rajkumar K, Muthukumar M. Response surface optimization of electro-oxidation process
for the treatment of C.I. Reactive Yellow 186 dye: reaction pathways. Appl Water. 2015;
doi: 10.1007/s13201-015-0276-0
7. Rueffer M, Bejan D, Bunce NJ. Graphite: an active or an inactive anode. Electrochim Acta.
2011; 56: 2246–2253
8. Rajkumar K , Muthukumar M , Mangalaraja RV. Electrochemical degradation of C.I.
reactive orange 107 using gadolinium (Gd3+), neodymium (Nd3+) and samarium (Sm3+)
doped cerium oxide nanoparticles, International Journal of Industrial Chemistry. 2015; 6:
IJSRR, 7(3) July – Sep., 2018 Page 1853
9. Ajmal A, Rao RAK, Anwar S, Ahmad J, Ahmad R. Adsorption studies on rice husk: removal
and recovery of Cd (II) from wastewater. Bioresour. Technol. 2003; 86: 147-149.
10.Abd El-Latif MM, Ibrahim AM, El-Kady MF. Adsorption equilibrium, kinetics and
thermodynamics of methylene blue from aqueous solutions using biopolymer oak sawdust
composite. J. Am. Sci. 2010; 6: 276-283.
11.Ozacar M, Sengil IA. Adsorption of metal complex dyes from aqueous solutions by pine
sawdust. Bioresour Technol. 2005; 96: 791-795.
12.Dizge N, Aydiner C, Demirbas E, Kobya M, Kara S. Adsorption of reactive dyes from
aqueous solutions by fly ash: Kinetic and equilibrium studies. J. Hazard. Mater. 2008; 150:
737-747.
13.Ghaedi AM, Vafaei A, Hafezi S, Mohagheghian M. Artificial neural network, equilibrium,
kinetics and thermodynamics modeling of reactive orange 12 dye using rice husk. Asian J.
Chem. 2013; 25: 817-826
14.Dong Y M, He K, Zhao B, Yin Y, Yin L, Zhang A. Catalytic ozonation of azo dye active
brilliant red X-3B in water with natural mineral brucite. Catal. Commun. 2007; 8: 1599-1603.
15.Saratale R G, Saratale G D, Chang J S, Govindwar S P. Ecofriendly degradation of
sulfonated diazo dye C.I. reactive green 19A using micrococcus glutamicus NCIM-2168.
Bioresour. Technol. 2009; 100: 3897-3905.
16.Ozdemir C, Oden MK, Sahinkaya S, Kalipci E. Color removal from synthetic textile
wastewater by sono-fenton process. Clean Soil Air Water, 2011; 39(1): 60-67.
17.Chung KT, Stevens S E J. Degradation of azo dyes by environmental microorganisms and
helminthes. Environ Toxicol Chem. 1993; 12: 2121-2132.
18.Serkan Sahinkaya, Decolorization of reactive orange 16 via ferrate(VI) oxidation assisted by
sonication, Turk J Chem. 2017; 41: 577 – 586
19.Iscen CF, Kiran I, Ilhan S. Biosorption of reactive black 5 dye by penicillium restrictum: the
kinetic study. Journal of Hazardous Materials. 2007; 143: 335–340.
20.Osma JF, Saravia V, Toca-Herrera JL, Couto SR. Sunflower seed shells: A novel and
effective low-cost adsorbent for the removal of the diazo dye Reactive Black 5 from aqueous
solutions. Journal of Hazardous Materials. 2007; 147: 900–905.
21.Maytham Kadhim Obaid, Luqman Chuah Abdullah, Intidhar Jabir Idan. Removal of reactive
orange 16 dye from aqueous solution by using modified kenaf core fiber, Journal of