ORIGINAL RESEARCH
BRAIN
Contribution and Additional Impact of Imaging to the
SPAN-100 Score
P. Krishnan, G. Saposnik, B. Ovbiagele, L. Zhang, S. Symons, and R. Aviv
ABSTRACT
BACKGROUND AND PURPOSE: Stroke Prognostication by Using Age and NIHSS score (SPAN-100 index) facilitates stroke outcomes. We assessed imaging markers associated with the SPAN-100 index and their additional impact on outcome determination.
MATERIALS AND METHODS: Of 273 consecutive patients with acute ischemic stroke (⬍4.5 hours), 55 were characterized as SPAN-100-positive (age⫹NIHSS scoreⱖ100). A comprehensive imaging review evaluated differences, using the presence of the hyperattenuated vessel sign, ASPECTS, clot burden score, collateral score, CBV, CBF, and MTT. The primary outcome assessed was favorable outcome (mRSⱕ2). Secondary outcomes included recanalization, lack of neurologic improvement, and hemorrhagic transformation. Uni- and multivariate analyses assessed factors associated with favorable outcome. Area under the curve evaluated predictors of favorable clinical outcome.
RESULTS:Compared with the SPAN-100-negative group, the SPAN-100-positive group (55/273; 20%) demonstrated larger CBVs (⬍0.001), poorer collaterals (P⬍.001), and increased hemorrhagic transformation rates (56.0% versus 36%,P⫽.02) despite earlier time to rtPA (P⫽ .03). Favorable outcome was less common among patients with SPAN-100-positive compared with SPAN-100-negative (10.9% versus 42.2%; P⬍.001). Multivariate regression revealed poorer outcome for SPAN-100-positive (OR⫽0.17; 95% CI, 0.06 – 0.38;P⫽.001), clot burden score (OR⫽1.14; 95% CI, 1.05–1.25;P⬍.001), and CBV (OR⫽0.58; 95% CI, 0.46 – 0.72;P⫽.001). The addition of the clot burden score and CBV improved the predictive value of SPAN-100 alone for favorable outcome from 60% to 68% and 74%, respectively.
CONCLUSIONS: SPAN-100-positivity predicts a lower likelihood of favorable outcome and increased hemorrhagic transformation. CBV and clot burden score contribute to poorer outcomes among high-risk patients and improve stroke-outcome prediction.
ABBREVIATIONS:AUC⫽area under curve; CBS⫽clot burden score; SPAN-100⫽Stroke Prognostication Using Age and NIHSS
S
everal scores have been designed to prognosticate clinical out-comes in acute ischemic stroke and assess potential risks of intravenous thrombolysis.1Age and stroke severity measured bythe National Institutes of Health Stroke Scale are among major independent prognostic factors for determining stroke out-come.2,3Stroke Prognostication Using Age and NIHSS
(SPAN-100) was conceived by combining age in years and stroke severity measured by the NIHSS4and applying the combination to predict
clinical outcome and risk of intracerebral hemorrhage. With in-dividuals older than 80 years of age constituting a significant pro-portion of hospitalized patients with acute ischemic stroke, the relevance of the SPAN-100 is self-evident.5Moreover, the elderly
also have a higher risk of fatality and longer hospitalization, ne-cessitating the consideration of the benefit-harm ratio preceding rtPA therapy. More interestingly, most stroke predictive scores use either clinical or imaging components, and though several exist, their utility in clinical practice is somewhat restricted.1Multimodal
imag-ing-selection strategies are evolving into a cornerstone for stroke management to best define target groups with salvageable tissue at risk.6-9 Apart from excluding hemorrhage and early ischemic
changes, the presence and extent of ischemic core, intravascular clot burden, and extent of collaterals are critical elements assessed by im-aging, dictating management and outcome in patients with stroke.10
The simplicity of SPAN-100, using readily accessible informa-tion including age and NIHSS, makes it attractive for practical Received April 6, 2014; accepted after revision October 16.
From the Division of Neuroradiology (P.K., S.S., R.A.), Department of Medical Imag-ing, University of Toronto and Sunnybrook Health Sciences Centre, Toronto, On-tario, Canada; Stroke Outcome Reach Center (G.S.), Division of Neurology, Depart-ment of Medicine, St. Michael’s Hospital, University of Toronto, Ontario, Canada; Department of Neurosciences (B.O.), Medical University of South Carolina, Charleston, South Carolina; and Biostatistician (L.Z.), Sunnybrook Health Sciences Center, Toronto, Ontario, Canada.
P. Krishnan and G. Saposnik contributed equally to the article.
Paper previously presented at: American Society of Neuroradiology Annual Meet-ing and the Foundation of the ASNR Symposium, May 17–22, 2014; Montreal, Que-bec, Canada.
Please address correspondence to Richard I. Aviv, MD, FRCR, Sunnybrook Health Sciences Centre, 2075 Bayview Ave, Toronto, Ontario, Canada M4N 3M5; e-mail: [email protected]
use. Furthermore, imaging features accompanying SPAN-100-positivity provide insight into pathophysiologic characteristics of patients evaluated with SPAN-100. We sought to externally vali-date SPAN-100, document multimodal CT parameters associated with 100 status, and assess their interaction with SPAN-100 and clinical outcome.
MATERIALS AND METHODS
Study Design and Patient Cohort
A single-center retrospective study of patients presenting to a re-gional stroke center within 4.5 hours of anterior circulation stroke symptoms with a vessel occlusion, between October 2009 and December 2011, was performed. The institutional review board approved this study, and individual patient consent was obtained. Patients underwent clinical assessment by certified stroke neurol-ogists and an acute CT-based stroke protocol, including CTA and CTP. Follow-up imaging included repeat CTA/CTP at 24 hours and 5- to 7-day CT or MR imaging. Presenting demographic data collected included age, sex, and cerebrovascular risk factors, in-cluding hypertension, diabetes, hypercholesterolemia, coronary artery disease, atrial fibrillation, and history of smoking and pre-vious stroke. Baseline National Institutes of Health Stroke Scale (pre-NIHSS) and 3-month follow-up modified Rankin Scale scores were documented. Patients were not treated with intra-arterial therapies because this option was not available when these patients underwent the CT studies.
Outcome Measures. The primary outcome was favorable clinical outcome defined as mRS ⱕ 2. Secondary outcomes included hemorrhagic transformation (by using the European Cooperative Acute Stroke Study definition), recanalization, and lack of NIHSS improvement between baseline and 24 hours (defined as⬍ 3-point NIHSS change).4 Patients were divided into 2 groups:
SPAN-100-positive (age⫹NIHSS score of⬎100) and SPAN-100-negative (age⫹NIHSS score of⬍100).
Image Analysis. Imaging was assessed by an experienced neuro-radiologist. A comprehensive imaging review documented the presence of the hyperattenuated vessel sign, ASPECTS, early isch-emic changes, clot burden score, and collateral score. CBV, CBF, and MTT volumes were measured planimetrically by using Med-ical Image Processing, Analysis, and Visualization, Version 4.4.1 (National Institutes of Health, Bethesda, Maryland; http:// mipav.cit.nih.gov). The threshold adopted for volumetric mea-surements of penumbra and infarct was internally validated. Pen-umbral tissue was identified by using a threshold of CBF of⬎19 mL/100 g/min and relative MTT of⬍140%, whereas infarct on the CBV map was defined by CBV of⬍1.48 mL/100 g.11CT
Per-fusion software, Version 4 (GE Healthcare, Milwaukee, Wiscon-sin) was used to analyze data from the baseline CT perfusion study to calculate parametric maps of CBF, CBV, and MTT. A decon-volution of the arterial input curves by using the model of John-son and WilJohn-son was applied to calculate the parametric maps.12A
venous output function from the anterior cerebral artery and the superior sagittal sinus was obtained to correct for partial volume averaging of the arterial input curves. Functional CT perfusions maps were analyzed by using custom software (IDL, Version 6.1; RSI-Research Systems, Chapel Hill, North Carolina). All
compo-nents of the analysis were performed blinded to the clinical infor-mation to reduce interpreter bias. Pixels with CBF values of⬎100 mL/100 g/min or CBV of⬎8 mL/100 g were excluded and were not used for calculating average CBF and CBV values for regions of in-terest. The time from symptom onset to scan, rtPA treatment, and hemorrhagic transformation on follow-up was noted for each patient.
Clot burden score (CBS) was used to quantify the burden of intracranial thrombus in the proximal intracranial circulation. The score allocates points on a scale of 0 –10 for contrast opacifi-cation of proximal intracranial vessels. Two points each were sub-tracted for the presence of thrombus in the supraclinoid ICA and proximal or distal M1, and 1 point each, for the infraclinoid ICA, A1, and each affected proximal M2 branch (ⱕ2 points).12
Collat-eral score was used to grade the extent of collatCollat-eral vascular supply to the occluded MCA distribution on a scale of 0 –3. A score of zero denotes absent collateral supply; a score of 1, collateral filling ofⱕ50%; a score of 2,⬎50% but⬍100%; and a score of 3, col-lateral supply to 100% of the occluded MCA distribution.12
Scanning Protocol and Generation of Parametric Maps The CT stroke protocol was performed on a 64-section CT scan-ner (LightSpeed VCT; GE Healthcare) and included pre- and postcontrast CT head scans. The parameters used were as follows: 120 kV(peak), 340 mA, 8⫻5 mm collimation, 1 s/rotation, and table speed of 15 mm/rotation. Standard CTA from the aortic arch to the vertex was performed with the following parameters: 0.7-mL/kg iodinated contrast, maximum of 90 mL (iohexol; Om-nipaque, 300 mg iodine/mL; GE Healthcare), 5- to 10-second delay, 120 kVp, 270 mA, 1 s/rotation, 1.25-mm-thick sections, and table speed of 3.7 mm/rotation. CTA data comprised multi-planar 7-mm MIP reconstructions and 4-mm axial reformats on CTA source images. The biphasic CTP technique included a 45-second initial scan reconstructed at 0.5-45-second intervals, produc-ing a series of 90 sequential images for each of the 8 sections, covering 4 cm from the basal ganglia to the lateral ventricles. This was followed by a second phase covering the same 8 sections, 15 seconds apart for 6 acquisitions for an additional 90 seconds as previously published.13
CTP scanning parameters used were the following: 80 kVp, 100 mA, 0.5-mL/g (maximum, 50-mL) iodinated contrast agent injected at 4 mL/s with a 3- to 5-second delay.
Statistical Analysis
All analyses were conducted by SAS (Version 9.3 for Windows; SAS Institute, Cary, North Carolina). We compared demographic and clinical factors between patients with SPAN-100-positivity and -negativity. The2test was used for categoric variables; the
association between favorable outcome and demographic/ clinical factors, we performed a univariate logistic regression analysis as described above. Factors withP⬍.10 in univariate analysis were included in a backward stepwise logistic regres-sion after adjusting for SPAN-100 status.
The additional benefit of significant clinical and radiologic factors over SPAN-100 as a null model for favorable outcome prediction was tested by using the Akaike information criterion (AIC⫽ LRES⫹2⫻k). A lower Akaike information criterion
indicates a better model fit, whereLRESrepresents the restricted
maximized⫺2⫻log-likelihood (⫺2 L) of the model, andk, the number of parameters in the model. The G2 likelihood ratio sta-tistic is the difference between⫺2Lof the fitted model (trans-formed threshold) and the reference model (nontrans(trans-formed threshold). A 2-sidedPvalue was obtained from the G2 likelihood ratio2test. Similarly, the area under the curve (AUC) was
cal-culated for each model by using receiver operator characteristic curves and was compared with pair-wise comparison. APvalue⬍ .05 was considered significant.
RESULTS
Among 273 patients with acute ischemic stroke, 55 (20.1%) were positive (Table 1). Factors associated with SPAN-100-positivity included female sex (P⫽.02), hypertension (P⫽.001),
and diastolic blood pressure (P⫽.006). rtPA was given to 47/55 (85.5%) of the SPAN-100-positive group and 172/218 (78.9%) of the SPAN-100-negative group (P⫽.28). The rtPA dose was comparable in both groups with a mean of 63 mg (P⫽
.7), though patients with SPAN-100-posi-tivity received rtPA earlier (143 minutes versus 161 minutes;P⫽.03).
Differences in Imaging Parameters by SPAN-100 Status
The collateral score was lower in patients with SPAN-100-positivity, consistent with worse collateral circulation (P ⬍
.001). Baseline CBVs were higher in patients with SPAN-100-positivity (P⫽.001) despite similar CBF/MTT volumes (P⫽.7 and .6, respectively), indicating comparable degrees of isch-emia. No significant difference for me-dian baseline ASPECTS (P⫽.39), hy-perattenuated MCA sign, clot burden score, or early ischemic change was observed. Stepwise multivariate logis-tic regression analysis revealed that hypertension (OR⫽3.1; 95% CI, 1.1– 7.07;P⫽.003), female sex (OR⫽0.47; 95% CI, 0.2– 0.8;P⫽.02), and collat-eral score (OR⫽0.4; 95% CI, 0.2– 0.6;
P⬍.001) were associated with SPAN-100-positive status. Baseline CBV did not reach clinical significance.
Primary and Secondary Outcome by SPAN-100 Status Favorable clinical outcome was less common in patients with SPAN-100-positivity (10.9% versus 42.2%,P⬍.001). Any hem-orrhage was more common in patients with SPAN-100-positivity (56% versus 38.6%,P⫽.02). Hemorrhagic transformation was the most common hemorrhagic infarction subtype (Table 1). Re-canalization rate and lack of NIHSS improvement were similar (P⫽.4 andP⫽.7). In contradistinction to patients with SPAN-100-negativity, no significant demographic imaging or outcome differences were present in patients with SPAN-100-positivity with or without rtPA treatment. Patients with SPAN-100-nega-tivity treated with rtPA were more likely than non-rtPA-treated patients to present earlier (P⫽.01), demonstrate the hyperat-tenuated sign (P⫽.06), undergo hemorrhagic infarction (P⫽
.05), recanalization (P ⫽ .009), show neurologic improvement within 24 hours, and experience a good clinical outcome (P⫽.06).
Predictors of Outcome
[image:3.594.64.377.66.420.2]Multiple clinical and radiologic factors were associated with fa-vorable clinical outcome on univariate analysis (Table 2). The multivariate logistic regression showed that SPAN-100-positivity (OR⫽0.17; 95% CI, 0.06 – 0.38;P⬍.001) and larger CBV (OR⫽ 0.58; 95% CI, 0.46 – 0.72;P⬍.001) were associated with a lower Table 1: Comparing demographics/clinical factors between patients with positive SPAN-100
and patients with negative SPAN-100
SPAN-100-Negative (n= 218)
SPAN-100-Positive
(n= 55) PValue
Age (yr) 68.2⫾12.5 85.5⫾5.07 ⬍.001
NIHSS (median, IQR) 13 (7–18) 21 (17–24) ⬍.001
Male sex 121 (55.5%) 22 (40) .04
SBP 157.7 (139–172) 156.04 (138–177) .77
DBP 84.9 (71–95) 76.1 (64–87) .01
Glucose (admission) 8.1 (5.8–8.1) 7.6 (6.0–9.0) .18
Risk factors
Hypertension 127 (58.26) 45 (81.8) .001
Diabetes mellitus 43 (19.72) 10 (18.18) .79
Hypercholesterolemia 72 (33.03) 25 (45.4) .08
Coronary artery disease 53 (24.3) 12 (21.8) .69
Atrial fibrillation 64 (29.36) 19 (34.5) .45
Smoker 44 (20.1) 6 (10.9) .11
Stroke 1 (0.46) 1 (1.82) .29
Hyperdense sign 114 (52.53) 35 (63.64) .13
ASPECTS (median) (IQR) 7 (6–9) 7 (5–8) .39
Clot burden score 6 (4–9) 6 (5–9) .29
Collateral score 2 (2–3) 2 (1–2) ⬍.001
CBV (median) (IQR) 14.7 (4.7–34.7) 34.7 (13.8–60.5) ⬍.001
CBF 101.6 (55.3–133.1) 98.2 (74.6–129.5) .75
MTT 104.5 (58.5–133.4) 98.4 (74.7–130.5) .69
Time and thrombolysis
rtPA dose 63.0 (54–73) 63.0 (54–72) .75
Onset to CT 104.0 (80–148) 108.0 (75–127) .62
Onset to rtPA 161.7 (147) 143.0 (131) .03
Outcome
Recanalization 119 (55.35) 33 (61.1) .44
mRS (at follow-up) 3 (1–4) 5 (4–6) ⬍.001
mRSⱕ2 92 (42.2) 6 (10.9) ⬍.001
NIHSS improves⬎3 in 24 hours 101 (46.3) 27 (49) .71
Hemorrhagic transformation 78 (38.6) 28 (56.0) .02
Hemorrhage infarct 64 (29.4) 23 (41.8) .07
Parenchymal hemorrhage 26 (11.9) 9 (16.4) .37
likelihood of a favorable outcome, whereas a higher clot burden score (OR⫽1.14; 95% CI, 1.05–1.25;P⫽.003) was associated with a greater chance of a favorable outcome. No interaction was found between SPAN-100 and CBV (P⫽.53) or between SPAN-100 and clot burden score (P⫽.98), respectively. The AUC for favorable clinical outcome by using SPAN-100 alone was
60%, increasing significantly to 68% and 74% with the addition of the clot burden score and CBV, respectively (Table 3). Univariate logistic regression for any hemorrhage showed significance for NIHSS (P⬍.001), hyperattenuated sign (P⫽.001), ASPECTS (P⫽.022), collat-eral score (P⫽.020), CBV (P⬍.001), and SPAN-100 (P⫽.027). Stepwise lo-gistic regression of SPAN-100, collateral score, CBV, and clot burden score dem-onstrated significant associations for SPAN-100 (OR⫽2.17; 95% CI, 1.16 – 4.14;P ⫽.001) and clot burden score (OR ⫽0.91; 95% CI, 0.84 – 0.99;P ⫽
.03) with hemorrhagic transformation. The AUC for hemorrhagic transforma-tion by using SPAN-100 alone was 55%, increasing significantly to 62% with the addition of clot burden score (Table 3).
DISCUSSION
Early prognostication of ischemic stroke outcome is a critical component of stroke management. SPAN-100, combining age and NIHSS score, is a re-cently proposed simple and practical tool to estimate the clinical response and risk of hemorrhagic complications after thrombolysis.4Although other clinical
risk scores1may have a better power to
prognosticate stroke, the SPAN-100 in-dex is a practical tool that may help de-termine patients who are more likely to achieve a good or poor outcome. The combination of a simple clinical tool with imaging parameters may help strat-ify patients according to their risk for re-ceiving thrombolytic or endovascular therapy for acute stroke. We evaluated the role of imaging parameters added to the SPAN-100 score to estimate clinical outcomes. We confirmed that patients with SPAN-100-positivity were less likely to be independent irrespective of rtPA treatment, while carrying a higher risk of hemorrhagic complications. No-tably, worse outcomes occurred despite earlier time to rtPA therapy. Patients with SPAN-100-positivity had lower collateral circulation and larger baseline CBVs. Extending prior studies, we explored the interaction be-tween the SPAN-100 index and additional radiologic factors and assessed their additional predictive value over SPAN-100 status for clinical outcome. Both the clot burden score (reflect-ing the burden of intraluminal thrombus) and CBV (reflect(reflect-ing infarct core) remained significant contributors to clinical out-Table 2: Univariate logistic regression analysis of good clinical outcome (mRS<2) on
demographic and clinical factors and imaging parameters mRS ≤ 2 (n= 98),
Favorable Outcome
mRS > 2 (n= 175), Poor Outcome
P
Value OR (95% CI)
Age (yr) 67 (57–78) 76 (66–83) ⬍.001 0.96 (0.94–0.98)
NIHSS pre-rtPA (median, IQR) 17 (12–21) 9.0 (4–15) ⬍.001 0.86 (0.82–0.90)
Female sex 42 (42.86) 88 (50.29) .23 1.35 (0.82–2.23)
SBP 151 (138.5–173.5) 155 (137–171.5) .93 1.00 (0.99–1.01)
DBP 81 (72.5–92) 80 (70–90) .26 1.01 (0.99–1.02)
Glucose (admission)a 6.4 (5.4–7.3) 6.4 (5.4–7.3) .04 0.42 (0.17–0.92) Risk factors
Hypertension 54 (55.10) 118 (67.43%) .04 0.59 (0.36–0.99) Diabetes mellitus 15 (15.31) 38 (21.71) .20 0.65 (0.33–1.24) Hypercholesterolemia 29 (29.59) 68 (38.86) .12 0.66 (0.39–1.12) Coronary artery disease 23 (24.3) 42 (24) .92 0.97 (0.54–1.73) Atrial fibrillation 29 (29.59) 54 (30.86) .82 0.94 (0.55–1.61)
Smoker 22 (22.45) 28 (16) .18 1.52 (0.81–2.83)
Stroke 1 (1.02) 1 (0.57) .68 1.79 (0.07–45.66)
Hyperdense sign 48 (48.98%) 101 (58.05) .14 0.69 (0.42–1.14)
EIC 84 (85.91) 158 (90.29) .25 0.65 (0.30–1.39)
ASPECTS (median, IQR) 8 (6–9) 7 (5–8) .001 1.24 (1.09–1.42) Clot burden score 7 (6–9) 6 (4–9) .002 1.14 (1.05–1.25)
Collateral score 2 (2–3) 2 (1–3) .02 1.46 (1.06–2.04)
CBV (median, IQR)a 8.77 (2.5–24.09) 25.14 (9.1–49.60) ⬍.001 0.58 (0.46–0.72) CBF 88.12 (44.7–122.1) 104.17 (74.3–143.6) ⬍.001 0.99 (0.99–1.00) MTT 87.96 (43.2–125.9) 105.4 (77.5–138.8) ⬍.001 0.99 (0.99–1.00) Time and thrombolysis
rtPA given (No. of the patients) 80 (81.63%) 139 (79.43%) .66 1.15 (0.62–2.20) rtPA dose (mg) 64.0 (50–73) 62.0 (54–72) .94 1.00 (0.98–1.02) Onset to CT (min) (median, IQR)a 102.0 (74–151) 105.0 (80.5–141.5) .73 1.08 (0.68–1.72) Onset to rtPA (min) (median IQR) 145 (120–179) 146 (126–175) .70 1.00 (1.00–1.01) Outcome
Recanalization 119 (55.35%) 33 (61.1%) ⬍.001 3.58 (2.09–6.30) Hemorrhagic transformation 28 (30.43%) 78 (48.75%) .004 0.46 (0.26–0.78) NIHSS improves⬎3 in 24 hours 101 (46.3%) 27 (49%) .20 1.38 (0.84–2.27) SPAN-100-positive 6 (6.12%) 49 (28%) ⬍.001 0.17 (0.06–0.38)
Note:—EIC indicates early ischemic changes.
a
[image:4.594.56.376.64.401.2]Natural log-transformation was applied for normalizing the distribution.
Table 3: Prediction of favorable clinical outcome and hemorrhagic transformation
AIC
−2
(Log-Likelihood) R2a AUC OR 95% CI ValueP
Favorable clinical outcome
Model of SPAN-100 only 316.64 312.64 0.054 0.599 0.56–0.64
SPAN-100 0.2 0.1–0.4
Model of SPAN-100, CBS 307.42 301.42 0.088 0.676 0.61–0.74 .004
SPAN-100 0.2 0.1–0.3
CBS 1.2 1.1–1.3
Model of SPAN-100, CBS, CBV 294.09 286.09 0.135 0.742 0.68–0.80 ⬍.001
SPAN-100 0.2 0.1–0.5
CBS 1.1 1.0–1.2
CBV 0.6 0.5–0.8
Hemorrhagic transformation
Model of SPAN-100 only 342.06 338.06 0.019 0.55 0.49–0.60
SPAN-100 2.0 1.1–3.8
Model of SPAN-100, CBS 339.39 333.392 0.037 0.62 0.54.5–0.69 .02
SPAN-100 2.2 1.2–4.1
CBS 0.9 0.8–0.9
Note:—AIC indicates Akaike information criterion.
a
R2
[image:4.594.53.380.447.621.2]come prediction and improved the prediction of the probability of achieving a favorable outcome at 3 months. Similarly the SPAN-100 index and clot burden score predicted hemorrhagic transformation.
In patients with SPAN-100-positivity, reduced collateral flow contributed to larger baseline CBVs manifest by its dominance within a multivariate analysis of SPAN-100 status and the loss of CBV significance. Collateral score reduction in patients with SPAN-100-positivity is supported by prior reports of diminishing functional collateral compensatory capacity with age.14Similarly, the CTA
col-lateral profile is strongly associated with baseline infarct volume and long-term outcome in acute ischemic stroke.15-17Poor collateral
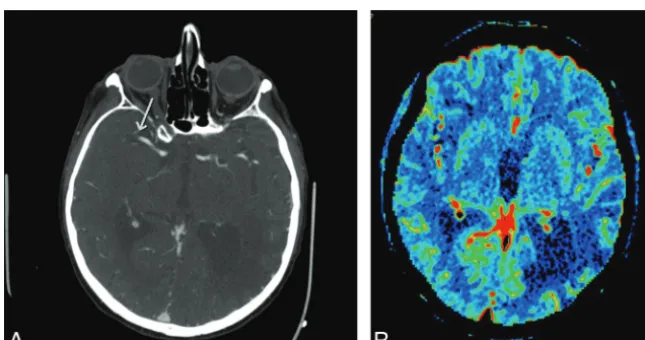
flow and larger CBV, in part, explain the worse outcome in patients with SPAN-100-positivity despite an earlier time to rtPA (Fig 1). Increased intracranial hemorrhage in patients with SPAN-100-posi-tivity may also, in part, be attributed to poorer collaterals18and larger
baseline CBVs, with a clear association between baseline infarct
vol-ume and hemorrhage as previously de-scribed.19,20 Despite CBV differences in
SPAN-100 subgroups on univariate anal-ysis, no significant baseline difference of ASPECTS was seen. This apparent dispar-ity likely reflects the relatively coarse sensi-tivity of ASPECTS for lesion volume within the M1– 6 or cortical regions com-pared with the significant impact of even small basal ganglia lesions on ASPECTS. Heavy weighting of ASPECTS to the basal ganglia may, in part, contribute to its modest sensitivity for outcome prediction.21,22
Although reduced collateral flow was also associated with unfavorable out-come on univariate analysis, CBV and the clot burden score remained domi-nant in the multivariate analysis in addi-tion to SPAN-100 status. In the multi-variate analysis, the imaging factors of SPAN-100 status, CBV, and clot burden scores were significantly associated with the mRS outcome (Fig 2). The lack of interaction between SPAN-100 status and clot burden score or between CBV and SPAN-100 status indicated that the probability difference on the mRS good outcome between SPAN-100-positivity and -negativity was similar with clot burden score changes or with CBV changes. For instance, in patients with a clot burden score of 6, the proportion of good mRS outcome was 6% for patients with positive SPAN-100 and 49% for pa-tients with negative SPAN-100 (the dif-ference was 43%). In patients with a clot burden score of 9, the difference in the proportion of good mRS outcome was 33% versus 71% for those with positive or negative SPAN-100 (the difference was 38%). These nonsignif-icant interaction terms might be due to the limited sample size in patients from the SPAN-100-positive group. Indeed, similar to a prior study, the AUC of SPAN-100 status alone was 60%.23The
addition of CBV and clot burden score, however, increased pre-dictions to 74%. A systematic review by Schiemanck et al24and
several other studies7,10,25corroborated the importance of lesion
volume and neurologic deficit assessed by the NIHSS score for clinical-outcome determination. Clot location and volume were both previously shown to be important independent prognostic factors of outcome.10,12,26Similarly, larger clot burden is
associ-ated with larger baseline infarct volumes, poorer clinical out-come, and risk of hemorrhage.26,27
Limitations of the present study include a retrospective data analysis with a modest sample size. CBV, though improving prog-nostication for outcome, is difficult to measure in real-time and complicates the purposeful simplicity of the SPAN-100 index as a FIG 1.Coronal CTA MIP image and CBV map in a patient with SPAN-100-positivity at
presenta-tion. Coronal CTA MIP image (A) in this SPAN-100-positive patient with acute right-sided hemi-paresis and subsequent unfavorable outcome demonstrates abrupt occlusion of the main stem left MCA with a collateral score of zero. The corresponding CBV map (B) demonstrates a large CBV deficit.
[image:5.594.54.378.46.206.2] [image:5.594.54.377.270.440.2]quick clinical prognostic tool. Whether rapid estimations of CBV, for example by ABC/2 (a commonly used method for volume calculation), provide benefit similar to that of a planimetric ap-proach remains uncertain. The limited spatial resolution of CT perfusion may also underestimate complete CBV measurement. This issue is easily addressed with widely available table-toggle techniques28,29or 320-section scanners capable of whole-head
imaging. Furthermore, the small sample of patients with SPAN-100-positivity is a limitation of this study and could have partly contributed to the lack of a significant difference in outcomes in this group. Finally, the accuracy of CTP CBV for DWI core assess-ment has recently been questioned,30though in our experience,
this was largely mitigated by protocols that capture the full time-attenuation curve, thereby avoiding CBV underestimation.
Most of the predictive scores for outcome in acute stroke are inclusive of age and stroke severity scale (NIHSS), and their pre-dictive power is moderate. Hence, consideration for rtPA treat-ment is currently based on clinical judgtreat-ment, and clinical scores are used as an adjunct. Because the SPAN-100 index is among the more simplified prognostic scores for stroke outcome with core prognostic determinants of age and NIHSS, it would be reason-able to suggest that imaging parameters should be an integral part of the future stroke-outcome prediction scores with a need to customize for individual patients with a greater degree of preci-sion. Our study re-emphasizes the need to incorporate imaging parameters (eg, CBV, collaterals, and clot burden scores) to pro-vide additional predictive power.
The practical use of clinical prediction scores at present is lim-ited in decision-making paradigms and is essentially complemen-tary to clinical assessment. Future trials and larger retrospective studies inclusive of imaging parameters are needed to design com-prehensive clinical scores with the potential to triage patients and tailor treatment options.
CONCLUSIONS
Imaging parameters improve outcome estimation in stroke prog-nostication when added to the clinical risk score (SPAN-100 in-dex). Reduced collateral flow, higher clot burden, and larger ce-rebral blood volume deficits offer insight into the most relevant pathophysiologic parameters explaining poorer clinical outcomes among patients with SPAN-100-positivity.
The addition of imaging parameters to the SPAN-100 index improves the predictive power of stroke prognostication (ie, the prediction of favorable outcome and the risk of subsequent hem-orrhage). The inherent simplicity of the SPAN-100 index and ad-ditional imaging parameters renders easy translation of this pre-diction score for practical use in routine clinical decision-making. The routinely performed imaging assessment for acute stroke (multimodal CT and the parameters CBV, clot burden score, and collateral scores) could potentially add meaningful value to a well-established simplified clinical score (SPAN-100 index) for stroke prognostication.
Disclosures: Gustavo Saposnik—UNRELATED:Grants/Grants Pending: Dr Saposnik is supported by the Distinguished Clinician Scientist Award from the Heart and Stroke Foundation of Canada.
REFERENCES
1. Rabinstein A. Rundek T. Prediction of outcome after ischemic stroke: the value of clinical scores.Neurology2013;80:15–16 2. Weimar C, Konig IR, Kraywinkel K, et al.Age and National Institutes
of Health Stroke Scale Score within 6 hours after onset are accurate predictors of outcome after cerebral ischemia: development and external validation of prognostic models.Stroke2004;35:158 – 62 3. Ko¨nig I, Ziegler A, Bluhmki E, et al.Predicting long-term outcome
after acute ischemic stroke: a simple index works in patients from controlled clinical trials.Stroke2008;39:1821–26
4. Saposnik G, Guzik A, Reeves M, et al.SPAN 100: a practical method of stroke prognostication combining age and NIHSS after tPA.
Neurology2013;80:21–28
5. Saposnik G, Cote R, Phillips S, et al.Stroke Outcome Research Can-ada (SORCan) Working Group: variables associated with 7-day, 30-day, and 1-year fatality after ischemic stroke. Stroke 2008;39: 2522–30
6. Obach V, Oleaga L, Urra X, et al.Multimodal CT-assisted thrombol-ysis in patients with acute stroke: a cohort study.Stroke2011;42: 1129 –31
7. Lev MH, Segal AZ, Farkas J, et al.Utility of perfusion-weighted CT imaging in acute middle cerebral artery stroke treated with intra-arterial thrombolysis: prediction of final infarct volume and clini-cal outcome.Stroke2001;32:2021–18
8. Campbell BC, Weir L, Desmond PM, et al.CT perfusion improves diagnostic accuracy and confidence in acute ischaemic stroke.
J Neurol Neurosurg Psychiatry2013;84:613–18
9. Hopyan J, Ciarallo A, Dowlatshahi D, et al.Certainty of stroke diagnosis: incremental benefit with CT perfusion over noncontrast CT and CT angiography.Radiology2010;255:142–53
10. Demchuk A, Menon B, Goyal M.Imaging based selection in acute ischemic stroke trials: a quest for imaging sweet spots.Ann N Y Acad Sci2012;1268:63–71
11. Eilaghi A, d’Esterre CD, Lee TY, et al.Toward patient-tailored per-fusion thresholds for prediction of stroke outcome.AJNR Am J Neuroradiol2014;35:472–77
12. Tan IY, Demchuk AM, Hopyan J, et al.CT angiography clot burden score and collateral score: correlation with clinical and radiologic outcomes in acute middle cerebral artery infarct.AJNR Am J Neu-roradiol2009;30:525–31
13. Aviv RI, d’Esterre CD, Murphy BD, et al.Hemorrhagic transforma-tion of ischemic stroke: predictransforma-tion with CT perfusion.Radiology
2009;250:867–77
14. Brozici M, van der Zwan A, Hillen B.Anatomy and functionality of leptomeningeal anastomoses: a review.Stroke2003;34:2750 – 62 15. Souza L, Yoo A, Chaudhry Z, et al.Malignant CTA collateral profile
is highly specific for large admission DWI infarct core and poor outcome in acute stroke.AJNR Am J Neuroradiol2012;33:1331–36 16. Lima FO, Furie KL, Silva GS, et al.The pattern of leptomeningeal
collaterals on CT angiography is a strong predictor of long-term functional outcome in stroke patients with large vessel intracranial occlusion.Stroke2010;41:2316 –22
17. Liebeskind D.Collateral perfusion: time for novel paradigms in ce-rebral ischemia.Int J Stroke2012;7:309 –10
18. Bang O, Saver J, Kim S, et al.Collateral flow averts hemorrhagic transformation after endovascular therapy for acute ischemic stroke.Stroke2011;42:2235–39
19. Bhatt A, Vora A, Thomas A, et al.Lower pretreatment cerebral blood volume affects hemorrhagic risks after intra-arterial revasculariza-tion in acute stroke. Neurosurgery 2008;63:874 –78; discussion 878 –79
20. Jain A, Jain M, Kanthala A, et al.Association of CT perfusion param-eters with hemorrhagic transformation in acute ischemic stroke.
AJNR Am J Neuroradiol2013;34:1895–900
22. Menon BK, Puetz V, Kochar P, et al.ASPECTS and other neuroim-aging scores in the triage and prediction of outcome in acute stroke patients.Neuroimaging Clin N Am2011;21:407–23, xii
23. Vogt G, Laage R, Shuaib A, et al.Initial lesion volume is an indepen-dent predictor of clinical stroke outcome at day 90: an analysis of the Virtual International Stroke Trials Archive (VISTA) database.
Stroke2012;43:1266 –72
24. Schiemanck SK, Kwakkel G, Post MW, et al.Predictive value of isch-emic lesion volume assessed with magnetic resonance imaging for neurological deficits and functional outcome post stroke: a critical review of the literature.Neurorehabil Neural Repair2006;20:492–502 25. Murphy A, Symons SP, Hopyan J, et al.Factors influencing clinically meaningful recanalization after IV-rtPA in acute ischemic stroke.
AJNR Am J Neuroradiol2013;34:146 –52
26. Sillanpa¨a¨ N, Saarinen JT, Rusanen H, et al.Location of the clot and
outcome of perfusion defects in acute anterior circulation stroke treated with intravenous thrombolysis. AJNR Am J Neuroradiol
2013;34:100 – 06
27. Puetz V, Dzialowski I, Hill MD, et al.Calgary CTA Study Group: intracranial thrombus extent predicts clinical outcome, final in-farct size and hemorrhagic transformation in ischemic stroke: the clot burden score.Int J Stroke2008;3:230 –36
28. Roberts HC, Roberts TP, Smith WS, et al.Multisection dynamic CT perfusion for acute cerebral ischemia: the “toggling-table” tech-nique.AJNR Am J Neuroradiol2001;22:1077– 80
29. Youn SW, Kim JH, Weon YC, et al.Perfusion CT of the brain using 40-mm-wide detector and toggling table technique for initial imag-ing of acute stroke.AJR Am J Roentgenol2008;191:W120 –26 30. Lev MH.Acute stroke imaging: what is sufficient for triage to