ORIGINAL RESEARCH
Evolution of Unilateral Perinatal Arterial Ischemic
Stroke on Conventional and Diffusion-Weighted
MR Imaging
J. Dudink E. Mercuri L. Al-Nakib P. Govaert S.J. Counsell M.A. Rutherford F.M. Cowan
BACKGROUND AND PURPOSE: Knowledge of the sequence of signal-intensity (SI) changes on conven-tional and diffusion-weighted MR imaging (DWI) following perinatal arterial ischemic stroke (PAIS) is limited, adding to the difficulty in timing the onset of PAIS. We hypothesized that SI changes seen on early sequential MR imaging following PAIS should follow a similar time course. The aim of this study was to evaluate the time course of SI changes by using a simple classification that could be assessed visually from conventional imaging and DWI in term-born neonates with symptomatic unilateral PAIS.
MATERIALS AND METHODS: Infantsⱖ36 weeks gestation with unilateral PAIS in the territory of a main cerebral artery with a first MR imaging performed within the first postnatal month were included in this study. All subsequent scans up to 3 months postnatal age were also evaluated. For the conventional MR imaging scans, a visual SI scoring system was used (⫺1⫽lower, 0⫽equal, 1⫽higher) compared with the contralesional hemisphere. For the DWIs, SI of the infarcted tissue was classified into the 3 groups: 1) severe hyperintensity (HI), 2) moderate and mild HI, and 3) no HI.
RESULTS: We analyzed 43 scans (mean age at first scanning, 4 days) from 21 term infants. Changes in SI on conventional T1 and T2 images were remarkably consistent among infants. The cortex was of low SI on T1 and high SI on T2 until day 6 when SIs reversed and cortical highlighting was seen for 1–2 months. The white matter was high SI on T1 in the first 8 –9 days and on T2 for⬎2 weeks before becoming low SI. Secondary SI changes remote from the infarction were seen in the thalamus and brain stem in the first week, and atrophy was seen after 4 weeks. All DWIs showed high SI of the affected region until at least day 4, which fell to equal or below that of the contralesional hemisphere by day 12.
CONCLUSIONS:The pattern of SI change on conventional imaging and DWI following PAIS was remarkably consistent among patients, suggesting that PAIS in symptomatic term-born infants occurs within a very limited timeframe around birth.
P
erinatal arterial ischemic stroke (PAIS) is an important cause of long-term neurologic morbidity including cere-bral palsy, epilepsy, and cognitive impairment.1-6The inci-dence of neonatally symptomatic PAIS is at least 1/4000 term liveborn infants.7Term neonates with PAIS usually present with seizures after having been considered healthy after birth, with Apgar scores and cord pH values that were considered normal.1,8These seizures may be, but are not always, con-tralateral to the site of infarction, are mostly clonic in nature, and can be subtle9; sometimes the presenting symptoms are apnea, duskiness, poor feeding, hypotonia, and irritabili-ty.10,11PAIS is occasionally associated with hypoxic-ischemicencephalopathy (HIE).12,13The timing of presentation is often
⬎2 hours after birth and may be up to 3– 4 days.
MR imaging is the neuroradiologic investigation of choice for PAIS.14,15Diffusion-weighted imaging (DWI) can detect neonatal ischemic brain injury within 24 hours of its on-set,16,17with the acute changes being seen for several days. Because the initial clinical symptoms can be subtle and knowl-edge of the exact time of onset of the stroke in neonates is usually uncertain, care must be exercised in the interpretation of DWI for timing the onset of the lesion.18Literature on ra-diologic criteria for timing of PAIS onset combining conven-tional imaging and DWI is limited and includes mostly case descriptions.16,17-24We hypothesized that signal-intensity (SI) changes seen on early sequential MR imaging following PAIS should follow a time course similar to that of DWI. The aim of the study was to evaluate the time course of SI changes by using a simple classification that could be assessed visually from conventional imaging and DWI in term-born neonates with symptomatic unilateral PAIS.
Materials and Methods
Patients
The study was part of a longitudinal project documenting the evolu-tion of neonatal brain lesions of both referred infants and those born at the Hammersmith and Queen Charlotte’s Hospitals, London, UK. Data were collected between 1994 and 2004. As part of this study, all neonates who presented with seizures or other symptoms known to occur with stroke for which no other explanation was found
under-Received October 12, 2008; accepted after revision December 1.
From the Imaging Sciences Department (J.D., L.A.-N., S.J.C., M.A.R., F.M.C.) and the Department of Pediatrics (E.M., M.A.R., F.M.C.), Medical Research Council Clinical Sci-ences Centre, Imperial College London, UK; Neonatal Intensive Care Unit (J.D., P.G.), Sophia Children’s Hospital, Erasmus MC, Rotterdam, the Netherlands; and Hammersmith/ St. Mary’s Comprehensive Biomedical Research Centre (J.D., S.J.C., M.A.R., F.M.C.), London, UK.
This work was supported by the National Institute for Health Research Biomedical Research Centre Funding Scheme, Philips Medical Systems (Best, the Netherlands), the Medical Research Council, the Academy of Medical Sciences, and the Health Foundation.
Please address correspondence to: Jeroen Dudink, MD, Robert Steiner MR Unit, Imaging Sciences Department, MRC Clinical Sciences Centre, Imperial College London, Hammer-smith Campus, DuCane Rd, London W12 0HS, United Kingdom; e-mail: j.dudink@ eras-musmc.nl
Indicates open access to non-subscribers at www.ajnr.org
went neonatal brain MR imaging. Study approval was granted by the Research Ethics Committee of the Hammersmith Hospitals Trust, and parental consent was obtained for all scanning.
Only infants ofⱖ36 weeks gestation with unilateral PAIS in the territory of a main cerebral artery, with a first MR imaging within the first postnatal month, were included in this study. We also evaluated all subsequent scans up to 3 months postnatal age. Exclusion criteria were bilateral infarction seen on MR imaging, congenital infection, major brain or other malformations, multiple dysmorphic features, chromosomal abnormality, or evidence of HIE. The infarcts were classified according to the vessel territory involved.
Conventional MR Imaging and DWI
From 1994 to 1999, infants were scanned on a 1T MR imaging scanner (Picker; Cleveland, Ohio) by using conventional T1-weighted spin-echo (CSE; TR 860/TE 20 ms) and T2-weighted spin-spin-echo (SE; TR 3000/TEeff120 ms) sequences. After 1999, images were acquired on a 1.5T Eclipse system (Philips Medical Systems, Cleveland, Ohio) by using conventional CSE imaging (TR 500/TE 15 ms) and T2-weighted fast SE (TR 4500/TEeff210 ms) at 5-mm section thickness. Single-shot echo-planar DWIs were also acquired. A reference image was ob-tained with a b-value of 0, and DWIs were obob-tained with a b-value of 1000 s/mm2. For some of the early scans, only single-section DWIs including the stroke areas were obtained; in these cases, the DWI sequence used a cardiac-gated pulsed gradient SE sequence with a b-value of 600 s/mm2. The infants were usually sedated for imaging with oral chloral hydrate (30 –50 mg/kg). Pulse oximetry and electro-cardiographs were monitored throughout the procedure. Ear protec-tion was used (Natus MiniMuffs; Natus Medical, San Carlos, Calif). An experienced pediatrician, trained in MR imaging procedures, was in attendance throughout the examination.
Scoring System
For this study, images were assessed by 2 authors (J.D. and M.A.R.), and any differences were resolved by consensus. The agreement be-tween the observers before consensus was reached was high ( ⱖ0.87 for all the different assessments). The infarcts were classified accord-ing to the arterial territory involved. We used a scoraccord-ing system com-paring the SI of infarcted tissue with that of the equivalent tissue in the contralesional hemisphere as an internal control documenting the SI as higher (1), equal (0), or lower (⫺1). We evaluated the SI of the white matter and cortical gray matter; white matter⫺cortical gray matter contrast; and the delineation of the stroke borders and evi-dence of swelling, atrophy, or tissue loss (Table 1). We also evaluated the SI of the basal ganglia (caudate nucleus, putamen, and globus pallidus), the posterior limb of the internal capsule (PLIC), and the brain stem. To evaluate the DWIs, we classified the SI of the infarcted tissue into 3 groups: 1) severe hyperintensity (HI), 2) moderate and mild HI, and 3) no HI.
Statistical Analysis
We calculated the inter-rater reliability by using the Statistical Pack-age for the Social Sciences software (SPSS, Chicago, Ill).
Results
Patient Characteristics
During the study period, 28 term-born infants were diagnosed with unilateral PAIS; 7 were not included in this study because their first scan was⬎1 month after birth. We analyzed 43 conventional MR images all obtained within ⬍3 postnatal months (mean age at first scanning, 4 days) from 21 infants (Table 2). All were born after a period in labor, and none, by elective cesarean delivery: Six were born by spontaneous vag-inal delivery; 7, by forceps or vacuum extraction; and 8, by emergency cesarean delivery for fetal distress, prolonged sec-ond stage, or failed instrumental delivery. In 10 patients, a prolonged second stage of labor (ⱖ2 hours) was recorded. The infants had a median gestational age of 40 weeks (range, 38 – 42 weeks) and a median weight of 3554 g (range, 2845– 4450 g). Thirteen infants were male. All had Apgar scoresⱖ5 at 5 minutes (median, 10; range, 5–10). Median cord pH was 7.26 (range, 7.00 –7.38). All infants went to the postnatal wards initially and were later admitted to the neonatal unit. All except 1 (infant 8) had overt clinical seizures (median, day 1; range, days 1–3). Infant 8 had been born by emergency cesar-ean delivery after failed forceps and vacuum extraction at-tempts and was jittery when examined. He was initially scanned as part of a study recruiting infants from the postnatal wards rather than because of his symptoms.
Five infants had a main branch middle cerebral artery (c-MCA) territory infarction involving both hemispheric tissue and the basal ganglia. Four infants had infarction within the anterior MCA branch territory, and 9 infants, within the pos-terior MCA branch territory. Two infants had a pospos-terior ce-rebral artery (PCA) territory infarction, and 1 infant had an-terior cerebral artery (ACA) territory and anan-terior branch MCA infarctions. The lesions were left-sided in 17 patients. Fifteen infants had undergone DWI (median age at first scan-ning, 4 days; range, 2–14 days). The time intervals between sequential conventional imaging and DWI for any 1 infant are given in Table 2.
Conventional Imaging Findings
SI levels in the white matter and cortex in the regions of in-farction compared with the contralateral hemisphere on T1-and T2-weighted imaging are summarized in Figs 1 T1-and 2. On both T1- and T2-weighted images, tissue swelling of the region of infarction was seen on the first scans and this lasted until approximately day 8.
T1-Weighted Imaging
On T1-weighted images, the affected cortex was always ini-tially of low SI, changing to high SI, so-called cortical high-lighting, after day 6. Loss of cortical tissue in the areas of in-farction started to be seen from 14 days but was most marked after 1 month. The cortical highlighting remained visible until 2 months in the remaining cortex (Fig 1).
The white matter on T1-weighted images had moderately higher SI than the white matter in the contralateral
hemi-Table 1: Scoring system
Score 1 0 ⫺1
SI white matter Higher Equal Lower
SI cortex Higher Equal Lower
White matter⫺cortex contrast Increased Equal Decreased
Stroke borders Clearer Equal Lost
Swelling or atrophy Swelling Equal Atrophy
Note:—SI indicates signal intensity.
PEDIATRICS
ORIGINAL
sphere in the first 9 postnatal days, though in the first 5 days when the cortex was of low SI, this was more difficult to dis-cern because the initial visual impression was that the SI in the white matter was lower than that in the contralateral
hemi-sphere. After day 9, the SI became lower than that in the other hemisphere until about 1 month after birth when SIs became equal (Fig 2). The first appearance of tissue loss often with cyst formation in the areas of infarction was seen between 14 days and 1 month but was most marked after 1 month. The basal ganglia were clearly involved in the 5 patients with main branch MCA infarction and, in the first 4 days, were of low SI intensity on T1-weighted images; this changed to high SI from days 5 to 7. From day 7 until day 14, we saw a variegated (checkerboard) pattern.
After 1 month, tissue atrophy or cysts were seen (Fig 3). Asymmetry of the ipsilateral PLIC compared with the con-tralesional side was seen in 9 patients (infants 1, 5, 7, 10, 14, 15, and 18 –20). During the study period, a lower SI was seen in the ipsilateral PLIC. No clear visual SI changes were seen in the ipsilateral brain stem on the T1-weighted images in the time period studied. Ipsilateral peduncles became smaller in those with T2-weighted changes after 1 month. Although the thala-mus was not initially involved in the stroke of any infant, a reduction in ipsilateral thalamic size was seen in 10 (infants 1, 2, 5, 9, 10, 13, 14, 17, 18, and 20) on later scans within the first 3 postnatal months. The degree of thalamic reduction ap-peared to relate positively to the size of the original area of infarction.
T2-Weighted Imaging
[image:3.594.54.532.67.323.2]On T2-weighted images, the cortex in the region of infarction was initially of high SI but became low SI after day 6. Loss of cortical tissue in the areas of infarction was seen from day 14 and was most marked after 1 month. During the period of 1–2 months of age, there was no difference in SI compared with the contralateral side in the remaining tissue (Fig 4). The white
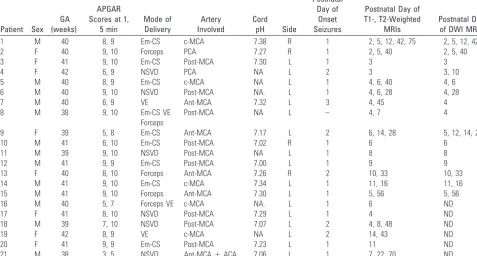
Table 2: Patient characteristics
Patient Sex GA (weeks)
APGAR Scores at 1,
5 min
Mode of Delivery
Artery Involved
Cord pH Side
Postnatal Day of
Onset Seizures
Postnatal Day of T1-, T2-Weighted
MRIs
Postnatal Day of DWI MRIs
1 M 40 8, 9 Em-CS c-MCA 7.38 R 1 2, 5, 12, 42, 75 2, 5, 12, 42
2 F 40 9, 10 Forceps PCA 7.27 R 1 2, 5, 40 2, 5, 40
3 F 41 9, 10 Em-CS Post-MCA 7.30 L 1 3 3
4 F 42 6, 9 NSVD PCA NA L 2 3 3, 10
5 M 40 8, 9 Em-CS c-MCA NA L 1 4, 6, 40 4, 6
6 M 40 9, 10 NSVD Post-MCA NA. L 1 4, 6, 28 4, 28
7 M 40 6, 9 VE Ant-MCA 7.32 L 3 4, 45 4
8 M 38 9, 10 Em-CS VE
Forceps
Post-MCA NA L – 4, 7 4
9 F 39 5, 8 Em-CS Ant-MCA 7.17 L 2 6, 14, 28 5, 12, 14, 28
10 M 41 6, 10 Em-CS Post-MCA 7.02 R 1 6 6
11 M 39 9, 10 NSVD Post-MCA NA L 1 8 8
12 M 41 9, 9 Em-CS Post-MCA 7.00 L 1 9 9
13 F 40 8, 10 Forceps Ant-MCA 7.26 R 2 10, 33 10, 33
14 M 41 9, 10 Em-CS c-MCA 7.34 L 1 11, 16 11, 16
15 M 41 9, 10 Forceps Ant-MCA 7.30 L 1 5, 56 5, 56
16 M 40 5, 7 Forceps VE c-MCA NA. L 1 6 ND
17 F 41 8, 10 NSVD Post-MCA 7.29 L 1 4 ND
18 M 39 7, 10 NSVD Post-MCA 7.07 L 2 4, 8, 48 ND
19 F 42 8, 9 VE c-MCA NA L 2 14, 43 ND
20 F 41 9, 9 Em-CS Post-MCA 7.23 L 1 11 ND
21 M 38 3, 5 NSVD Ant-MCA⫹ACA 7.06 L 1 7, 22, 70 ND
Note:—MRIs indicates MR images; GA, gestational age at birth; Em-CS, emergency cesarean delivery; NSVD, normal spontaneous vaginal delivery; VE, vacuum extraction; R, right; L, left;
DWI, diffusion-weighted imaging; c-MCA, complete middle cerebral artery; PCA, posterior cerebral artery; Post-MCA, posterior branch of middle cerebral artery; Ant-MCA, anterior branch of middle cerebral artery; ACA, anterior cerebral artery; NA, not available.
Fig 1.Graph shows the SI score (y-axis) of the infarcted cortex on T1-weighted MR images
from each postnatal day (x-axis). d indicates day; w, week; m, month.
Fig 2.Graph shows the SI score (y-axis) of the infarcted white matter (WM) on T1-weighted
[image:3.594.55.284.361.483.2] [image:3.594.54.285.522.645.2]matter was of high SI on T2-weighted images until 2–3 weeks of age (Fig 5), when the SI of the remaining tissue became isointense with the contralesional side. Tissue atrophy often with cyst formation was evident after 1 month but started between 14 days and 1 month. The basal ganglia were of high SI in the first 4 days and became low SI from day 4 until day 7. From day 7 until day 14, we saw a checkerboard pattern, and after 1 month, atrophy or cysts were seen (Fig 3). During the study period, a higher SI was seen in the ipsilateral PLIC in 9 patients compared with the contralesional PLIC, suggesting abnormal myelination. In 5 patients, we saw high SI in the
ipsilateral brain stem on the T2-weighted images in the first postnatal week. No SI differences were seen after 1 month. In 4 of these patients (infants 1, 5, 14, and 18) who had late scan-ning, ipsilateral brain stem atrophy presumed due to wallerian degeneration (a shrunken pyramidal tract at the mesence-phalic level) was seen by 1 month of age. On both the T2-weighted images and DWIs, we saw high SI in the ipsilateral thalamus in the first postnatal week. These findings suggest acute corticothalamic network injury, showing secondary changes in distant nuclei and tracts associated with primary cortical or white matter injury (Fig 6).
Cortical–White Matter Contrast and Stroke Borders The evolution of changes in stroke-border recognition and con-trast between white matter and cortex is described in Fig 7, where a composite of the scoring system for all infants is given. During the first 5 postnatal days, the infarcted cortex became increasingly isointense with white matter, increasing the definition of the mar-gins of the infarct, with the affected cortex appearing absent (the “missing cortex” sign).9Around day 6, SI in the cortex and white matter was more varied, making recognition of the stroke borders more difficult. After day 6, white matter and cortex contrast be-came sharper, rendering the borders visible. After 1 month, the combination of tissue loss (often with cysts) and slowly fading contrast between white matter and cortex made the borders again inconspicuous.
DWI Findings
The results from DWI are summarized in Fig 8. All DWIs showed high SI in the white matter until day 4 after birth. Thereafter, the SI on DWI was lower, and all SIs were equal to or below those of the contralateral hemispheres by day 12. The extent of tissue involvement was usually the same on DWI and conventional images in the first week and seemed to be equal or less on the repeated DWIs. DWI changes tended marginally to overestimate the size of the infarct at 4 – 8 weeks. In the first week, the lesional SIs on DWIs were all higher than the SIs seen on T1- and T2-weighted images, making lesion contrast most apparent on the DWIs. Increased SI was clearly seen in parts of the ipsilateral thalamus in 5 infants on DWIs.
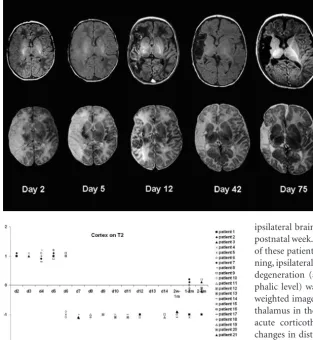
Fig 3.Images show the temporal evolution of a right-sided
main branch MCA territory infarction (patient 1) on T1-weighted images (top row) and T2-T1-weighted images (bottom row) obtained on days 2, 5, 12, 42, and 75 postdelivery.
Fig 4.Graph shows the SI score (y-axis) of the infarcted cortex on T2-weighted MR images
from each postnatal day (x-axis). d indicates day; w, week; m, month.
Fig 5.Graph shows the SI score (y-axis) of the infarcted white matter (WM) on T2-weighted
[image:4.594.51.365.44.384.2] [image:4.594.55.285.429.558.2]Discussion
Our results demonstrate that the patterns of SI change on con-ventional imaging and DWI following PAIS were consistent among infants, suggesting that PAIS in our infants who were symptomatic soon after birth occurred within a limited time-frame around birth. Insights into the natural evolution of MR imaging characteristics of neonatal stroke are important for estimating the age of a lesion, especially when the time of symptom onset can be unclear. Knowledge of neonatal stroke evolution on MR imaging can also be used to interpret the results of medical intervention strategies and for determining
optimal timing for imaging. Because, to our knowledge, the literature on radiologic timing of neonatal stroke onset in hu-mans is limited, our data add to the understanding of the evo-lution of neonatal stroke. Because changes in MR imaging parameters reflect histopathologic changes in brain tissue, we will discuss how our findings relate to the literature on the histo- and pathophysiologic evolution of arterial ischemic stroke, most of which is based on adult and animal studies.
In our patients, SI increase on DWI consistent with re-stricted diffusion was seen within the infarcted area for up to 14 days but was most marked in the first 4 days. For all of the studied infants, the first DWI showed the highest signal inten-sity consistent with a recent insult (Fig 8). After ischemic ar-terial injury, energy depletion and impaired ion homeostasis cause cytotoxic edema with restricted diffusion of water and shrinkage of the extracellular compartment, translating into a high DWI SI.25,26Postmortem studies have shown astrocytic swelling microscopically within 30 minutes after the onset of severe ischemia, and by 4 – 6 hours, swelling of oligodendro-glial nuclei and cytoplasm is seen.27DWI studies have shown changes in water diffusion within minutes after stroke in ani-mals.28Our DWI findings in the first week are consistent with those in the adult stroke literature on DWI SI evolution, in which acute ischemic lesions are characterized by very hyper-intense SI and show little change in the first 7 days after symp-tom onset but decrease in SI thereafter (Fig 9).29,30However in adult patients with stroke, the high SI is reported to last for several weeks.
DWI SI is not only influenced by water diffusibility but also by intrinsic T2 properties (T2 shinethrough) and field strength; this influence may contribute to the differences seen in DWI SI evolution between adults and neonates. The quan-titative measure of DWI is the computed apparent diffusion coefficient (ADC), which is without the influence of T2 SI. Because the visual classification of the degree of hyper-SI can be difficult, quantifiable ADC maps have been useful in deter-mining the age of ischemic lesions in several adult stud-ies.29,31,32The lowest ADC values in adult ischemic brain tis-sue seem to occur around day 3 after lesion onset and take 4 –21 days for pseudonormalization.30-32Because of our rather heterogeneous imaging datasets, we were not able to measure ADC values across the group.
Fig 6.T2-weighted images of a patient with an infarction
within the anterior MCA branch territory on day 5 (patient 15) show high SI changes within the ipsilateral thalamus (arrow, A) and the ipsilateral brain stem (arrow,B).
Fig 7.Graph shows the evolution of changes in stroke border recognition and contrast in
white matter (WM) by using a composite of the scoring system.
Fig 8.Graph shows the SI score (y-axis) of the infarcted tissue on DWIs from each
[image:5.594.54.365.45.382.2] [image:5.594.56.284.428.561.2]In the first postnatal week (from day 2), T2-weighted im-ages in our patients showed clearly increased SIs in the cortex and white matter. Once the blood-brain barrier is disrupted, vasogenic edema in combination with cytotoxic edema in-creases the overall water content in the infarcted tissue, which accounts for the prolonged T2 relaxation times, making the infarct readily visible on T2-weighted images between 24 and 48 hours after its onset.30The visual disappearance of the cor-tical ribbon in the affected area during this stage represents the so-called missing cortex sign.20Animal histology studies have shown that from 4 to 6 hours after the onset of stroke to ap-proximately 6 days, damage to the endothelium and break-down of the blood-brain barrier take place, associated with vasogenic edema and coagulation necrosis.27,28
On T1-weighted images, the affected cortex showed low SI in the first week from day 2. This SI is generally attributed to vasogenic edema. However, the white matter on T1-weighted images was of moderately higher SI than the white matter in the contralateral hemisphere in the first 9 postnatal days, though in the first 5 days when the cortex was of low SI, the overall impression was that the SI in the white matter was lower than that in the contralateral hemisphere. Whether cor-tical swelling is responsible for this appearance or whether there is actual shortening of the T1 relaxation time in white matter causing high SI on T1-weighted images during this period is unclear.
After approximately 1 week up to 1 month, we docu-mented high SI in the cortex on T1-weighted images (cortical highlighting) and low cortical SI on T2-weighted images. From postmortem studies, this time period seems to coincide with organization within the infarction, a process that involves gliosis, release of myelin lipids, microcyst formation, calcifica-tion, and ingrowth of new vessels.27,33It is an ongoing process, which, in adults, takes place from 3 days to 6 weeks. In post-mortem studies, neuronal breakdown products can be seen microscopically in macrophages after day 5 in adults.27 Ta-kana et al34 showed an increase in microglial cells, which changed to a form of lipid-laden phagocytes in rats subjected to focal brain ischemia on day 7. Aoe et al35showed a clear correlation between T1 values and the number of microglia observed by using lectin staining. However, the high protein
content and accumulation of manganese in reactive astrocytes have been suggested as being important in generating the SI changes on T1-weighted images.36
The low cortical SI on T2-weighted images is generally thought to be related to petechial hemorrhage, release of my-elin lipids, or calcification.20Around day 7, there is also evi-dence of newly formed capillaries. This neovascularization is most marked in gray matter. At the same time, the walls of the remaining blood vessels thicken.27These vascular changes will also contribute to the cortical changes seen on the conven-tional images after the first postnatal week.
The areas of infarction evolved into areas of tissue loss and cysts after 1–2 months following an intermediate variegated or checkerboard pattern of mixed high and low SI seen around 2–3 weeks.
Established wallerian degeneration of the ipsilateral corti-cospinal tract and secondary changes with reduction in size of the ipsilateral thalamus were seen in some of our patients after 1 month. These findings are in accordance with the adult and neonatal literature on secondary degeneration.37-39SI changes in the ipsilateral cortical-spinal tracts remote from the region of infarction and in the ipsilateral thalamus were seen within the first week (Fig 6).
One of the limitations of our study is the use of the healthy hemisphere as an internal control. None of the infants were considered to have contralateral lesions or pathology on visual analysis of the scans. Trans-synaptic degeneration could cause network injury affecting the contralesional hemisphere, mak-ing a case for usmak-ing healthy term controls in future studies. The visual scoring system we used is practical in a clinical setting; however, for research purposes, relatively new but more time-consuming postprocessing techniques such as automatic seg-mentation will give more objective measurements of SI and volume change.40
On the basis of the mechanisms that can lead to arterial occlusion and known perinatal risk factors, the arterial occlu-sion in our patients could have taken place during 3 periods: 1) in later labor, 2) the intrapartum period, and 3) shortly after delivery, each period reflecting different risks factors.13,20,41,42 In this study, we could not differentiate these periods. All in-fants underwent labor, none being born by prelabor cesarean
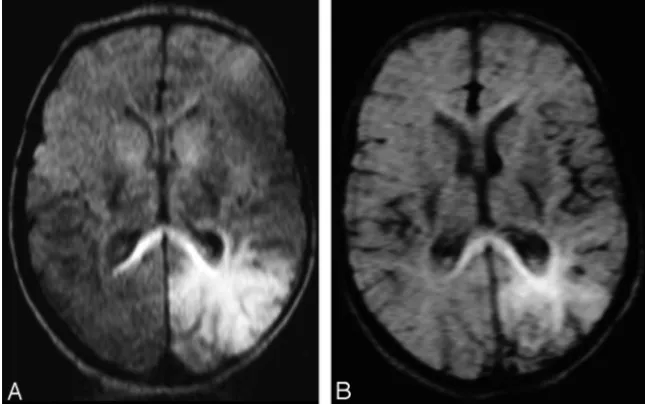
Fig 9.Graph shows DWIs of a patient with an infarction
[image:6.594.53.376.44.246.2]delivery. In most infants, labor was complicated in that deliv-ery was only spontaneous in 6 infants and the second stage of labor was prolonged (lastedⱖ2 hours) in 9 women. No fetus had had problems recorded before the onset of labor; and as is most usual for term-born infants with PAIS, none had low Apgar scores or presented with symptoms of global hypoxia-ischemia immediately after birth. Abnormal DWI SI in our patients was always most marked on the first scan, and the SI started to diminish after 4 – 6 postnatal days; extrapolating from the adult and animal literature, we believe this would support the onset of the stroke close to the time of birth. We saw consistent change in SI on DWI and conventional images in the first week, with the infarct always being seen even on T1-weighted images on the first scan, suggesting that the in-farcts had occurred at least 1–2 days before the first imaging. This further supports the interpretation of our data to indicate that the stroke occurred within a limited timeframe around or during delivery.
Future interventional studies and medicolegal issues will require an even more detailed study of the temporal evolution of PAIS. Prospective studies with serial scanning (including quantitative diffusion tensor imaging) in combination with continuous electroencephalography monitoring and detailed clinical histories might provide this.
Conclusions
The pattern of SI change on conventional images and DWIs following PAIS was remarkably consistent among patients, suggesting that PAIS in symptomatic term-born infants oc-curs close to the time of birth.
Acknowledgments
We thank the nursing, medical, and radiographic staff mem-bers who were involved in scanning, the parents who con-sented for their children to take part in the studies, and the consultant colleagues who referred infants.
References
1. Sreenan C, Bhargava R, Robertson CM.Cerebral infarction in the term newborn: clinical presentation and long-term outcome. J Pediatr
2000;137:351–55
2. Mercuri E, Barnett A, Rutherford M, et al.Neonatal cerebral infarction and neuromotor outcome at school age.Pediatrics2004;113:95–100
3. Wu YW, Lynch JK, Neslon KB.Perinatal arterial stroke: understanding mech-anisms and outcomes.Semin Neurol2005;424 –34
4. Kirton A, deVeber G.Cerebral palsy secondary to perinatal ischemic stroke.
Clin Perinatol2006;33:367– 86
5. Wulfeck BB, Trauner DA, Tallal PA.Neurologic, cognitive, and linguistic fea-tures of infants after early stroke.Pediatr Neurol1991;7:266 – 69
6. Trauner DA, Chase C, Walker P, et al.Neurologic profiles of infants and chil-dren after perinatal stroke.Pediatr Neurol1993;9:383– 86
7. Lynch JK, Nelson KB.Epidemiology of perinatal stroke.Curr Opin Pediatr
2001;13:499 –505
8. Mercuri E, Rutherford M, Cowan F, et al.Early prognostic indicators of out-come in infants with neonatal cerebral infarction: a clinical, electroencepha-logram, and magnetic resonance imaging study.Pediatrics1999;103:39 – 46 9. Filipek PA, Krishnamoorthy KS, Davis KR, et al.Focal cerebral infarction in the
newborn: a distinct entity.Pediatr Neurol1987;3:141– 47
10. Levy SR, Abroms IF, Marshall PC, et al.Seizures and cerebral infarction in the full-term newborn.Ann Neurol1985;17:366 –70
11. Fujimoto S, Yokochi K, Togari H, et al.Neonatal cerebral infarction: symp-toms, CT findings and prognosis.Brain Dev1992;14:48 –52
12. Cowan F, Rutherford M, Groenendaal F, et al.Origin and timing of brain lesions in term infants with neonatal encephalopathy.Lancet 2003;361: 736 – 42
13. Ramaswamy V, Miller SP, Barkovich AJ, et al.Perinatal stroke in term infants with neonatal encephalopathy.Neurology2004;62:2088 –91
14. Cowan F, Mercuri E, Groenendaal F, et al.Does cranial ultrasound imaging identify arterial cerebral infarction in term neonates?Arch Dis Child Fetal Neonatal Ed2005;90:F252–56
15. Obernaus A, Ashwal S.Magnetic resonance imaging in cerebral ischemia: fo-cus on neonates.Neuropharmacology2008;55:271– 80. Epub 2008 Jun 14 16. Mercuri E, Cowan F, Rutherford M, et al.Ischaemic and haemorrhagic brain
lesions in newborns with seizures and normal Apgar scores.Arch Dis Child Fetal Neonatal Ed1995;73:67–74
17. Ku¨ker W, Mo¨hrle S, Mader I, et al.MRI for the management of neonatal cere-bral infarctions: importance of timing.Childs Nerv Syst2004;20:742– 48 18. Mader I, Schoning M, Klose U, et al.Neonatal cerebral infarction diagnosed by
diffusion-weighted MRI: pseudonormalization occurs early.Stroke2002;33: 1142– 45
19. Rutherford MA.MRI of the Neonatal Brain.Edinburgh, UK: W.B. Saunders; 2002
20. Barkovich A.Pediatric Neuroimaging.Philadelphia: Lippincott Williams & Wilkins; 2005
21. Cowan FM, Pennock JM, Hanrahan JD, et al.Early detection of cerebral infarc-tion and hypoxic ischemic encephalopathy in neonates using diffusion-weighted magnetic resonance imaging.Neuropediatrics1994;25:172–75 22. Robertson RL, Ben-Sira L, Barnes PD, et al.MR line-scan diffusion-weighted
imaging of term neonates with perinatal brain ischemia.AJNR Am J Neurora-diol1999;20:1658 –70
23. Robertson RL, Glasier CM.Diffusion-weighted imaging of the brain in infants and children.Pediatr Radiol2007;37:749 – 68
24. Krishnamoorthy KS, Soman TB, Takeoka M, et al.Diffusion-weighted imaging in neonatal cerebral infarction: clinical utility and follow-up.J Child Neurol
2000;15:592– 602
25. Barber PA, Hoyte L, Kirk D, et al.Early T1- and T2-weighted MRI signatures of transient and permanent middle cerebral artery occlusion in an murine stroke model studied at 9.4T.Neurosci Lett2005;388:54 –59
26. Qiao M, Malisza KL, Del Bigio MR, et al.Transient hypoxia-ischemia in rats: changes in diffusion-sensitive MR imaging findings, extracellular space, and Naⴙ-Kⴙ-adenosine triphosphatase and cytochrome oxidase activity. Radi-ology2002;233:65–75
27. Graham DI, Lantos PL, eds.Greenfield’s Neuropathology.7th ed. London, UK: Arnold; 2002
28. Neumann-Haefelin T, Kastrup A, de Crespiqny A, et al.Serial MRI after tran-sient focal cerebral ischemia in rats: dynamics of tissue injury, blood-brain barrier damage, and edema formation.Stroke2000;31:1965–72
29. Fiebach JB, Jansen O, Schellinger PD, et al.Serial analysis of the apparent diffusion coefficient time course in human stroke.Neuroradiology2002;44: 294 –98
30. Lansberg MG, O’Brien MW, Tong DC, et al.Evolution of cerebral infarct vol-ume assessed by diffusion-weighted magnetic resonance imaging.Arch Neurol
2001;58:613–17
31. Schlaug G, Siewert B, Benfield A, et al.Time course of the apparent diffusion (ADC) abnormality in human stroke.Neurology1997;49:113–19
32. Lutsep HL, Albers GW, DeCrespigny A, et al.Clinical utility of diffusion-weighted magnetic resonance imaging in the assessment of ischemic stroke.
Ann Neurol1997;41:574 – 80
33. Stoll G, Jander S, Schroeter M.Inflammation and glial responses in ischemic brain lesions.Prog Neurobiol1998;56:149 –71
34. Takana R, Komine-Kobayashi M, Mochizuki H, et al.Migration of enhanced green fluorescent expressing bone marrow-derived microglia/macrophage into the mouse brain following permanent focal ischemia.Neuroscience
2003;117:531–39
35. Aoe H, Takeda Y, Kawahara H, et al.Clinical significance of T1-weighted MR images following transient cerebral ischemia.J Neurol Sci2006;241:19 –24 36. Shan DE, Pan HC, Ho DM, et al.Presence of activated microglia in a high
signal lesion on T1-weighted MR images: a biopsy sample re-examined.AJNR Am J Neuroradiol2007;28:602
37. Heiss WD, Sobesky J, Hesselmann V.Identifying thresholds for penumbra and irreversible tissue damage.Stroke2004;35:2671–74
38. Govaert P, Zingman A, Jung YH, et al.Network injury to pulvinar with neona-tal arterial ischemic stroke.Neuroimage2008;39:1850 –57
39. Groenendaal F, Benders MJ, de Vries LS.Pre-wallerian degeneration in the neonatal brain following perinatal cerebral hypoxia-ischemia demonstrated with MRI.Semin Perinatol2006;30:146 –50
40. Jacobs MA, Knight RA, Soltanian-Zadeh H, et al.Unsupervised segmentation of multiparameter MRI in experimental cerebral ischemia with comparison to T2, diffusion, and ADC parameters and histopathological validation.J Magn Reson Imaging2000;11:425–37
41. Ment LR, Duncan CC, Ehrenkranz RA.Perinatal cerebral infarction.Ann Neu-rol1984;16:559 – 68