http://www.scirp.org/journal/jcc ISSN Online: 2327-5227
ISSN Print: 2327-5219
DOI: 10.4236/jcc.2018.61008 Dec. 29, 2017 74 Journal of Computer and Communications
Individual Identification Using ECG Signals
Mohamad O. Diab, Alaa Seif, Mohamad El-Abed, Maher Sabbah
Rafik Hariri University (RHU), Mechref, Lebanon
Abstract
The electrocardiogram (ECG) signal used for diagnosis and patient monitor-ing, has recently emerged as a biometric recognition tool. Indeed, ECG signal changes from one person to another according to health status, heart geome-try and anatomy among other factors. This paper forms a comparative study between different identification techniques and their performances. Previous works in this field referred to methodologies implementing either set of fidu-cial or set non-fidufidu-cial features. In this study we show a comparison of the same data using a fiducial feature set and a non-fiducial feature set based on statistical calculation of wavelet coefficient. High identification rates were measured in both cases, non-fiducial using Discrete Meyer (dmey) wavelet outperformed the rest at 98.65.
Keywords
Biometrics, ECG Signals, Fiducial Features,
Discrete Wavelet Transform (DWT), Multilayer Perceptron (MLP)
1. Introduction
Biometric recognition systems identify or verify individuals according to unique physiological or behavioral characteristics. Physiological characteristics are based on intrinsic morphological qualities such as fingerprint, face and iris rec-ognition [1]. Behavioral characteristics are based on learnt qualities such as sig-natures, gait analysis and keystroke dynamics [1]. A major drawback for the use of physiological characteristics is the ability of copying by intruders. For example fingerprints could be lifted and masked into an artificial print. Even though phy-siological characteristics are more unique than behavioral characteristics, there is a possibility of falsification. Therefore there is a need of physiological characte-ristic that cannot be falsified or captured. ECG signals fulfill this need as they are confidential for each individual and cannot be lifted for masking [2]. Moreover
How to cite this paper: Diab, M.O., Seif, A., El-Abed, M. and Sabbah, M. (2018) Individual Identification Using ECG Sig-nals. Journal of Computer and Communi-cations, 6, 74-80.
https://doi.org/10.4236/jcc.2018.61008
DOI: 10.4236/jcc.2018.61008 75 Journal of Computer and Communications ECG biometrics detects the aliveness of the individual while verifying. All the other biometric requirements are fulfilled. Those are: the universality, the uni-queness, the collectability, the permanence and the circumvention of the cha-racteristics.
The objective of this paper is to compare the identification rate between two feature extraction methodologies. The outline of this paper is defined as follows. In Section 2, a literature review of the previous work is presented. In Section 3, the methodology is explained. In Section 4, the results are displayed and dis-cussed. Finally Section 5 concludes with the future perspective.
2. Literature Review
Biel et al. pioneered in the field of ECG biometric and proved that lead Iis suffi-cient for individual recognition [1]. The extracted feature sets could either be fiducial features based or non-fiducial features based. The advantage of using non-fiducial features over the fiducial is less computation time, even though their performance is comparable.
Fiducial features are based on characteristic peaks of the ECG signal. The de-tection of the peaks is due to maxima or minima points in a window. The fidu-cial features are based on angle, amplitude and time interval (R-R) peaks. Dif-ferent algorithms could be applied to detect the peaks which could lead to in-consistency between different studies. Palaniappan et al. [3] used only 6 fiducial features and obtained identification performance of 97.6% when tested onten different subjects. Gahi et al. [4] extracted a larger feature set of 24 fiducial fea-tures to obtain 100% identification rate on a sample of 16 subjects. The increase of fiducial features improves the performance but increases computational time. Israel et al. [5] compromised between performance and feature set size. They used a feature set of 15 fiducial features to obtain 98% identification rate on a sample of 29 subjects.
The non-fiducial based approaches detect either only QRS peaks or no peaks at all. they could be either model based approaches or transform based ones[3]. Agrafioti et al. [6] demonstrate an autocorrelation based feature extraction ap-proach, in conjunction with the Discrete Cosine Transform and obtained rate of 92.3% in a sample size of 52. Wan et al. [7] applied discrete wavelet transform and extracted features corresponding to wavelet coefficient. This resulted in identification rate of 10% for a sample of 15 subjects.
3. Methodology
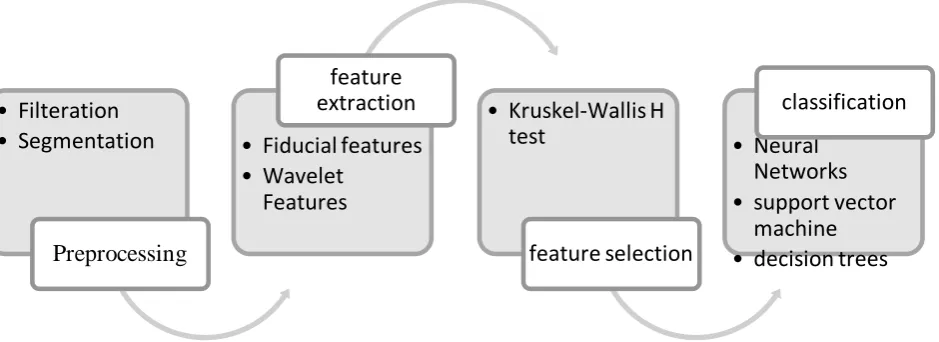
The methodology is composed of three parts: 1) preprocessing, 2) feature extrac-tion and selecextrac-tion, and 3) classificaextrac-tion, the block diagram linking the process’s different phases and stages is illustrated in Figure 1.
3.1. Preprocessing
DOI: 10.4236/jcc.2018.61008 76 Journal of Computer and Communications
Figure 1. Flow chart showing methodology used.
The ten seconds ECG recordings are filtered before any further processing, in order to remove undesired components of power line interference, muscle noise and baseline wander. the filter consisted of a 3rd order Butterworth low pass fil-ter with 3 dB cut-off at 15 Hz allowing elimination of 50 Hz power line infil-terfe- interfe-rence and high frequency interfeinterfe-rences using a 3rd order Baseline wander is due to subject movement, perspiration or chest hair [8]. This type of noise has a very low frequency range. Therefore to remove it, the baseline noise is extracted. This is done using a 3rd order low-pass Butterworth digital filter with cut-off at 5 Hz. When the baseline is detected, the clean signal is obtained by deducting the baseline signal from the original signal [9].
3.2. Feature Extraction
Fiducial feature sets are calculated from peaks detected during ECG sequence. The non-fiducial feature sets are calculated from the entire beat or recording.. Some methodologies require the detection of only the R-peaks. In this paper both forms of feature extraction methodologies are tested using Matlab.
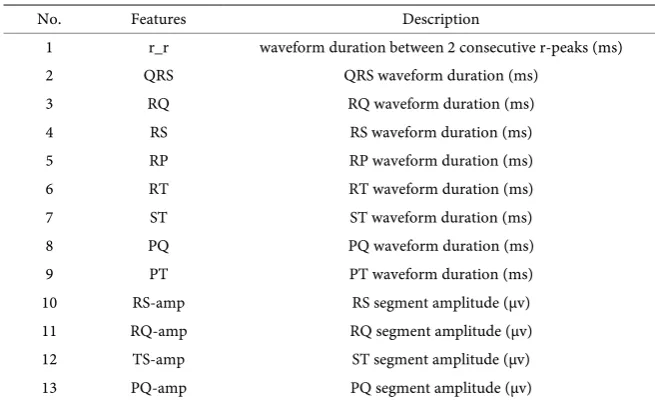
The fiducial feature set is obtained by calculating 13 different features from 5 different heart beats. The selected beats should not be the first or the last beats in the recording to ensure that all selected beats are complete beats. Nine duration features and four amplitude features were extracted into the feature vector. Ta-ble 1 summaries the fiducial features extracted from the ECG recordings
Firstly, Pan Tompkin’s algorithm [10] was implemented for detection of R peaks. The R-peaks are detected using a differential filter and squaring of the signal. Two sets of thresholds are used. The first one is being applied to the fil-tered signal while the second one is used for the signal resulting from the mov-ing window. After applymov-ing the adaptive threshold on the filtered signal the R-peaks are detected [8]. The other ECG peaks (P-QRS-T) peaks were detected by windowing of the signal around the R-peaks. The Q peak was detected as the first downward deflection trough by tracing back 50 ms from R peak. In addi-tion, S peak was detected as the first upward deflection peak by tracing forward
• Filteration
• Segmentation
Preprocessing
• Fiducial features
• Wavelet
Features
feature
extraction
• Kruskel-Wallis H
test
feature selection
• Neural
Networks
• support vector
machine
• decision trees
DOI: 10.4236/jcc.2018.61008 77 Journal of Computer and Communications
Table 1. Fiducial features extracted.
No. Features Description
1 r_r waveform duration between 2 consecutive r-peaks (ms)
2 QRS QRS waveform duration (ms)
3 RQ RQ waveform duration (ms)
4 RS RS waveform duration (ms)
5 RP RP waveform duration (ms)
6 RT RT waveform duration (ms)
7 ST ST waveform duration (ms)
8 PQ PQ waveform duration (ms)
9 PT PT waveform duration (ms)
10 RS-amp RS segment amplitude (μv)
11 RQ-amp RQ segment amplitude (μv)
12 TS-amp ST segment amplitude (μv)
13 PQ-amp PQ segment amplitude (μv)
50 ms from R peak. The features like R amplitude, QR amplitude and RS am-plitude were computed. R-R interval was obtained from two consecutive beats.
The second feature extraction technique is performed using non-fiducial transform based set. In such case, no peak detection is required. The use of dis-crete wavelet transform (DWT) in biomedical signal analysis increased greatly due to its ability to analyze non-stationary signals in frequency domain and time domain. The decomposition of the signal in both domains provides information in low and high frequencies for short and long time intervals. The frequencies in ECG signal vary with time therefore applying Fourier transform does not pro-vide all the information in the signal. The DWT decomposes the signal into ap-proximations and details through a series of cascading low pass and high pass filters, respectively. The approximations are further decomposed. The decompo-sition level chosen based on the dominant frequency components of the signal and it is limited by the length of the signal. In our work the signal was decom-posed to level 6. The two approaches behind the choice of a certain mother wavelet are either theoretically by the similarity of the signal to the mother wavelet or experimentally by testing the performance of different mother wave-lets on the signal. The similarity could be quantified using either signal energy or entropy. In this work we looked into mother wavelets that have high energy and/or low entropy with respect to the ECG signal. Then their performance was tested to ensure the highest identification rate is being reached.
The tested mother wavelets are: o Daubechies 2 (db2)
o Haar
o Biorthogonal 6.8 (bior6.8)
o Symlets 5 (sym5)
o Coiflets 5 (coif)
DOI: 10.4236/jcc.2018.61008 78 Journal of Computer and Communications Statistical features over coefficients of the details and the approximation were calculated to decrease the dimensionality of the wavelet feature vector. Those statistical features formed the feature set used for the classification. The follow-ing features were used to represent the time frequency distribution of the ECG signal:
o Absolute mean of the coefficients in each sub-band
o Average power of the coefficients in each sub-band
o Standard deviation of the coefficients in each sub-band
For feature selection, Kruskel-Wallis H test was applied on both feature sets, the fiducial feature set and the non-fiducial feature set. It ensures that features show inter-subject variability and intra-subject stability. The Kruskel-Wallis H test is a rank-based nonparametric test that can be used to determine if there are statistically significant differences between two or more groups of an indepen-dent variable on a continuous or ordinal depenindepen-dent variable. The Kruskel-Wallis H test was performed on IBM SPSS Statistics.
3.3. Classification
In our work, we attempted to further investigate classifiers that are not the most frequently used in ECG biometrics. Neural network classifiers are used for their extensive ability to learn complex relationships between feature vectors. Each artificial neuron is itself a classifier, only a simpler one whose accuracy in prin-ciple has limitations when used for complex problems therefore they are con-nected to form a network. A single artificial neuron is perceptron or a logistic regression unit. Simply an artificial neuron accepts a number of inputs that col-lectively describe an item to be classified and outputs the class it believes the item belongs to. The neurons are organized in a form of layers. Its input layer consists of a number of ANs that depends on the number of input features while the output layer consists of a number of ANs equal to the number of classes. In between the input and output layers consists several hidden layers as shown in Figure 2. Classification for both feature sets was performed using the Machine learning software Weka [11].
4. Experimental Results
The methodology is tested on a publicly available database. Physikalisch-Tech- nische Bundesanstalt (PTB) database is provided by the National Metrology In-stitute of Germany [12]. It contains recordings for 52 healthy female and male subjects of age ranging from 17 to 57. Each signal is digitized at 1000 samples per second, with 16 bit resolution over a range of ±16.384 mV. Each record in-cludes the 12 leads but our work is tested on only lead 1.
DOI: 10.4236/jcc.2018.61008 79 Journal of Computer and Communications
Figure 2. Decomposition of neural network Multilayer preceptron.
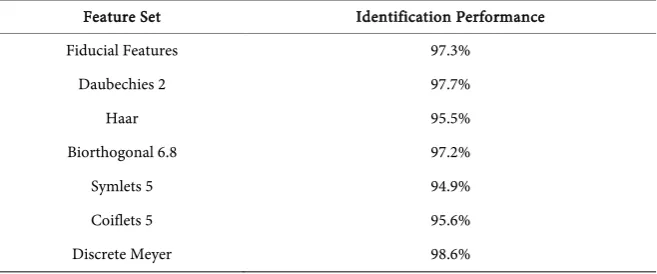
Table 2. Identification performance.
Feature Set Identification Performance
Fiducial Features 97.3%
Daubechies 2 97.7%
Haar 95.5%
Biorthogonal 6.8 97.2%
Symlets 5 94.9%
Coiflets 5 95.6%
Discrete Meyer 98.6%
perceptron was applied using 10-fold cross-validation. The identification rates obtained using both approaches are high showing a great promise in the use of ECG for biometrics. The non-fiducial approach using Discrete Meyer mother wavelet outperformed all the other mother wavelets.
5. Conclusion and Perspective
[image:6.595.210.539.289.426.2]me-DOI: 10.4236/jcc.2018.61008 80 Journal of Computer and Communications thodologies should be tested on a database of subjects with a range of cardiac disorders to ensure its inclusivity.
References
[1] Biel, L., Pettersson, O., Philipson, L. and Wide, P. (2001) ECG Analysis: A New Ap-proach in Human Identification. IEEE Transactions on Instrumentation and Mea-surement, 50, 808-812. https://doi.org/10.1109/19.930458
[2] Belgacem, N. and Bereksi-Reguig, F. (2012) Person Identification System Based on Electrocardiogram Signal Using LabView. International Journal on Computer Science and Engineering (IJCSE) Person, 4, 974-981.
[3] Palaniappan, R. and Krishnan, S.M. (2004) Identifying Individuals Using ECG Beats. International Conference on Signal Processing and Communications,
SPCOM’04, 569-572. https://doi.org/10.1109/SPCOM.2004.1458524
[4] Gahi, Y., Lamrani, M., Zoglat, A., Guennoun, M., Kapralos, B. and El-Khatib, K. (2008) Biometric Identification System Based on Electrocardiogram Data. New Technologies, Mobility and Security, 1-4.
https://doi.org/10.1109/NTMS.2008.ECP.29
[5] Israela, S., Irvineb, J., Chengb, A., Wiederholdc, M. and Wiederholdd, B. (2004) ECG to Identify Individuals. Pattern Recognition Society, 38, 133-142.
https://doi.org/10.1016/j.patcog.2004.05.014
[6] Agrafioti, F. and Hatzinakos, D. (2010) Signal Validation for Cardiac Biometrics. 2010 IEEE International Conference on Acoustics Speech and Signal Processing
(ICASSP), 1734-1737. https://doi.org/10.1109/ICASSP.2010.5495461
[7] Wan, Y. and Yao, J. (2008) A Neural Network to Identify Human Subjects with Electrocardiogram Signals. Proceedings of the Worlds Congress on Engineering and Computer Science, San Francisco.
[8] Wang, Y., Agrafioti, F., Hatzinakos, D. and Plataniotis, K. (2008) Analysis of Hu-man Electrocardiogram for Biometric Recognition. EURASIP Journal on Advances in Signal Processing.
[9] Palaniappan, R. and Krishnan, S.M. (2004) Identifying Individuals Using ECG Beats. Int. Conference on Signal Processing and Communications, SPCOM’04, 569-572. https://doi.org/10.1109/SPCOM.2004.1458524
[10] Pan, J. and Tompkins, W. (1985) A Real-Time QRS Detection Algorithm. IEEE Transactions on Biomedical Engineering, 32, 230-236.
[11] Data Mining: Practical Machine Learning Tools and Techniques.
http://www.cs.waikato.ac.nz/ml/weka/book.html
[12] “The PTB Diagnostic ECG Database”, Physionet.org, 2017.