Investigation of Crystallization Kinetics in Glassy Se and
Binary Se
98
M
2
(M = Ag, Cd, Zn) Alloys Using DSC
Technique in Non-Isothermal Mode
Chandrabhan Dohare, Neeraj Mehta*
Department of Physics, Glass Science Laboratory, Banaras Hindu University, Varanasi, India. Email: *[email protected]
Received July 11th, 2012; revised August 16th, 2012; accepted September 7th, 2012
ABSTRACT
The crystallization kinetics of glassy Se and binary Se98M2 (M = Ag, Cd, Zn) alloys have been studied at different heat-
ing rates (5, 10, 15, 20 K·min–1) using Differential Scanning Calorimetric (DSC) technique. The crystallization tem-
perature (Tc) is determined from exothermic peak obtained in DSC scans of present samples. The variation in peak
crystallization temperature (Tc) with the heating rate (β) has been used to investigate the growth kinetics using Kissinger,
Augis-Bennet and Matusita-Sakka models. The activation energy of crystallization (Ec) has been found to increase with
Ag additive and to decrease with Zn and Cd additive. The value of various kinetic parameters such as rate constant (Kp),
Avrami index (n), thermal stability (S) and Hruby number (Hr) have been calculated under non-isothermal mode. The
maximum change in different kinetic parameters has been found after the incorporation of Ag additive.
Keywords: Differential Scanning Calorimetry; Crystallization Kinetics; Chalcogenide Glasses
1. Introduction
Thermal analysis of chalcogenide glasses in term of cry- stallization kinetics is of particular interest from funda- mental and applications point of views. Chalcogenide glasses have good infrared transparency, high refractive index and low optical loss, so the possible application of these glasses are in optical wave guide, infrared optical fibres, chemical sensors, bio-sensor, photoreceptors in copying machines and X-ray imaging plates, I.R. optical lenses, windows and high sensitivity ionic sensors [1-6]. Crystallization kinetics is an important study in the amorphous as well as glassy solids. The thermal stability and the dynamics of crystallization process can be de- termined by formulism of crystallization kinetics. The crystallization kinetics depend on various parameters; such as the mode of crystallization, the number of qu- enched nuclei, the activation energy of diffusion and also the difference in free energy between the amorphous and possible crystalline phases [7-10].
The reason of selection of glassy Se based chalco- genide alloys in the present study are the fact that these material exhibits reversible phase transformation which has a wide range of application in memory and data storage devices. The phase transformations of chalco- genide glasses in binary and ternary systems have been
widely studied by nonisothermal technique, because of their usage in numerous applications in semiconductor technology [1-6].
The effect of various metallic additives on the differ- ent physical properties such as thermally activated d.c. conduction and a.c. conduction, glass transition and cry- stallization kinetics of glassy Se has been studied by various workers by changing the composition but fewer studies have been reported by changing the additives. The effect of incorporation of Ag, Zn and Cd on the glass forming ability, hardness and kinetics of crystallization of the binary system SSe20 has been studied by El-Den
[11]. He found that there is an increase in the value of the hardness after incorporation of the added metals. He ex- plained this result in terms of increase in the strength of chemical bonds in ternary alloys. Singh et al. [12] re- ported the d.c. conductivity measurements at high elec- tric fields in vacuum-evaporated thin films of amorphous Se80Te20, Se75Te20Ge5 and Se75Te20Sb5 systems. From
analysis of the experimental data they confirmed the presence of space charge limited conduction (SCLC) in all the glassy materials. They observed an increase in density of defect states (DOS) in case of Sb and a de- crease in (DOS) for Ge. The change in DOS on impurity incorporation is explained in terms of the change in structure of these glasses.
conductivity has been reported by Khan et al. in thin films of glassy Se95M5 (where M = Ga, Sb, Bi) in order to
identify the conduction mechanism and to observe the doping effect of different metals on amorphous selenium [13]. They found that the conduction in high temperature range (314 - 375 K) is due to thermally activated tunnel- ling of charge carriers in the band tails of localized states; and in the low temperature range (219 - 314 K) conduc- tion takes place through variable range hopping in the localized states near the Fermi level. They also reported the existence of space charge limited conduction (SCLC) in these glassy alloys. Sharma and Kumar studied the influence of additives (Sb and Ag) on a.c. conductivity and dielectric properties of glassy Se70Te30 alloy [14].
Their experimental results indicate that a.c. conductivity and dielectric parameters depend on temperature, fre- quency and the impurity incorporated in Se-Te glassy system. They found that the Ag and Sb additive have opposite influence in the dielectric parameters when they incorporated at cost of Te. The results obtained by them are being correlated by the nature of covalent character of the studied composition and with the change in density of defect states.
These days, our laboratory is also engaged in this paticular direction to find some fruitful results from the significant and remarkable problem of “Metal-induced Effects”. Recently, Dohare et al. [15] have observed the effect of additives on the crystallization kinetics of Se70Te30 with the same composition of additives as a
chemical modifier. In the present work, investigation on the crystallization kinetics of the glassy Se and glassy Se98M2 (M = Ag, Zn, Cd) alloys were carried out by
means of non-isothermal DSC measurements.
2. Material Preparation
Glassy Se and Se98M2 (M = Ag, Zn, Cd) alloys were
prepared by quenching technique. The accurate propor- tion of high purity 5N (99.999%) elements, in agreement with their atomic percentages, were weighed using an electronic balance with the least count of 0.1 mg. The materials were then sealed in evacuated (~10–5 Torr)
quartz ampoules (length ~ 5 cm and internal diameter ~ 8 mm). Each ampoule was kept inside the furnace at 800˚C (where the temperature was raised at a rate of 3˚C/min - 4˚C/min). During heating, all the ampoules were continu- ously rocked, by revolving a ceramic rod to which the ampoules were tucked away in the furnace for obtaining homogeneous glassy alloys.
After rocking for about 12 hours, the obtained melts were cooled rapidly by removing the ampoules from the furnace and dipping in ice-cooled water rapidly. The in- gots of the samples were then taken out by breaking the
quartz ampoules.
3. Experimental
The confirmation of glassy phase of as prepared samples was done by using XRD technique. X-ray diffractometer (Simadzu PW1710, Japan) with CuKα radiation (λ =
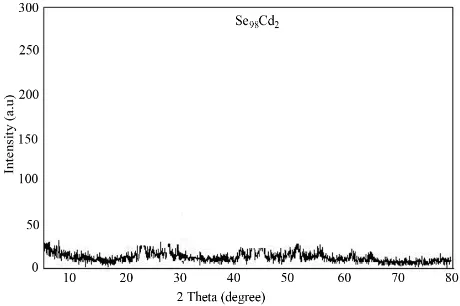
1.5405 Å) was used for this purpose. The X-ray tube voltage and current were 30 kV and 20 mA, respectively. The scan range was 5˚ - 80˚ (2θ) and the scan speed was 1˚/min. The XRD pattern of as-prepared sample of glassy Se98Cd2 alloy is shown in Figure 1. The glassy nature of
other samples (Se, Se98Ag2 and Se98Zn2) alloys was also
confirmed by XRD technique.
The glasses, thus prepared, were ground to make fine powder for DSC studies (flow type). 10 mg to 20 mg of the powder was heated at constant heating rate and the changes in heat flow with respect to an empty reference pan were measured. The thermal behaviour was investi- gated using differential scanning calorimeter. The tem- perature precision of this equipment is 0.1 K with an average standard error of about 1 K in the measured values.
4. Results
Measurements were made under almost identical condi-tions at four different heating rates 5, 10, 15 and 20 Kmin–1 so that a comparison of various kinetic parame-
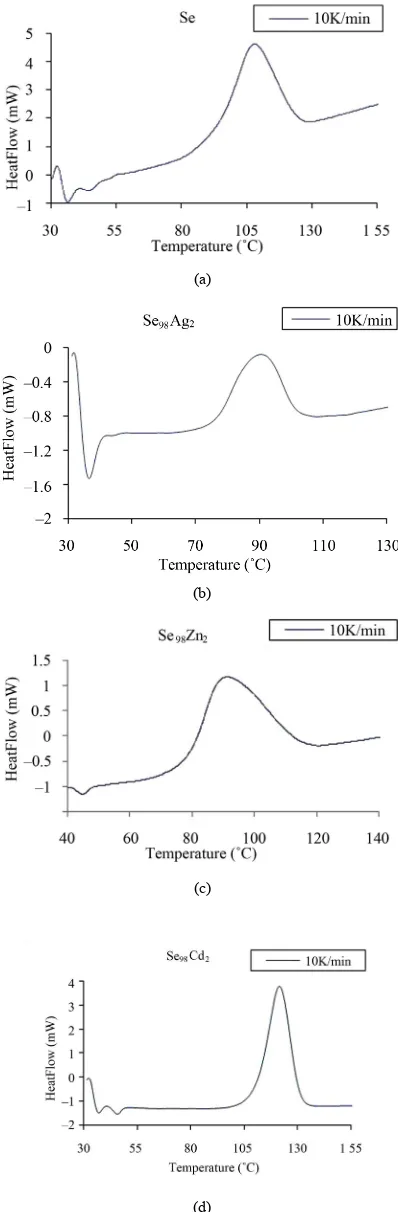
ters of crystallization could be made in order to under- stand the effect of Ag, Cd and Zn element in binary Se98M2 alloy. Figure 2 shows typical DSC scans at heat-
ing rate of 10 K/min for glassy Se and Se98M2 (M = Ag,
Zn, Cd) alloys. Each DSC scan showed a well defined exothermic peak at the crystallization temperature Tc.
[image:2.595.307.537.562.715.2]From Figure 2, it is also clear that all the chalcogenide glasses characterized in the present study show a single glass transition endothermic peak and a single exother- mic crystallization peak. The single endothermic glass
(a)
(b)
(c)
(d)
Figure 2. (a)-(d) DSC scans at a heating rate 10 K/min for glassy Se and binary Se98M2 (M = Ag, Cd, Zn) alloys.
transition peaks at Tg and single exothermic crystalliza-
tion peaks at Tc indicates the homogeneity of these
glasses. This is an essential requirement of phase change optical recording materials. Similar scans were obtained for the other heating rates.
From the data of experiments, various kinetic parame-ters (Tc, Ec, n, S, Hr, Hs and KP) have been determined.
4.1. Experimental Evaluation of Crystallization Temperature (Tc)
In a DSC scan, the crystallization temperature is exhib- ited as a temperature corresponding to an exothermic peak due to a sudden change in specific heat. The values of Tc are given in Table 1. From this table, we notice a
systematic shift in Tc to higher temperatures with an
in-crease in the heating rate β.
It is clear from Table 1 that Tc of binary alloy is de-
creased after the incorporation of Ag and Zn but in- crease with Cd additive. It is well known that the crys- tallization temperature is associated with the nucleation and growth process that dominates the devitrification of most glassy solids. Glassy Se contains long polymeric chains and eight member rings in various proportions as its structural units, which are dissociated by the addition of Ag, Cd and Zn in glassy Se. Thus, the incorporation of Ag, Cd and Zn additives in glassy Se affects the nuclea- tion and growth rate by cross-linking the long polymeric chains and eight member rings. This is probably the rea- son of change in the crystallization temperature of binary alloys at comparatively lower crystallization tempera- tures.
4.2. Estimation of Activation Energy of Crystallization (Ec)
The crystallization kinetics of amorphous alloys has been extensively studied in past using the classical Johnson- Mehl-Avrami (JMA) theoretical model [16-18]in which the crystallization fraction () can be described as a function of time (t) according to the formula:
( ) 1 expt ( )n
[image:3.595.71.270.100.706.2] Kt (1) Here, n is the Avrami index and, K is the rate constant
Table 1.Peak crystallization temperature of glassy Se and binary Se98M2 (M = Ag, Cd, Zn) alloys at different heating rates.
Se Se98Ag2 Se98Cd2 Se98Zn2
Heating rate
(K/min) Tc(K)
5 371.4 355.7 385.6 359.3
[image:3.595.311.537.657.734.2]which is given by:
0exp c E K K RT
(2)
where, Ec is the activation energy of crystallization, R is
the universal gas constant and Kois the pre-exponential
factor of rate constant.
According to Kissinger [19], peak temperature of crystallization Tcin terms of the heating rate β, can be
expressed as:
2
ln c constant
c c E RT T
(3)
In this equation, the slope (−Ec/R) of the straight line
for the plot of ln
2c
T
vs 1000/Tc is used to calculatethe activation energy of crystallization.
The extent of crystallization (α) at a temperature, T is expressed as follows:
1ln 1 c
n nE C RT
[image:4.595.307.538.517.605.2] (4) The above expression is derived by Matusita and Sakka [20,21]from the classical JMA equation. Since the value of α, is independent of β at T = Tc [22], so at T = Tc, the
Equation (4) takes the form:
ln c constant
c
E RT
(5)
In this equation, the slope (−Ec/R) of the straight line for
the plot of ln(β) vs 1000/Tc is used to calculate the ac-
tivation energy of crystallization.
The activation energy of crystallization Ec can also be
determined by an approximation method developed by Augis and Bennett [23]. The relation used by them is of the form:
0
ln c ln
c c E K T RT
(6)
The activation energy of crystallization has been evaluated by this equation using the plots of ln(β/Tc)
against 1000/Tc. This method has an extra advantage that
the intercept of ln(β/Tc)versus 1000/Tc gives the value of
pre-exponential factor K0 (Equation (2)). The activation energy of crystallization for glassy Se and Se98M2 (M =
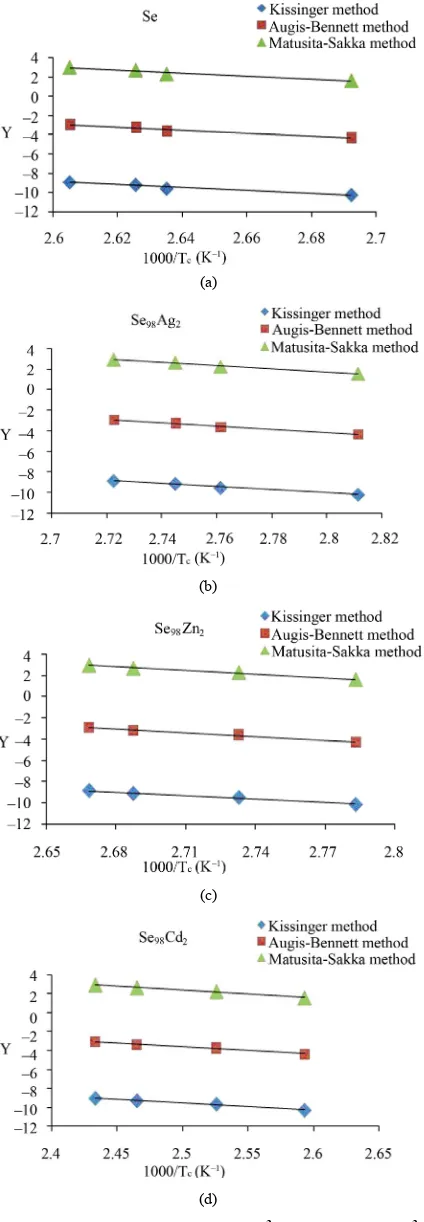
Ag, Zn, Cd) alloys has been calculated by Matusita- Sakka method, Augis-Bennett method and Kissinger method. For this purpose, the plots ln(β) versus 103/T
c,
ln(β/Tc) versus 103/Tc and ln
Tc2
versus 103/T
c are
plotted for the present glasses. Such plots for glassy Se and Se98M2 (M = Ag, Zn, Cd) alloys are shown in Figure 3. The obtained increasing sequence, (Ec)Cd < (Ec)Zn <
(Ec)Ag of activation energy of crystallization are given in
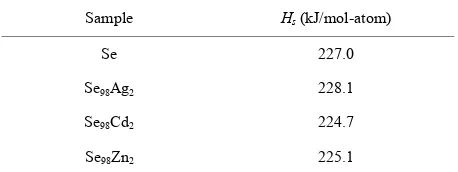
Table 2. This sequence can be explained to some extent in terms of average heat of atomization. The average heat of atomization HS, is based on chemical bonding aspects
and HS can be given as:
( S X) ( S Y)
S
a H b H
H
a b
(7)
Here, (HS)X and (HS)Yare the heat of atomization of
at-oms X, and Y respectively and [a + b] is the weight of % of constituent elements. The plot of Ec vs HS is shown
in Figure 4 for all the three methods. This plot clearly shows that the average heat of atomization of binary Se98M2 (M = Ag, Cd, Zn) alloys increases in the se-
quence (HS)Cd < (HS)Zn < (HS)Ag. The values of average
heat of atomization of binary Se98M2 (M = Ag, Zn, Cd)
alloys are given in Table 3. Thus, one can conclude that higher the average heat of atomization of the binary alloy, greater is the activation energy of crystallization.
4.3. Thermal Stability (S) and Glass Forming Ability (Hr)
Saad and Poulin proposed a thermal stability parameter [24], is defined as:
c 0
c
gT T T T S
T
g (8)
where, Tc is the peck crystallization temperature, T0 is the
onset crystallization temperature and Tg is the glass tran-
sition temperature. Thermal stability parameter reflects the resistance to devitrification after the formation of
Table 2. Activation energy of crystallization for glassy Se and binary Se98M2 (M = Ag, Cd, Zn) alloys determined by different non-isothermal methods.
Kissinger relation Matusita-Sakka relation Augis-Bennett relation Sample
Ec(kJ/mol)
Se 125.2 128.3 131.4
Se98Ag2 134.4 137.4 140.4
Se98Cd2 63.8 67.1 70.4
[image:4.595.309.538.645.731.2]Se98Zn2 91.1 94.0 97.1
Table 3. Average heat of atomization for glassy Se and bi-nary Se98M2 (M = Ag, Cd, Zn) alloys.
Sample Hs (kJ/mol-atom)
Se 227.0
Se98Ag2 228.1
Se98Cd2 224.7
(a)
(b)
(c)
(d)
Figure 3. (a)-(d) Plots of ln(β) vs 103/Tc, ln(β/Tc) vs 103/Tc and ln (β/Tc2) vs 103/Tc for glassy Se and binary Se98M2 (M = Ag, Zn, Cd) alloys.
glass. The calculated value of stability parameter, S, is given in Table 4.
Hruby [25] introduce a value, Hr which is strong
indi-cator of GFA, is defined as:
c g r
m c
T T
H
T T
(9)
where, Tc is the peck crystallization temperature, Tg is the
glass transition temperature and Tm is the melting tem-
perature.
Higher the values, Hrsignify a delay in the nucleation
retardation of the growth process. The value of Hr is also
listed in Table 4. From Table 4, one can see that the op- timum values of S and Hr parameters are obtained in case
of Ag additive.
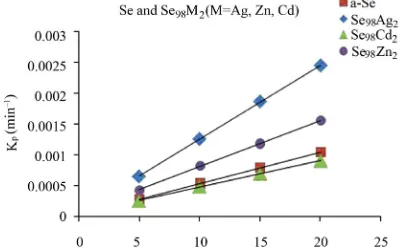
4.4. Rate of Crystallization (Kp)
To obtain more information about morphology of crystal growth, the following equation from Gao-Wang model [26] has been used:
2
c p
c
E K
RT
[image:5.595.68.280.95.706.2] (10)
Table 4. Thermal stability, S Glass forming ability, Hr and rate of crystallization, Kp for glassy Se and binary Se98M2 (M = Ag, Cd, Zn) alloys at the heating rate 10 K·min-1.
Sample S (K) Hr Kp (min−1)
Se 3.49 0.59 5.3 × 10⁻⁴
Se98Ag2 1.60 0.36 1.2 × 10⁻⁴
Se98Cd2 2.75 0.79 4.9 × 10⁻⁴
Se98Zn2 2.20 0.38 8.2 × 10⁻⁴
[image:5.595.311.536.435.705.2]Here, Kp represents the value of rate constant at peak
crystallization temperature Tc for a constant heating rate.
The values of Kp for glassy Se and binary Se98M2 (M =
Ag, Zn, Cd) alloys are given in Table 4. The heating rate dependence of Kp is shown in Figure 5. From this figure,
it is clear that the value of Kp is also highest in case of
Ag additive.
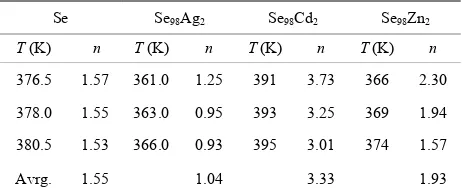
4.5. Avrami Index (n)
For constant temperature, Equation (4) can be written as:
1
ln ln(1 ) nlnconstant
(11)
From this equation, the value of n can be calculated by plotting ln ln(1 )1 vs lnβ curves at different tem-
peratures. The fraction “α” (extent of conversion) crystal- lized at any temperature T is given as α = AT/A, where A
is the total area of exothermic peak between the tem- perature Tiwhere the peak begins (i.e. the crystallization
starts) and the temperature Tf where the peak ends (i.e.
the crystallization is complete). AT is the partial area of
[image:6.595.320.527.92.636.2]exothermic peak between the temperatures Tiand T.
Figure 6 shows the variation of ln ln(1 )1 with
ln β for glassy Se and Se98M2 (M = Ag, Zn, Cd) alloys at
three constant temperatures. Using Equation (11), the value of Avrami index, n has been determined from the slope of these curves at three different temperatures. Similar plots were obtained for other glassy alloys. The temperature dependence of Avrami index for present glassy alloys is given in Table 5.
[image:6.595.71.271.582.707.2]When the liquid is cooled in the glass transition region, the relaxation times for molecular movements become comparable to the experimental time scale. Therefore, the diffusive movements become comparable to the ex-peri-mental time scale. Therefore, the diffusive motion of the liquid is trapped and the system falls out of thermal equilibrium. At this moment, the size of the nuclei does not reach the critical size required to initiate the nuclea tion process and hence the glass is assumed to have no
Figure 5. Heating rate dependence of Kp for glassy Se and binary glassy Se98M2 (M = Ag, Zn, Cd) alloys.
(a)
(b)
(c)
(d)
Figure 6.Plots of ln [ln (1 −α)−1] with ln β for glassy Se and binary Se98M2 (M = Ag, Zn, Cd) alloys at different tem- peratures.
temperature and then decreases rapidly with increasing temperature, while the rate of crystal growth reaches the maximum at a temperature much higher than the tem-perature at which the nucleation rate is highest. When the glass is heated at a constant rate, the crystal nuclei are formed only at lower temperatures and crystal grow in size at higher temperatures without any increase in num-ber.
[image:7.595.308.539.122.219.2]The values of Avrami exponent n depend on two ma-jor factors. First factor is the mechanism of crystal growth which may be mono-, bi- or tridimensional. Sec- ond is the growth limiting factors either diffusion or mo- tion of the outer crystal surface. The first situation corre- sponds to diffusion controlled growth (DCG) and the second to interface controlled growth (ICG). Finally, nucleation rate, which expresses the rate at which new nuclei are formed, may be zero, corresponding to a con- stant number of nuclei; it may be constant, increase or decrease versus time. Table 6 summarizes the n values for ICG and DCG mechanisms assuming growth is tri- dimensional [28]. The same n value may be found for different situations, and additional information is re- quired. The mean value of n is less than 1.5 for Se while it is between 1 and 3 for binary alloys. Thus, one can conclude that the growth in the present glasses is diffu- sion controlled. It also supports the fact that nucleation rate becomes negligible in the region of crystallization peak.
Table 5 indicates that n decreases with increase in temperature. It is well known that crystallization of chal- cogenide glasses is associated with nucleation and growth process and the extent of crystallization α increases with increase in temperature.
In other words it tends to its maximum value 1. The decrease in order parameter with increasing temperature for present glassy alloys suggests that the character of crystallization goes over from nucleation-driven in the beginning to essentially a growth driven regime by the end of crystallization process.
The values of n generally indicate the mode of crys- tallization. It is suggested that n = 4, 3, 2 correspond to the volume nucleation, three-dimensional, two-dimen- sional and one-dimensional growth, respectively and n = 1 suggests surface nucleation and one-dimensional gro- wth. From Table 5, it is clear that the average value of n
is nearly 1.5 for Se while it is nearly 1 for Se98Ag2, 2 for
Se98Zn2, 3 for Se98Cd2 alloys.
5. Conclusions
The calorimetric measurements have been performed in glassy Se and binary Se98M2 (M = Ag, Zn, Cd) alloy us
ing DSC technique. The major conclusions are:
Table 5. Temperature dependence of Avrami index, n for glassy Seand Se98M2 (M = Ag, Zn, Cd) alloys.
Se Se98Ag2 Se98Cd2 Se98Zn2
T (K) n T (K) n T (K) n T (K) n
376.5 1.57 361.0 1.25 391 3.73 366 2.30
378.0 1.55 363.0 0.95 393 3.25 369 1.94
380.5 1.53 366.0 0.93 395 3.01 374 1.57
[image:7.595.313.535.267.350.2]Avrg. 1.55 1.04 3.33 1.93
Table 6. Possible values of Avrami’s exponent, n for inter- face-controlled growth (ICG) and diffusion controlled growth (DCG).
n (ICG)
n
(DCG) Conditions
>4 >2.5 Increasing nucleation rate 4 2.5 Constant nucleation rate
3 - 4 1.5 - 2.4 Decreasing nucleation rate 3 1.5 Zero nucleation rate
1) The addition of Ag, Cd, Zn additives at lower con- centration (2 atomic %) in glassy Se significantly affects its thermally activated non-isothermal crystallization.
2) The maximum change in different kinetic parame- ters is observed for Ag additive. Thus Ag can be used for optimization of different kinetic parameters of crystalli- zation in glassy Se as compared to Cd and Zn additives.
3) The activation energy of crystallization in binary alloys is increased with the increase in average heat of atomization.
4) The crystallization mechanism is changed from one- dimensional growth to two dimensional and three dimen- sional growths after the inclusion of Zn and Cd additives respectively in glassy Se. However there is no effect of Ag incorporation on the crystallization growth.
6. Acknowledgements
NM is thankful to the Board of Research in Nuclear Sci-ences (BRNS), Mumbai, India for providing financial assistance under DAE Research Award for Young Scien- tists [Scheme No. 2011/20/37P/02/BRNS]. CD is thank- ful to UGC, New Delhi, India for providing financial support under RGNF programme to continue his research work. We also wish to express our sincere thanks to Pro-fessor O.N. Srivastava, Department of Physics, B.H.U., for undertaking the XRD measurements.
REFERENCES
[2] M. Andriesh, M. S. Lovu and S. D. Shutov, “Chalco-genide Non-Crystalline Semiconductors in Optoelectron-ics,” Journal of Optoelectronics and Advanced Materials, Vol. 4, No. 3, 2002, pp. 631-647.
[3] J. Keirsse, C. Boussard-Pledel, O. Loreal, O. Sire, B. Bureau, P. Leroyer, B. Turlin and J. Lucas, “Chalco-genide Glass Fibers Used in Bio-Sensors,” Journal of Non-Crystalline Solids, Vol. 326, 2003, pp. 430-433. [4] S. Kumar and K. Singh, “Glass Transition Thermal Sta-
bility and Glass Forming Tendency of Se90-xTe5Sn5Inx
Multi-Component Chalcogenide Glasses,” Thermochimica Acta, Vol. 528, 2012, pp. 32-37.
doi:10.1016/j.tca.2011.11.005
[5] M. Popescu, “Disorder chalcogenide optoelectro-nic ma- terials: Phenomena and Application,” Journal of Optoele- ctronics and Advanced Materials, Vol. 7, 2005, pp. 2189- 2210.
[6] K. Tanaka, “Chalcogenide Glasses—In Encyclopedia of
Materials: Science and Technology,” Elsevier Science Ltd., Oxford, 2001, p. 1123.
doi:10.1016/B0-08-043152-6/00210-2
[7] Ahmad, S. A. Khan, A. A. Al-Ghamdi, F. A. Al-Agel, K. Sinha, M. Zulfequar and M. Husain, “Kinetic of Non- Isothermal Crystallization of Ternary Se80-xTe20Znx,” Journal of Alloys and Compounds, Vol. 497, 2010, pp. 215-220. doi:10.1016/j.jallcom.2010.03.015
[8] S. R. Ovshinsky, “Reversible Electrical Switching
Phe-nomena in Disordered Structures,” Physical Review
Let-ters, Vol. 21, No. 20, 1968, pp. 1450-1453.
doi:10.1103/PhysRevLett.21.1450
[9] S. D. Kaloshkin and I. A. Tomilin, “The Crystallization Kinetics of Amorphous Alloys,” Thermochimica Acta, Vol. 280-281, 1996, pp. 303-317.
doi:10.1016/0040-6031(96)02926-7
[10] P. Pradeep, N. S. Saxena, M. P. Saxena and A. Kumar, “Isothermal Crystallization Study of Se70Te28Cd2 Chalco-
genide Glasses,” Physica Scripta, Vol. 54, No. 2, 1996, pp. 207-209.doi:10.1088/0031-8949/54/2/016
[11] M. B. El-Den, “Study of Hardness and Crystallization
Kinetics Due to Addition of Metals in SSe20 Chalco-
genide Glasses,” Egyptian Journal of Solids, Vol. 24,
2001, pp. 171-179.
[12] S. P Singh, S. Kumar and A. Kumar, “Effect of Impurity (Sb and Ag) Incorporation on the a.c. Conductivity and Dielectric Properties of a-Se70Te30 Glassy Alloy,” Phy- sica B: Condensed Matter, Vol. 407, No. 3, 2012, pp. 457-463. doi:10.1016/j.physb.2011.11.014
[13] M. A. M. Khan, S. Kumar, M. W. Khan, M. Husain and M. Zulfequar, “Electrical Transport Mechanisms in Glassy Se95M5 (M=Ga, Sb, Bi),” Materials Research Bulletin,
Vol. 45, No. 6, 2010, pp. 727-732. doi:10.1016/j.materresbull.2010.02.011
[14] J. Sharma and A. Kumar, “Effect of Impurity (Sb and Ag)
Incorporation on the a.c. Conductivity and Dielectric
Properties of Glassy Se70Te30 Glassy Alloy,” Physica B:
Condensed Matter,Vol. 407, 2012, pp. 457-463. doi:10.1016/j.physb.2011.11.014
[15] C. Dohare, N. Mehta and A. Kumar, “Effect of Some Metallic Additives (Ag, Cd, Zn) on the Crystallization Kinetics of Glassy Se70Te30 Alloy,” Materials Chemistry and Physics, Vol. 127, 2011, pp. 208-213
[16] W. A. Johnson and R. F. Mehl, “Reaction Kinetics in Processes of Nucleation and Growth,” Transactions of the American Institute of Mining and Metallurgical Engi-neers, Vol. 135, 1939, pp. 416-442.
[17] M. Avrami, “Kinetics of Phase Change I,” Journal of Physical Chemistry, Vol. 7, 1939, pp. 1103-1112. doi:10.1063/1.1750380
[18] M. Avrami, “Kinetics of Phase Change II,” Journal of Physical Chemistry, Vol. 8, No. 2, 1940, pp. 212-224. doi:10.1063/1.1750631
[19] H. E. Kissinger, “Reaction Kinetics in Differential Ther- mal Analysis,” Analytical Chemistry, Vol. 29, No. 11, 1957, pp. 1702-1706. doi:10.1021/ac60131a045
[20] K. Matusita and S. Sakka, “Kinetic Study of the Crystal-lization of Glass by Differential Scanning Calorimetry,” Physics and Chemistry of Glasses, Vol. 20, 1979, pp. 81- 84.
[21] K. Matusita, S. Sakka, “Study of Non-Isothermal Crystal- lization of Glass by Thermal Analysis,” Bulletin of the Institute for Chemical Research, Vol. 59, No. 3, 1981, pp. 159-171.
[22] T. Ozawa, “Kinetic Analysis of Derivative Curves in Thermal Analysis,” Journal of Thermal Analysis, Vol. 2, No. 3, 1970, pp. 301-324. doi:10.1007/BF01690134 [23] J. A. Augis and J. E. Bennett, “Calculation of the Avrami
Parameters for Heterogeneous Solid State Reactions Us-ing a Modification of the KissUs-inger Method,” Journal of Thermal Analysis, Vol. 13, 1978, pp. 283-292.
[24] M. Saad and M. Poulin, “Glass Forming Ability Criteria,” Materials Science Forum, Vol. 19-20, 1987, pp. 11-18. [25] Hruby, “Evaluation of Glass Forming Tendency by
Means of DTA,” Czechoslovak Journal of Physics, Sec- tion B, Vol. 22, 1972, pp. 1187-1193
[26] Y. Q. Gao and W. Wang, “On the Activation Energy of Crystallization in Metallic Glasses,” Journal of Non-Cry- stalline Solids, Vol. 81, No. 1-2, 1986, pp. 129-134. [27] K. Matusita, T. Konatsu and R. Yokota, “Kinetics of
Non-Isothermal Crystallization Process and Activation Energy for Crystal Growth in Amorphous Materials,” Journal of Materials Science, Vol. 19, 1984, pp. 291-296. [28] J. W. Christian, “The Theory of Transformation in Metals