U
N I V E R S I T Y O F
T
W E N T E
M
A S T E RT
H E S I SPredicting user loyalty in an education
support web application based on usage
data
Author:
Karim M. EL AS S A L
Supervisors: Dr.ir. M. VA N KE U L E N Dr. K. SC H I L D K A M P
External supervisors: L.D.J. NI E S I N K E.R.G. VA N D E R VE E N
A thesis submitted in fulfillment of the requirements for the degree of Master of Science
in the
Databases Research Group Department of Computer Science
iii
Declaration of Authorship
I, Karim M. EL AS S A L, declare that this thesis titled, “Predicting user loyalty in an
education support web application based on usage data” and the work presented in it are my own. I confirm that:
• This work was done wholly or mainly while in candidature for a research degree at this university.
• Where any part of this thesis has previously been submitted for a degree or any other qualification at this university or any other institution, this has been clearly stated.
• Where I have consulted the published work of others, this is always clearly attributed.
• Where I have quoted from the work of others, the source is always given. With the exception of such quotations, this thesis is entirely my own work.
• I have acknowledged all main sources of help.
• Where the thesis is based on work done by myself jointly with others, I have made clear exactly what was done by others and what I have contributed my-self.
Signed:
vii
University of Twente
Abstract
Faculty of Electrical Engineering, Mathematics and Computer Science Department of Computer Science
Master of Science
Predicting user loyalty in an education support web application based on usage data
by Karim M. EL AS S A L
Data use in education has been increasing in the last 20 years. School management and teachers are moving towards a data-driven policy and improvement process due to the potential benefits. Studies show that data use can increase student achievement to some extent, and that the use of information systems that facilitate data use has a positive impact on educational management.
There are many barriers that limit the adoption of data use, one of which is the teachers and specifically their data (il)literacy and their attitude towards data use. The proper adoption of data systems by teachers is paramount in this context: with-out appropriate use of the means, data use can not be effectively utilized. A few factors that influence the adoption of data systems are data’s availability, reliability, findability and interpretability.
Knowing users’ opinions on these factors is essential to improving such a data system. Gathering these opinions, however, is time and resource intensive. That’s why Reichheld’s Net-Promoter Score (NPS) survey is so popular. It asks the question "How likely is it that you would recommend our system to a friend or colleague?" and expects an answer between 0 (extremely unlikely) and 10 (extremely likely). Users scoring 9 or 10 are called Promoters, users scoring 7 or 8 are Passives and users scoring between 0 and 6 are Detractors. It is considered a measure of loyalty: Reichheld argues that users who promote your system put their own reputation on the line.
This research focuses on predicting a user’s NPS response based on their system usage data. With this loyalty prediction, system owners can better target their sys-tem evaluation and improvement efforts. The use case is Somtoday, an exemplary Dutch high school administration system developed by Topicus Education. The re-search question is: "How reliably can teachers’ usage data, generated by an education support data system, be used to predict user loyalty towards that system?"
There are 1085 NPS responses available, consisting of a score and a reason for that score, with an average of 1408 relevant log entries per NPS response. Additionally, non-identifying profile data is available, such as a teacher’s school and the education levels he or she is teaching.
viii
mining algorithm Apriorirep1i we created, numerical or binary values for each data feature were extracted.
The actual NPS prediction was done using machine learning. A brute force ap-proach was applied to account for differences in models, model parameters, and preprocessing methods such as normalization and outlier removal. Additionally, the data type of the predicted NPS score was treated in three different ways: numerical (0-10), eleven-value categorical (0-10), and three-value categorical (Promoter, Passive, Detractor). The best models performed with a mean absolute error (MAE) of 1.727 with numerical prediction, an accuracy of 27.92% with eleven-value categorical pre-diction, and 54.30% with three-value categorical prediction. If one always predicts the dominant class or value, i.e. 7 or Passive, the MAE with numerical prediction is 1.733, the accuracy with eleven-value categorical prediction is 27.63%, and the accu-racy with three-value categorical prediction is 44.07%. Validation was provided by the utilized brute force approach and by looking at different performance metrics.
The small performance difference between the trained models and always pre-dicting the dominant class or value shows that there is practically no predictive value in the dataset. The conclusion of this study is that the researched data features can not reliably be used with machine learning models to predict NPS scores.
ix
Acknowledgements
This project has taught me many positive things about research, generating ideas, time management, prioritizing, motivation, and how much one can do when one’s mind is set to it. I would like to thank Maurice van Keulen for the excellent guidance and sparring moments. Your tip that data preprocessing takes up most of the time in a data science project was no overstatement. You have always been positive and timely in your communications, even though I have consistently declined your requests for me to be a student assistant in your data science courses prior to this project. I would also like to thank Kim Schildkamp. You have also been a first-rate supervisor. Your points of feedback were paramount to the scientific quality of this thesis and were hugely appreciated. Your perspective as an expert of the field was essential. During your absence, Rilana Prenger took over your supervision wonderfully. Rilana, I thank you too for your feedback and contributions in our discussions.
I would also like to thank Luke Niesink and Egbert van der Veen from Topicus. You have been exceptionally constructive in your feedback, discussions and facili-tating help. The working environment was pleasant and your enthusiasm was very motivating. On that note I would also like to thank Erik Dikkers for the opportunities and flexibility. Similarly, Thomas Markus deserves a big thank-you. Our discussions motivated me more than you think. Also, your help with the data infrastructure lit-erally proved to be indispensable.
Furthermore, I would like to thank my roommates at Avion for their youthful enthusiasm and for reminding me that I was still a student during this project (albeit a hard working one). I also want to thank TNO, my current employer, for providing me in the last few months with ample opportunity to finish this project. Of course, my gratitude also flies out to my girlfriend, family and friends for their support before, during and after my medical leave of absence. I have reserved a special thanks for my girlfriend’s Maine Coon kitten Woezel. The overload of cuteness always was and still is a welcome distraction.
xi
Contents
Declaration of Authorship iii
Abstract vii
Acknowledgements ix
Contents xi
List of Figures xiii
List of Tables xv
1 Introduction 1
1.1 Problem . . . 2
1.2 Objectives and use case. . . 3
1.3 Research questions . . . 3
1.4 Available data and technologies . . . 4
1.4.1 NPS responses . . . 4
1.4.2 Usage data. . . 5
1.4.3 Profile data . . . 7
1.4.4 (Unplanned) downtimes . . . 7
1.4.5 Auxiliary qualitative data . . . 8
1.4.6 Infrastructure . . . 8
1.5 Approach. . . 10
1.5.1 Feature discovery . . . 11
1.5.2 Data preprocessing . . . 11
1.5.3 Pattern extraction . . . 11
1.5.4 Model training . . . 11
1.5.5 Validation . . . 12
1.6 Ethical considerations . . . 12
2 Background 13 2.1 Net-Promoter Score (NPS) . . . 13
2.2 Web usage mining. . . 13
2.3 Machine learning . . . 14
2.4 Sequential pattern mining . . . 18
3 Feature discovery 23 3.1 Efforts . . . 23
3.1.1 Service desk interview and qualitative data . . . 25
3.1.2 Customer relations interviews . . . 25
3.1.3 Topicus’ student convention . . . 26
3.1.4 Teacher survey . . . 26
xii
3.1.6 Qualitative NPS data . . . 27
3.1.7 Qualitative feedback data . . . 27
3.2 Results . . . 27
3.3 Selection . . . 33
4 Data preprocessing 35 4.1 NPS . . . 35
4.2 Usage logs . . . 37
4.3 Feature-specific: system usage . . . 42
4.4 Feature-specific: repetitive tasks. . . 43
4.5 Feature-specific: low-hanging fruit . . . 43
5 Pattern extraction 45 5.1 System usage . . . 45
5.2 Repetitive tasks . . . 46
5.2.1 Apriorirep1i (basic). . . 46
5.2.2 Apriorirep1i (complete) . . . 51
5.2.3 Application . . . 52
5.2.4 Related work . . . 53
5.3 Low-hanging fruit. . . 54
6 Model training 57 6.1 Approach. . . 57
6.2 Model-specific preprocessing . . . 64
6.3 Results . . . 65
7 Validation 69 8 Conclusion 73 8.1 Main research findings . . . 73
8.2 Discussion . . . 74
8.3 Recommendations . . . 75
Appendices 77 A Apriorirep1i implementation . . . 81
B Correlations between attributes and NPS scores . . . 85
xiii
List of Figures
1.1 Response distribution of teacher NPS responses. . . 5
1.2 Temporal distribution of teacher NPS responses . . . 5
1.3 Temporal distribution of usage logs . . . 7
1.4 Topicus Education’s data analysis storage infrastructure. . . 9
1.5 Topicus Education’s data collection processes . . . 9
4.1 Response distribution of teacher NPS responses . . . 37
4.2 Temporal distribution of teacher NPS responses . . . 38
4.3 Response distribution of relevant log entries per NPS response. . . 41
4.4 Temporal distribution of relevant log entries . . . 41
7.1 One of the generated decision trees for output data type categorical (11 values) . . . 69
xv
List of Tables
1.1 Raw NPS data fields . . . 4
1.2 Raw usage data fields. . . 6
2.1 Example customer (video rental) transaction database used as input for sequence pattern mining . . . 18
2.2 Sequential pattern mining terminology mapping . . . 19
2.3 Example sequence database . . . 19
2.4 Example sequence database for the SPADE algorithm . . . 20
2.5 Example progression of SPADE . . . 20
2.6 Example progression of PrefixSpan . . . 21
4.1 Target format for the NPS dataset . . . 35
4.2 Descriptive statistics of users with multiple NPS responses . . . 37
4.3 Target format for the logs dataset.. . . 38
4.4 Format for the sessions dataset . . . 42
4.5 Target format for the system usage preprocessed dataset. . . 43
4.6 Target format for the repetitive tasks preprocessed dataset . . . 43
4.7 Concatenated fields for the action string of the non-API logtype. . . 44
4.8 Concatenated fields for the action string of the API logtype. . . 44
5.1 Semantic use case differences from literature . . . 47
5.2 Running example for Apriorirep1i illustration . . . 48
5.3 Result of Apriorirep1i’s litem phase (running example) . . . 49
5.4 Intermediate result of Apriorirep1i after two iterations (running exam-ple) . . . 50
5.5 Intermediate result of Apriorirep1i with our running example after get_next_patternsstep of sequence phase . . . 50
5.6 Intermediate result of Apriorirep1i with our running example after purge_subpattern_cycle_startstep of sequence phase . . . 50
5.7 Running example input for Apriorirep1i’s maximal phase reduced to s4 ands5 . . . 51
5.8 Result of basic Apriorirep1i applied on the running example . . . 51
5.9 Intermediate result of Apriorep1i afterpurge_cyclic_shiftsstep of sequence phase . . . 52
5.10 Result of complete Apriorirep1i applied on the running example . . . 52
5.11 The reduced dataset format for featureD F23 . . . 54
5.12 The reduced dataset format for featureD F24 . . . 54
5.13 The dataset format for featureD F25 . . . 55
6.1 The dataset format for the machine learning model input . . . 57
6.2 Datasets used with predictive modeling . . . 58
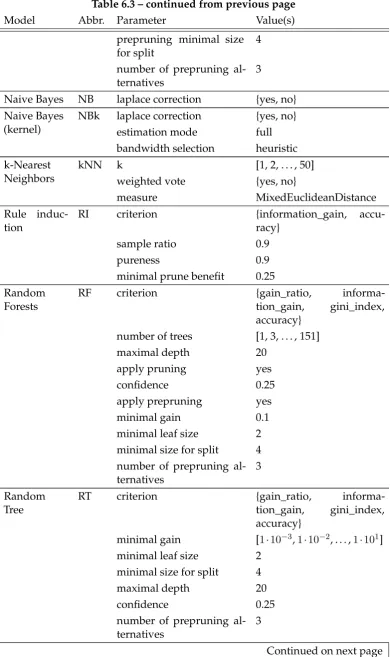
6.3 Models for input types numerical and binary, output type categorical . 59
xvi
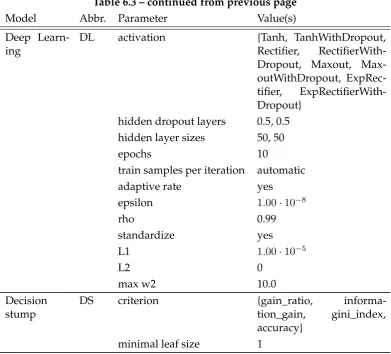
6.5 Models for input types numerical and binary, output type numerical . 62
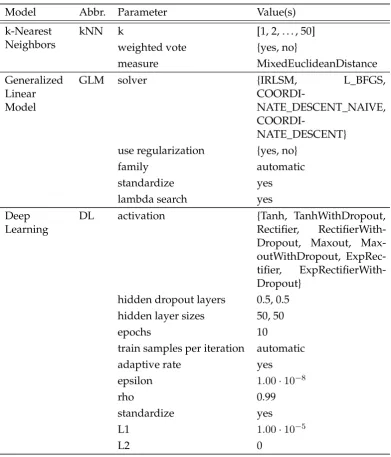
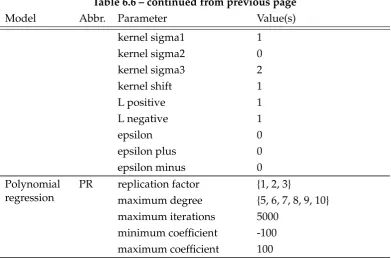
6.6 Models for input type numerical, output type numerical . . . 63
6.7 Results if prediction is done randomly . . . 65
6.8 Results if the predicted value is always the dominant classification . . 66
6.9 Prediction model results for output data type categorical (11 values) . 66 6.10 Prediction model results for output data type categorical (3 values) . . 67
6.11 Prediction model results for output data type numerical. . . 67
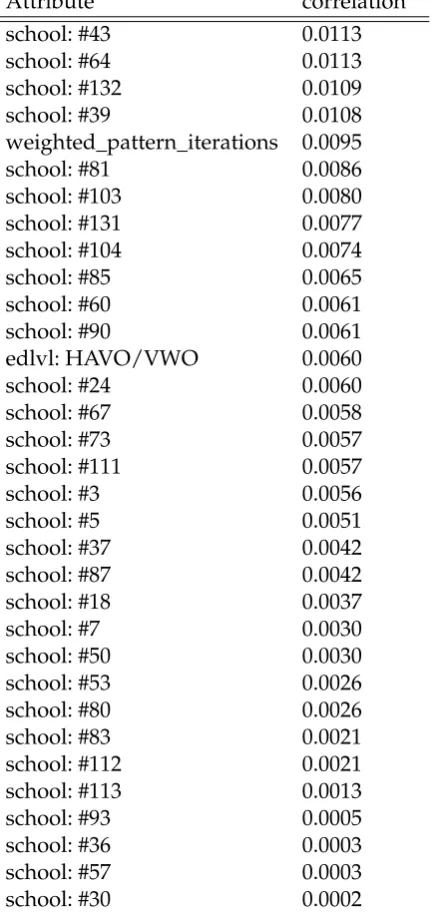
6.12 Top 10 attributes having the highest correlation with the NPS score . . 68
7.1 Confusion matrix of the best random forest model . . . 70
7.2 Confusion matrix of the best k-Nearest Neighbors model . . . 71
8.1 Top results from section 6.3 put together . . . 74
xvii
I dedicate this thesis to the
Human Colossus
1, may it grow vast,
contribution by contribution.
1
Chapter 1
Introduction
The improvement of our future relies immensely on the quality of our education. When we improve our education we not only better our future, but also the future of generations to come. To make sure that people focus their efforts on actual growth and not on mere futile attempts and approximations, the right decisions must be made based not on (gut) feelings, but on accurate data. One way of doing that is by using education supportdata systems1. Although there are other reasons that might hinder data-driven decision making, such as attitude and high workload, an effective and optimized data system comes a long way in stimulating data use. This study uses certain usage patterns within such a system to predict users’ loyalty towards that system based on the NPS metric, so that system improvements can be better targeted and, in turn, to ultimately advance data use in education, education itself, and our future.
Data use in education has been increasing in the last 20 years. With the advent of the internet and the availability of enormous amounts of data, data use in schools has attained a prominent place in the educational system. School management and teachers are moving towards a data-driven policy and improvement process due to the potential benefits [7, 15, 16,34,60, 63]. Data use can be defined as “system-atically analyzing existing data sources within the school, applying outcomes of analyses to innovate teaching, curricula, and school performance, and, implementing (e.g. genuine improvement actions) and evaluating these innovations” [52, p.482]. Data include not only assessment data, but anything about the school and students that might be relevant for decision making. Examples are student background data, process data (e.g. classroom observations and teacher interviews), school context data (e.g. information about the building), student assessment data and satisfaction data [3,30,53]. Several studies show that data use can increase student achievement to some extent [8,35,38,45], for example by setting specific and measurable achieve-ment goals [17]. Studies have also shown that the use of systems that facilitate data use1 has a positive impact on educational management. Examples include better access to information, more efficient administration, higher utilization of school re-sources, reduction in workload, better time management, and improvement in the quality of reports [55]. These examples show that data use and the use of data sys-tems improve several aspects of education, motivating a wider adoption of data use and its facilitating systems.
1The terminology in literature for these types of systems is unclear. Several studies use different
2 Chapter 1. Introduction
1.1
Problem
There are, however, many barriers that limit the adoption of data use. One of the most influential factors is the teachers; specifically their data (il)literacy and their attitude towards data use [54]. Teachers that see the value in using data as evidence for the improvement of student achievement on an individual basis, tend to overcome barriers more easily and are more likely to use data systems [43]. The proper adoption of these tools by teachers is paramount: without appropriate use of the means, data use can not be effectively utilized.
Research has shown that a few key factors are important for the adoption of data systems, besides the adoption of data use as a concept. The most important factors are the data’s availability, reliability (i.e. data being accurate and up to date) and the ease with which specific data can be found [6,11,17,27,52,64]. Furthermore, teach-ers report they need functionalities to not only access and organize data, but also support the interpretation of data [34,51]. This is necessary for users with limited data literacy, which can be assumed to be a very large part of all teachers. Function-alities supporting data interpretation may prevent or at least mitigate the chances of data misuse and abuse. Data misuse is basically a wrong interpretation of data. An example of data abuse is when teachers try to improve a class’ test score average by practically giving up on the ’hopeless’ students [39,52].
The above mentioned studies have reported on teachers’ opinions, which can ulti-mately improve the adoption of data use and data systems. Gathering these opinions, however, is time and resource intensive. One might think of composing focus groups and organizing constructive conversations with them, or constructing, administering and processing surveys. Companies developing data systems are very interested in the opinions of their end users. Yet, they might also have other reasons that make the method of obtaining feedback impractical. For example, the end users might not be in the management positions. At Topicus Education, the company of this thesis’ use case (see section1.2), they’ve run into a direct consequence of that distinction. They es-sentially have two paths of communication: one for business-to-business and one for end-user-to-business. The former is used for business-level subjects and is between a school’s application manager and one of Topicus’ customer relations employees. The latter is for gathering points of improvements to the system and consists mainly of talking to focus groups on a per-school basis, administering periodic surveys and making a feedback button available within the system (more on this in section1.4). The problem is that with the business-to-business communications, an application manager acts as a spokesperson for the end users of their associated school. Topicus reports that more often than not, the application manager expresses the customer’s positive opinion while in reality the end users are dissatisfied with several aspects of the system.
1.2. Objectives and use case 3
1.2
Objectives and use case
The above example of the application managers, combined with the general tedious-ness of feedback aggregation, illustrates the opportunities for improvement in the process of gathering feedback about a system. This study focuses on predicting user loyalty in a userbase-wide, non-invasive and fully automated way, i.e. by analyzing metrics (calledfeatures) derived from the usage data. For example, a feature could be the average amount of login actions per day and a prediction could be "if a user logs in 10 times per day on average, he is very likely to give a score of 4 on the NPS survey". With this loyalty prediction, system owners can identify potentially disloyal users and effectively target their system evaluation and improvement efforts. Addi-tionally, this study will provide some insight into user behavior that qualifies users as loyal, neutral or disloyal.
The use case for this study isSomtoday2, an exemplary high school administra-tion system. It has a web-based user interface and is tailored for school staff, students and parents. It is owned and developed byTopicus Education3 and has been first released in September 2006. As of October 2016, it had about 660,000 users [42] and for a few years now, a share of about 30% of the Dutch market in educational data systems in the higher education4 segment [40]. In addition to the web-based user interface, Topicus has released a basic variant in 2015 called Somtoday Docent which is meant for mobile devices. Although it has less functionalities, it is more useful in class for administrative tasks such as absentee registration.
1.3
Research questions
The road to reach the goal described in section1.2is taken by finding an answer to the main research question:
How reliably can teachers’ usage data, generated by an education sup-port data system, be used to predict user loyalty towards that system?
The following questions have been formulated to divide the main problem into distinct parts. Each question is answered by the respective chapters3to7.
1. What might be an influence on the user loyalty towards the data system? 2. How can the raw data be put into a format usable for research?
3. How can values for each data feature be extracted from the data? 4. What is the predictive value of the dataset?
5. What is the predictive validity of the trained model?
Although an effort is being made in engaging students in utilizing their own data [31], the scope of this study has been limited by only looking at usage data of teachers. This is the group of users that is the most influential factor in the adoption of the system [27] and the most influential in a school’s decision of data system.
2https://www.som.today/
3https://topicus.nl/onderwijs/
4 Chapter 1. Introduction
1.4
Available data and technologies
This section describes the data and technologies that are available at Topicus. Some basic analyses have been made to show the size and distribution of the datasets.
Unfortunately, there are no reliable data available about encountered system bugs. This is due to a concurrency limitation within Somtoday, which makes it unusable for this study.
1.4.1 NPS responses
The individual NPS responses are the data points that are used to train the model in its predictive capabilities. Each day a few dozen users are randomly selected to receive the NPS survey. There is at least a time period of about three months between each survey to the same user to be certain that users aren’t bothered too often. Additionally, the NPS survey is administered after notable client contact, such as with Topicus’ service desk.
The raw data fields are described in table1.1. Seeing as this research focuses pri-marily on teachers, the raw dataset was filtered on the role field: only NPS responses are considered where the user has the role’teacher’,’mentor’or’individual mentor’. Mentors can be assumed to also be teachers. The’other’role includes parents and non-teacher types of school employees such as management and support staff.
TA B L E 1 . 1 : Raw NPS data fields. Note that the actual field names are slightly different in the actual dataset; either with different
capital-ization, translated, simplified or a combination of those.
Field Description Data format / possible values
date The date and time the user re-sponded to the NPS survey.
datetime string
INSTUUID The institution (i.e. school) ID within Somtoday.
alphanumeric string of length 36
institution The school of the user. string process The process that was the
motiva-tion for administering the NPS survey.
’Active account Student|Employee|Caretaker’ | ’Accountmanagement’|’Servicedesk’ |’Training participant’
UUID The user ID within Somtoday. alphanumeric string of length 36 role The role of the user. This is
de-termined based on assignments within Somtoday. E.g. a user is a teacher if he is assigned to one or more classes.
’application manager’|’teacher’|’mentor’| ’indi-vidual mentor’|’other’
NPS The actual NPS response. integer between 0 and 10 (inclusive) root cause 1 The primary root cause for the
NPS response.
any of the available categories, such as ’functionali-ties’,’availability’,’user-friendliness’and’service’
root cause 2 The secondary, supplementary root cause for the NPS response.
any of the available categories, such as specific functionalities, the layout on specific devices and the length and frequency of system unavailability open question Any further clarification for the
given response.
1.4. Available data and technologies 5
In the available dataset, there are 1085 NPS responses of teachers in the relevant time frame. Of those, there are 6 users that have two NPS responses. The time be-tween responses is 4.4 months on average, with a minimum of 2.8 months. One anomalous case was removed. All NPS responses, including those of users with two responses, will be treated as separate and independent of each other. The response histogram is shown in figure1.1and the temporal distribution is shown in figure1.2.
FI G U R E 1 . 1 : Response distribution of teacher NPS responses.
FI G U R E 1 . 2 : Temporal distribution of teacher NPS responses. Note that the different response values are shown solely to indicate that
there is variation.
1.4.2 Usage data
The usage data is the main subject of this research. It consists of two types of web usage logs. The first is automatically collected by the framework in which the main Somtoday web application is developed:Apache Wicket5. This data is copied in a transformed format to the cluster for future analysis (more on the infrastructure in section1.4.6). We’ll call these thenon-API log entries. Log entries of the second type are a result of the Somtoday Docent front-end application that generates API calls to the back-end and also end up on the same cluster. We’ll call these theAPI log entries.
6 Chapter 1. Introduction
The non-API and API logs have some intersecting fields. They are described in table1.2.
TA B L E 1 . 2 : Raw usage data fields. Note that this table only contains fields that are possibly relevant for the rest of this research.
Field
non-API API Description Data format / possible values @timestamp X X The timestamp of the request, accurate
to the millisecond.
timestamp string
duration X X The amount of milliseconds it took the server to process the request and build a response.
positive
requestedUrl X X The URL. string
userAgent_* X X Several fields containing data about the user’s user agent, such as the name, device type, operating system, browser and browser version.
integer in the case of versions, string in any other case
username X The username of the user. string
username X The username of the user, including the organisation (i.e. school) abbrevi-ation.
string: ’<organisation-abbr>/<username>’
remote address X The user’s ip address. IPv4 or IPv6 string organisation X X The full name of the user’s school. string
range X Element used for pagination. string, e.g.’items=0-100’
restResource X The URL to the resource, including pa-rameter templates.
string
method X The method with which the request was sent.
’GET’|’POST’|’OPTIONS’|
’PUT’|’DELETE’
category X The category of the resource. string status X The HTTP status code sent back to the
user.
integer
sessionId X A unique session ID. alphanumeric string of
length 40 session_startDate X The timestamp the session started,
ac-curate to the millisecond.
timestamp string
session_numberOf-Requests
X The sequential number of the current request relative to the current session.
positive integer
session_totalTime-Taken
X The total number of milliseconds the current session is taking up until the current request.
(large) positive integer
eventTargetClass X The Java class handling the request. fully qualified Java class name event_pageClass X The Java page class that triggered the
request.
fully qualified Java class name
componentClass X The Java component (e.g. button) class that triggered the request.
fully qualified Java class name
componentPath X The path to the component of ’compo-nentClass’.
CSS selector-like string
behaviorClass X The Java behavior class responding to the event. Examples are AJAX and timer events.
fully qualified Java class name
response_pageClass X The Java page class responding to the request.
fully qualified Java class name
1.4. Available data and technologies 7
The weekend and holiday dips are clearly visible and the peak in June 2016 and the absence of entries in September 2017 are explained by irregularities in the process of log storage. The absence of API log entries before May 2016 is explained by the introduction of the API logging process around that date. These irregularities do not impact this research because they lie outside of the time frame of relevant entries, as chapter4also explains.
FI G U R E 1 . 3 : Temporal distribution of usage logs
1.4.3 Profile data
The Somtoday back-end has profile data stored of its users and schools inOracle Database6divided over several servers. This data can be extracted with SQL queries that can become rather complex due to the normalized format of the relational storage. Note that the existence of this data does not mean it is used in this research.
Students Personal data (i.e. name, address and date of birth), familial relations, pre-vious school, current school registration (including date of registration, educa-tion level7and education specialization8), internships, absence, study program, linked groups (i.e. classes), exam results, medical data, class schedule and home-work (administration).
Employees Personal data (i.e. name, address and date of birth), linked groups (i.e. classes) and class schedule.
Schools General data (e.g. name, owner and data on all establishments), educational programs and settings within Somtoday (e.g. security rights, layout settings and templates).
1.4.4 (Unplanned) downtimes
The periods of unplanned downtime are tracked by the system monitoring company Uptrends9. They provide a web-based interface that includes the option to export data into XLSX file format. The available data consist of the moments at which a specific system has reported a failure or that it’s available again. In the time period
6http://www.oracle.com/technetwork/database/
7In Dutch this is the opleidingsniveau, such as HAVO or VWO.
8 Chapter 1. Introduction
between July 1st, 2016 and June 30th, 2017, Uptrends reports 25 periods of unplanned downtime of Somtoday. The length of these periods range from mere minutes to half an hour, with a few exceptions reaching about 90 minutes.
There are no data available about planned downtime. However, this can be ex-tracted from the logs by looking at periods of time in which the amount of log entries reaches zero. These maintenance periods are usually about every three weeks on Fridays between 5 and 6 PM, limiting the search scope considerably.
1.4.5 Auxiliary qualitative data
There are three auxiliary data sources available: the open question included in the NPS survey, the responses on the feedback button within Somtoday, and the service desk tickets. These have not been used for data analysis, but primarily to gain new insights into possibly relevant features. More on this is discussed in chapter3. Note that the termauxiliarydata is used here not as jargon, but exactly as the definition specifies it: supportive or supplementary data. This was chosen to distinguish data that is used for automated analysis and data that is used for manual analysis (i.e. feature discovery).
The NPS survey includes an open question asking for a reason behind the respon-dent’s given response. Table1.1shows that respondents can classify and subclassify their main reason. This is supplemented with what the respondent wants to say. There are an even amount of data points as there are (relevant) NPS responses, al-though a small part of the open question responses is empty or otherwise useless.
Contact between Somtoday’s end users and Topicus generally doesn’t happen directly. Topicus handles contact with a school’s application manager. This means that whenever an end user has a question or complaint, it is passed through the application manager to Topicus’ service desk. Whenever answering a question takes more than a few seconds, a ticket is created in the issue tracking systemJIRA10. There were 2314 tickets created between January 2nd, 2014 and April 25th, 2017.
Furthermore, Somtoday has got a feedback button integrated in its layout. This way, users can send feedback to the developers within a few seconds. These are meant to be ideas for new features, although users often send complaints, mistaking the feedback functionality for the service desk. All feedback sent via this button is collected byFreshdesk11. Topicus received 1953 responses between November 13th, 2015 and June 27th, 2017.
1.4.6 Infrastructure
Topicus Education has an infrastructure in place specifically designed for the anal-ysis of usage logs. The relevant parts are explained here. All storage, applications and other processes reside in a cloud environment managed byPrevider12. Authen-tication is not depicted here, but is embedded in the infrastructure and handled by Topicus’ ownKeyhub13service. Practically all services run inDocker14instances and load balancing on the cluster is managed byKubernetes15.
10https://www.atlassian.com/software/jira
11https://freshdesk.com/
12https://www.previder.com/
13https://www.topicus-keyhub.com/
1.4. Available data and technologies 9
FI G U R E 1 . 4 : A UML component diagram that depicts Topicus Ed-ucation’s infrastructure relevant to data analysis. Note that the dis-played interpreters and plugins are just practical examples: in reality, many more are implemented and used in their respective systems.
(A) The UML activity diagram of the pro-cess that stores real-time request log data
(B) The UML activity diagram of the transfer of log data to long-term storage FI G U R E 1 . 5
Real-time data collection Logging requests received by Somtoday and Somtoday Docent is handled in real-time. Figure1.5ashows the order of operations upon receiving a new request. Elastic’s Filebeat16 andLogstash17 pipelines handle several elementary extraction, transformation and loading (ETL) operations. A buffer handles any issues resulting from slow disk operations. This buffer’s size is in 100 log entries. When the buffer is full it writes the compressed log entries to a staging directory on the Hadoop cluster, after which the log entries are available for analysis. This means this data collection process is nearly, but not entirely real-time.
Historical data collection Figure1.5bshows the process that flushes the (near) real-time data to a data lake on the cluster: long-term storage that holds various types of data in (semi-)structured format. Each log type is stored in a different 16https://www.elastic.co/products/beats/filebeat
10 Chapter 1. Introduction
subdirectory. This happens every 24 hours, at night. After this atomic operation completes, the real-time data from the staging directory are purged.
Data storage Topicus Education maintains its distributed storage using theApache Hadoop18ecosystem. This cluster is managed with the graphical web-based user interfaceApache Ambari19v2.4.2.0. The infrastructure is depicted in fig-ure 1.4. All analysis operations and queries for stored data go through Drill and/or Hadoop.
Data storage format Apache Drill uses theApache Parquet20 format to store its ta-bles. It uses a column-based storage structure, as opposed to conventional row-based structures. A big advantage is that it enables quick physical data retrieval for a few columns on a large dataset. For example, retrieving the timestamps of all requests of a specific user is fast, but retrieving all rows within a specific timespan is very slow.
Data querying (back-end) The center of action isApache Drill21 v1.7.0. Drill is a schema-free SQL query engine that Apache promotes as having far less over-head due to its flexibility and agility in easily working with multiple data sources. A disadvantage is that this proved false in our case. For example, when joining different tables, casting must take place to force a schema on each table so Drill can perform a proper hash join. An advantage is that it uses (ANSI) SQL for querying.
Data querying (front-end) Apache Zeppelin22v0.7.1 is a web-based notebook that interfaces with Drill. It enables execution of several languages, which is handled by interpreters, and incorporates rudimentary version control. The available languages are Angular (for interactive notebooks), Drill (for directly querying the back-end), Markdown (for simple text), Python (for handling data with a full-fledged programming language), and R (for more basic data analyses). It also offers a fairly extensive display system for easy visualization of (business intelligence) datasets.
Data processing Within Zeppelin,Python23 v2.7 is used because of the advantage of having a complete programming language.
Other data, such as the NPS data and any data from the Somtoday database, are exported from their respective sources into CSV format and made available to Drill by uploading to the Hadoop cluster using Ambari. Seeing as the dataset does not get updated often, this is a manageable workflow.
1.5
Approach
This section summarizes the approach used in this research project. Each phase’s challenges and results are discussed in more detail in their respective parts: chap-ters3 to 7. The goal of each phase is to find an answer to the respective research
18https://hadoop.apache.org/
19https://ambari.apache.org/ 20https://parquet.apache.org/
21https://drill.apache.org/
22https://zeppelin.apache.org/
1.5. Approach 11
questions described in section1.3. The overall structure is a combination of the com-mon approaches used in the fields of web usage mining and machine learning, seeing as this study is exactly that: a combination of those two fields. A basic version of this approach was used at the start of this project as a pilot to get familiar with the process, using raw login frequencies as a data feature.24
1.5.1 Feature discovery
The results of the first phase of this project determined the exact content of the sub-sequent phases: researching which data features might be an influence on a user’s NPS response. Discovering which features might be relevant was done by speaking with several stakeholders that can be considered domain experts. These include not only teachers, but also Topicus’ staff in the customer service, customer relations, de-velopment and data analysis departments. Several questions were prepared with the purpose of having a clear direction for each short interview. In addition to these ques-tions the interview had a brainstorm approach, seeing as the purpose was to gain new insights and come up with new ideas for features. Additionally, the qualitative dataset was manually scanned for ideas. Suggestions were disregarded that were previously encountered, immeasurable (based on the available data), or otherwise had no practical value.
1.5.2 Data preprocessing
This phase is notorious for being underestimated in time spent on it. During this phase, the available data were transformed into a format that could be used in sub-sequent phases. For the NPS data this meant filtering on user type and time frame. For usage data this means only keeping entries that relate to the users of the NPS data, within a specific time window of the NPS response and discarding other irrel-evant entries. While more features were researched, this phase was repeated. Note that validation of this phase proved to be important in ensuring that the dataset used in subsequent phases was correct. Validation was done by preprocessing the dataset at each atomic step in different ways, and comparing the resulting amount of records. Also, taking a random sample and zooming in on it was useful for detecting irregularities.
1.5.3 Pattern extraction
The purpose of this phase was to get meaningful, measurable data from the prepro-cessed, large dataset in the format of one or several values per data feature. The taken approach differs per feature. For some it was as simple as summing up values, for others it entailed coming up with a new algorithm.
1.5.4 Model training
At this point the working dataset was reduced to several features per user. This was used together with the known NPS responses to train a machine learning model, such that it could be used to predict NPS responses of other users based on new, unseen 24One should not consider the used data feature as potentially relevant. It was unprocessed: it simply
12 Chapter 1. Introduction
data. Several models, model parameters and preprocessing methods were investi-gated and evaluated. Examples of models include decision trees, linear regression, support vector machines, neural networks, and k-nearest neighbors. Training time wasn’t much of an issue, provided that it’s in the order of days, not weeks.
1.5.5 Validation
Validation was done by utilizing a brute force approach for the models, model pa-rameters and preprocessing methods. Additionally, looking at the generated decision trees and confusion matrices of the best models adds to the comprehension of the model results and was thus also used for validation.
1.6
Ethical considerations
Data privacy issues are a hot topic lately. This is illustrated with the approaching date of the 25th of May, 2018, on which the General Data Protection Regulation will take effect [22] and the large impact this has on entities processing data [48]. The act of linking NPS responses to usage data on a per-user basis lies undoubtedly in a legal and ethical gray area. After having discussed this with their legal department, Topicus has given one-time permission for data processing as described in this thesis with the following arguments.
• The purpose of this study is to check the viability of predicting NPS responses based on usage data. It does not entail or build upon a practical application. • The data is pseudonymised: any fields relating to individual users are
13
Chapter 2
Background
This section gives background information on all relevant subjects discussed in this thesis, such that no external sources are needed to understand its content. This study focuses on predicting Net-Promoter Scores, explained in section2.1, using most of the approach of the field of web mining, outlined in section2.2. Machine learning is used to apply the predictions, discussed in section2.3. One field of research specific for repetitive patterns is discussed in section2.4.
2.1
Net-Promoter Score (NPS)
The Net-Promoter Score is a metric to measure customer loyalty and to some extent customer satisfaction [49]. Respondents are asked to answer one question:"How likely is it that you would recommend our system to a friend or colleague?". The answer score is based on a scale of 0 to 10. Respondents giving a 9 or 10 are calledPromotersand are considered loyal users that stimulate company growth by way of word-of-mouth advertising: they are likely to promote the system to others. Respondents giving a score of 0 to 6 are calledDetractorsand are considered users that are to some extent dissatisfied. Respondents giving a 7 or 8 are calledPassives. They fall between the categories of Promoters and Detractors and could be labeled as moderately satis-fied users who would easily switch to a cheaper system. The system’s NPS value is calculated by usingN P S= P romotersrespondents−Detractors×100. Or, put differently:
N P S= (%P romoters−%Detractors)×100
As such, the range is -100 to 100. Passives are added solely to the total respondents and shift the NPS value closer to zero.
The NPS questionnaire is supplemented with one or more requests for elaboration to the answer on the main question. From a corporate perspective, this is useful for a deeper analysis of user attitude towards the system.
The validity and reliability of this metric is much debated in scientific studies [21,
24,33,36,37,44]. Most of these studies focus on the inability to measure satisfaction and its inherent nuances: only a few such as [21,36] claim the NPS does not actually measure loyalty. Irrespective of the extent of its validity, companies use the NPS metric to ascertain their overall performance which encourages more research into the subject.
2.2
Web usage mining
14 Chapter 2. Background
services to their users, website owners constantly try to improve their websites. This is often done using explicit feedback from their users, but a less time and resource intensive way to collect this data is through the use of web mining [13]. This area focuses on analyzing the available data of a website to discover patterns that can lead to an optimization of the offered services. Web mining can be divided into three categories.Web content miningfocuses on the information that is served on web pages, web structure miningfocuses on the links between web pages, andweb usage miningis all about the behavior of users.
Analyzing user behavior within an application can give interesting insights. A few of areas using this analysis are decision support in business, marketing and web design, personalization and recommendations [12,47], and web caching. Many studies into web usage mining focus on the areas of e-commerce and search engines. Three main tasks are identified with web usage mining [58].
Preprocessing Often referred to as the most time consuming task in the process [29], preprocessing is about preparing the data for the next task. Difficulties lie (among other things) in identifying individual users, dividing a user’s data in different sessions and handling missing data due to cached page views. Sometimes content preprocessing is also necessary. For example, pages can be classified according to their subject or in the case of e-commerce, product class. The same goes for structure preprocessing, e.g. classifying a web site into a hierarchical product class model in e-commerce.
Pattern discovery There are several techniques used in web usage mining for pattern discovery.Statistical analysisis the most common technique. It looks at descrip-tive statistics such as frequency, mean and median values about page visits, visit time, visit length, active users, user session length, etc. Another technique is association rule discovery. It looks at sets of pages that are often accessed together in a single session, irrespective of whether the pages are directly connected through hyperlinks. For example, in a web shop this might show that users shopping for electronics often also shop for sports clothing. This might indicate to the web shop owner that those categories could be placed closer together. The apriori algorithm is one of the most commonly used algorithms. Cluster-ingtries to group pages or users together that have similar properties. This is especially useful when giving personalized recommendations to users. Classi-ficationattempts to categorize users, pages or sessions into predefined classes. Examples of classifiers are neural networks, decision trees, naive Bayesian and k-nearest neighbors. This can be used for targeted marketing. Finally,sequential pattern mininglooks at temporal patterns in the scope of multiple sessions. A few examples are trend analysis, change point detection and similarity analysis. This task is called the pattern extraction phase in the current project.
Pattern analysis This task intends to draw conclusions from the discovered patterns. Commonly used mechanisms for analysis are SQL and OLAP operations with data cubes. This study uses machine learning to find predictive value in the patterns found in the previous step. The model training phase is aimed at this.
2.3
Machine learning
2.3. Machine learning 15
1959, defining it as "the field of study that gives computers the ability to learn without being explicitly programmed" [50]. Put differently, machine learning algorithms learn a mapping function from data, such that they can generalize that to new, unseen data.
The general process of building a machine learning model is as follows. One starts with a dataset in which each row is a data point called asampleand each column is a feature(sometimes also called anattribute). These features are values for each sample that are used by the model to make its predictions. This dataset is split into two subsets: a training and a test dataset. This training dataset is used to train the model, after which the model’s performance is measured by applying the model on the test dataset. This performance can be increased by preprocessing the dataset, e.g. using normalization or outlier removal. A well-performing model is highly generalizable to new data.
The two largest directions of machine learning are supervised [56] and unsuper-vised learning [18,46].Supervisedlearning makes a predictive generalization based on a training dataset where thetarget attribute(orlabel) is known. If the outcome data type is discrete, it uses classification methods. If the outcome data type is continuous, it uses regression methods. Unsupervisedlearning is not based on training data. It tries to discover patterns based only on input data. There are also other directions. Examples are semi-supervised learning [9], in which only part of the classes of the training data is known, and reinforcement learning [61], in which a model learns based on continuous feedback. This study uses supervised learning since the focus is on training a model so that it can make predictions.
The dataset used for training has to be of certain quality. If the dataset is full of errors, missing data or otherwise of low quality, the model becomes useless. Several preprocessing methods can be used to deal with this.
Normalization can be applied to prevent dominance of certain features and pre-vent computing problems. This technique puts the features in the same range, for example by subtracting each value from that feature’s mean and dividing by the feature’s standard deviation.
A dataset might contain samples that are exceptions to the general rule and are thus not representable. There are various algorithms to detect such outliers, such as DIS, kNN and RNN [68].
Most models can not deal with missing values in the dataset. One solution is to simply discard a sample that does not have values for each feature. This has several drawbacks such as adding bias and decreasing representativeness. A better solution is data imputing. This is a concept similar to interpolation: it replaces missing data with estimated values.
16 Chapter 2. Background
One pitfall that must be avoided with predictive modeling is being on one end of the bias-variance tradeoff. High variance means that a model is sensitive to small fluctuations in the training set. The model then fits the training data too well, but not any unseen data: the model is not generalizable. This is also known as overfitting. On the other hand, bias means too many assumptions are made and the model is thus not sensitive enough to the training set, resulting in underfitting.
One commonly used method of evaluating a model’s performance is k-fold cross-validation [59]. The dataset is split intokequally sized subsets. Fork times,k−1 subsets are used as the training dataset while the other one is used as the test dataset. The performances of thekevaluations are averaged.kis often chosen to be 10. This method eliminates the chance that a model’s performance evaluation is an outlier.
Model performance can be measured with different metrics. The error in this context is the difference between a predicted value and the value of the target at-tribute of a sample. For regression models, the most commonly used metrics areR2, mean squared error (MSE), root mean squared error (RMSE) and mean absolute er-ror (MAE).R2, also known as the coefficient of determination, is a measure of the variance explained by the model ranging from 0 to 1. If this value is 1 it means all variance in the data is explained by the model, but this most often means the model is a victim of overfitting. The MSE takes the mean of all squared errors, as the name suggests. The RMSE does the same and takes the root, changing the unit of this error metric back to the target attribute’s unit. The MAE again does what the name sug-gests and has the added advantage that the metric is better comprehensible. Both the RMSE and MAE have the advantage that they are in the original unit of the predicted value. The RMSE is more influenced by large error outliers, whereas the MAE is more affected by the error variance.
For classification, commonly used metrics are the confusion matrix and a few of its derivatives: precision, recall and accuracy. Each row specifies the predicted classi-fication, each column shows the true classification and each cell contains the amount of samples that have that combination of predicted and true value. The precision of each classification measures the proportion of accurate predictions to the predictions made for that classification. The recall of each classification measures the proportion of accurate predictions to the actual samples of that classification. The accuracy is the proportion of accurate predictions to the total amount of samples.
A few model concepts are outlined here. Note that each model has numerous variations, each with their own advantages and disadvantages. Several approaches can also be combined, either by joining the outputs [5,66] or by integrating multiple algorithms [4]. Each one listed below is used in this study, be it the original algorithm or a variation based on the original.
2.3. Machine learning 17
chance of overfitting; and Chi-square automatic interaction detection (CHAID), which prunes decision trees based on the chi-squared attribute relevance test. Artificial neural networks These simulate the behavior of the human brain. It
con-sists of many, simple units (neurons) that are activated by other neurons or input sensors connected to the environment. The connections between neurons are weighted. Learning occurs by changing the weights of connections until desired behavior results from the specific configuration. An advantage of neu-ral nets is that they perform better at incremental learning. Their accuracy is similar to decision trees, although training time is much longer [19,41]. One of the largest disadvantages is the lack of explanation. The logical steps of the process with which a neural network algorithm comes to a result is practically impossible to comprehend by humans. Neural nets can be used for both clas-sification and regression tasks. Deep learning is a variation that uses multiple hidden layers of neurons.
Naive Bayes These classifiers are based on Bayes’ theorem. They assume all features are independent, simplifying the probabilistic calculations. This assumption is rarely true, hence the ’naive’ term. Despite the independence assumption, Naive Bayes classifiers often perform competitively. They are trained fast and scale well.
Support Vector Machines A Support Vector Machine places one or more separating hyperplanes between the data points in the training set. It tries to maximize the distance to all data points of the different classes. The side on which the data points are with respect to the hyperplane determines which class they belong to. An important advantage of this classifier is its independence on the amount of features. However, this technique has a fairly long training time and it needs the data to be in similar ranges. It can also work with regression problems. Rule induction These iteratively add and remove rules to come up with an optimal
set. Rule induction models are similar to decision trees, as they both use rules. An advantage is that rules are easily understandable by humans and computers (i.e. they can be expressed in programming language syntax without effort) and one’s own rules can be manually added. A disadvantage is that the model does not scale.
Linear regression Regression works with numerical values and tries to predict a continuous value. Linear regression tries to fit a linear equation to the observed data. Polynomial regression tries to do the same, but with a higher order equa-tion. The Generalized Linear Model (GLM) is an optimized variation on linear regression that is more flexible. Linear regression works well when the relation-ship between the features and the target attribute is linear (or polynomial), but can not properly handle situations where this is not the case.
18 Chapter 2. Background
this method is robust with non-linear relationships (as mentioned in the de-scription for linear regression) and it is relatively simple. However, its training time is long and is sensitive to unbalanced datasets.
2.4
Sequential pattern mining
Agrawal and Srikant introduced the problem of sequential pattern mining in 1995 [1]. Their goal was to find patterns in sequences, specifically with the use case of customer transactions in retail. In the scenario of video rentals: if customers typically rent "Star Wars", then "Empire Strikes Back" and then "Return of the Jedi", a sequential pattern is identified. The input is a database of customer transactions, having three fields: customer identification, transaction order and the items contained in that transaction. The transaction order field is often a date and/or time value. Continuing the video rental example, table2.1shows a possible customer transaction database. Quantities are not taken into account.
TA B L E 2 . 1 : Example customer (video rental) transaction database used as input for sequence pattern mining
customer ID transaction date items items(shortened)
1 2011-03-01 (Battlestar Galactica, Star Wars) (B, S)
1 2011-03-03 (Empire Strikes Back) (E)
2 2011-05-05 (Caprica, Star Wars) (C, S)
2 2011-05-06 (Alien, Empire Strikes Back) (A, E) 1 2011-05-07 (Minority Report, Return of the Jedi) (M, R) 2 2013-06-07 (Killjoys, Return of the Jedi) (K, R)
Each product (or video in this example) is defined as anitemand each transaction as anunordereditemset,eventorelement. Note that the parentheses are usually omit-ted when denoting an itemset of length one. Items in the same itemset are written in alphabetic order, even though they are in an unordered set. To transform a customer transaction database into a format used for sequential pattern mining, each itemset is grouped per customer and ordered by transaction date. An ordered list of transac-tions is called asequence. The keys of a sequence database are only used as sequence identifiers. Table2.2shows the mapping of the terminology used in literature onto the real-life example. The purpose of table2.2is to aid in understanding the original problem of Agrawal and Srikant.
Table2.3shows the sequence database of our example. This is the format that is analyzed in sequential pattern mining algorithms. SID is short for sequence ID.
Sequential patterns have to adhere to more requirements. The minimumsupport (orminsupport) is defined as the minimum amount of sequences a pattern occurs in. Patterns that occur at least inminsupport sequences are calledfrequent patterns. Additionally, frequent patterns must bemaximal. This dictates that a pattern can not be a subpattern of another frequent pattern.
2.4. Sequential pattern mining 19
TA B L E 2 . 2 : Sequential pattern mining terminology mapping
terminology of [1] terminology in a real-life example example value
item product (or video) S
itemset/element transaction (BS)
sequence customer history <(BS)E(MR)>
sequence database transaction history {1: <(BS)E(MR)>, 2: <(CS)(AE)(KR)>}
TA B L E 2 . 3 : Example sequence database
SID sequence 1 <(SB)E(RM)> 2 <(SC)(EA)(RK)>
Countless algorithms have been developed since the initial problem was first proposed by Agrawal and Srikant. Each approach since then has had its optimiza-tions. In addition, numerous variations of the original problem required specifically tailored solutions. Giving an introduction to several of the main approaches will sup-port comprehension of the field of sequential pattern mining. All approaches use the apriori property defined by Agrawal and Srikant that says that a pattern is frequent only if all of its subpatterns are frequent. The AprioriAll algorithm [1] was the first to use this principle.
The Generalized Sequence Pattern (GSP) algorithm [57] was the first practical algorithm that built upon AprioriAll. Each item is counted during the first database pass and all non-frequent items are discarded. A loop is entered in which each itera-tion finds patterns of increasing length. In the candidate generaitera-tion step, pairs found in the previous iteration are merged. If, for example, the previous iteration foundabc andbcd, these are merged intoabcd. In the candidate pruning step, candidates are pruned that contain an infrequent subsequence.abcd would be pruned ifacdwas infrequent. Candidates are eliminated in the next step if their support proves to be in-sufficient, based on a traversal of the sequence database. This loop continues until no candidates or no frequent patterns can be found. Disadvantages of this approach are the amount of database passes and the amount of generated candidates. A strength compared to AprioriAll is the candidate pruning. It uses a horizontal format, illus-trated in tables2.3and2.4.
The algorithm Sequential Pattern Discovery using Equivalent Classes (SPADE) [67] uses a vertical format. Take the sequence database shown in table2.4, with minsup-port=2. SPADE first converts this to the vertical format shown in table 2.5a. EID is short for element ID (or event ID), of which the values are shown in factors of ten to emphasize the distinction between the SIDs. The conversion to vertical format re-quires only one database scan. Next, theID listsof each item are generated, partially illustrated in table2.5b. The ID lists of infrequent items are discarded, such as item e in our example. Candidates of length 2 can be found by joining rows of the ID lists of candidates of length 1: if they share the same SID and if their EID is sequential, join them. Table2.5cshows the result of joining a with b and vice versa, and table2.5d
20 Chapter 2. Background
be found anymore. SPADE reduces the amount of database scans, but still requires large sets of candidates.
TA B L E 2 . 4 : Example sequence database for the SPADE algorithm
SID sequence
1 <a(abc)(ac)d(cf)> 2 <(ad)c(bc)(ae)> 3 <(ef)(ab)(df)cb> 4 <eg(af)cbc>
TA B L E 2 . 5 : Example progression of SPADE
SID EID itemset
1 10 a
1 20 abc
1 30 ac
1 40 d
1 50 cf
2 10 ad
2 20 c
2 30 bc
2 40 ac
3 10 ef
3 20 ab
3 30 df
3 40 c
3 50 b
4 10 e
4 20 g
4 30 af
4 40 c
4 50 b
4 60 c
(A) Sequence database in vertical format
a b . . .
SID EID SID EID . . .
1 10 1 20 . . .
1 20 2 30
1 30 3 20
2 10 3 50
2 40 4 50
3 20
4 30
(B) ID lists of patterns length 1
ab ba . . .
SID EID (a) EID (b) SID EID (b) EID (a) . . .
1 10 20 1 20 30 . . .
2 10 30 2 30 40
3 20 50
4 30 50
(C) ID lists of patterns length 2
aba . . .
SID EID (a) EID (b) EID (a) . . .
1 10 20 30 . . .
2 10 30 40
(D) ID lists of pattern length 3
2.4. Sequential pattern mining 21
our patterna, the frequent items area,b,_b,c,dandf. The length-2 patterns with prefixaare found to beaa,ab,(ab),ac,adandaf. Each is considered a prefix and their projected databases are generated. The projected database of prefixaaconsists of <(_bc)(ac)d(cf)> and <(_e)>. As none of the items occur in both sequences, there are no frequent patterns. Table2.6cshows the projected databases of prefixac. This contains frequent patternsa,bandc, resulting in the length-3 patterns with prefix ac beingaca,acb andacc. Doing this again for prefixacb results in the projected database in table2.6d. This process is recursively repeated for the frequent patterns found in each projected database until no more frequent patterns can be found. Even though the projected databases keep shrinking, constructing them physically is costly. This can be minimized by using pseudo-projection: storing the starting index of the projected suffix instead of the whole sequence. This works if the database can be held in memory. If it can’t, a combination of physical and pseudo projection can be made.
TA B L E 2 . 6 : Example progression of PrefixSpan
SID original sequence 1 <a(abc)(ac)d(cf)> 2 <(ad)c(bc)(ae)> 3 <(ef)(ab)(df)cb> 4 <eg(af)cbc>
(A)
a-projected db <(abc)(ac)d(cf)> <(_d)c(bc)(ae)> <(_b)(df)cb> <(_f)cbc>
(B)
ac-projected db <(ac)d(cf)> <(bc)(ae)> <b> <bc>
(C)
acb-projected db
<(_c)(ae)>
<c>
23
Chapter 3
Feature discovery
The first part of this project answers research question 1 by determining what might be an influence on the individual NPS responses. This is necessary for the subsequent phases, because performing arbitrary magic without a direction on a large dataset doesn’t get viable results. This introduction first describes the format of data features and the reason for the general approach that was used. Section3.1describes the ef-forts and steps taken, including highlights of the results stemming from the different steps, while section3.2lists the actual results of the overall process of feature discov-ery. Section3.3concludes this chapter by listing a selection of data features that this project focuses on.
Each feature is meant to become an aggregation of a user’s usage data into one or several metrics. An example of the result of such a data feature analysis could be "During the 90 days prior to his NPS response, user x has logged in 20 times per day on average". This has several components. The data feature in this case is the daily average login frequency. The result format is thus a floating point number. If the machine learning algorithm chosen later on requires discrete values, such a trans-formation will be applied. The time period of 90 days is implicit in all data feature definitions in this chapter and is an attempt at normalizing the available dataset per NPS response. This exact duration is selected to have a balance between having suf-ficient log data available, and potential issues resulting from improvements made to the system’s structure.
The purpose of this part of the research is acquiring a prioritized list of data features to focus the usage data analysis efforts on. In an ideal situation, this would be accomplished by performing a full-fledged user experience study. Unfortunately, this is out of the scope of this project and that is why a heuristic approach was chosen instead.
3.1
Efforts
The following subsections describe the efforts taken to discover possibly relevant features in semi-chronological order.Semibecause some efforts took place in parallel, which is stated explicitly if relevant. In addition to the different activities described here, several features were also discovered during undocumented, informal conver-sations with Topicus’ developers, data analysts and other friends. The results of these chats have been included in section3.2. Whenever a term such as "interesting" or "rel-evant" is used in this chapter, it means the construct in question is directly relevant for this research project.