‘Effective visualization of strategy’
Master Thesis
FACULTY OF BEHAVIOURAL MANAGEMENT AND SOCIAL SCIENCES UNIVERSITY OF TWENTE
Name:
Z.I.M. Geuke
Student number:
s1209957
Supervisors:
Dr.ir. E. Hofman R. Siebelink MSc
2
Abstract
Appropriate management of strategy is essential for the survival and success of businesses. Effective communication is key for effective implementation of strategy. The use of visualization in strategy communication has effects on the quality of the communication. Various studies find contradictory results regarding whether these effects are positive or negative. A systematic discourse on how visualization can be successfully implemented in strategy communication does currently not exist. In this study, the first step towards creating such a discourse is made. Requirements for the effective use of strategy visualizations were formulated. The key drivers of these requirements were determined to be strategic content, strategy communication, functional visuals and usability. An existing strategy visualization method, technology roadmapping, was analyzed using the requirements. Technology roadmaps scored predominantly positive, according to the formulated requirements, but showed some room for improvement. A recommendation is made that addresses the
3 Table of contents
Abstract ... 2
1. Introduction ... 4
2. Research Design ... 6
2.1 Problem statement ... 6
2.2 Research objectives and questions ... 6
2.3 Research model ... 7
2.4 Methodology ... 8
3. Problem investigation: ... 16
3.1 Strategy: definition and description ... 16
3.2 Strategy communication: definition and description ... 17
3.3 Strategy communication: managing change ... 18
3.4 Strategy communication: obstacles ... 19
3.5 Strategy communication: effectiveness ... 21
3.6 Visualization: definition and description ... 22
3.7 Visualization in communication: benefits & disadvantages ... 22
3.8 Visualization methods ... 25
3.9 Visualization of strategy ... 26
3.10 Visualization of strategy: design criteria ... 27
3.11 Stakeholders of strategy communication ... 29
3.12 Summary of literature review ... 30
4. Treatment design ... 32
4.1 Introduction ... 32
4.2 Key driver method ... 32
5. Case: technology roadmapping ... 43
5.1 Scoring the technology roadmap ... 43
5.2 Analysis ... 46
5.3 Validation ... 49
5.3 Recommendation ... 51
6. Conclusion ... 56
7. Discussion ... 57
7.1 Findings ... 57
7.2 Comparison to other studies ... 58
7.3 Limitations ... 58
7.4 Implications ... 59
4
1.Introduction
The world is perpetually changing, becoming increasingly complex. conditions change and uncertainty arises. Businesses have to continuously adapt accordingly, to cope with the changing circumstances (Grant, 2003). The survival and success of businesses is affected by its ability to manage its strategy (Teece, Pisano & Shuen, 1997). A strategy can be defined as a pattern in decisions with regards to the intended approaches to change (Mintzberg, 1978).
Hrebiniak (2006) states that the implementation of a strategy yields several problems. These problems share a common driver, as most relate to the fact that strategy formulation and strategy implementation are interdependent and often executed by different actors. Careful strategy design does not always translate to effective execution of said strategy.
Hrebiniak argues that communication, through transfer of knowledge and achieving coordination across operating units within a business, is vital to strategic success.
Communication during strategy execution quickly becomes a challenge, since organizations oftentimes consist of multiple layers, different departments, and various functions, all of which can play different parts in said execution (Hrebiniak, 2006).
The stakeholders of strategy communication are all parties that come into contact with the strategy, its communication, implementation and consequences. The stakeholders can be divided into four categories. Top management (Breene, Nunes & Shill, 2007), middle
management (Shi, Markoczy & Dess, 2009), regular employees (Hambrick & Canella, 1989) and shareholders (Kaplan & Norton, 2004; Velasco, 2006). These stakeholders must
collectively make sure that the strategy is formulated, designed, communicated, and implemented in such a way that all parties are sufficiently informed about the relevant implications of said strategy.
Lengler & Eppler (2007) emphasize that a communicator should not only be occupied with conveying the message, but also shape the message to the recipient’s context, in such a way that this recipient can reconstruct the knowledge, integrate it and put it to meaningful action. Li, Guo-hui & Eppler (2011) found four dominant problem areas of strategy communication: awareness and attention to strategy information, understanding and
comprehension of the strategy, agreement and support of the strategy, and retention or recall of the strategic content.
There are multiple methods of communication. Many businesses, due to their size, have no other option than to use mediated communication methods for strategy
5 and interactions (Sommer & Loch, 2004). In order to communicate strategies of larger
complexity, communication methods have to be appropriate and of sufficient quality.
The communication methods that businesses use to communicate their strategy are not always of sufficient quality. Cummings & Angwin (2011) found that many employees of organizations are not sure what they are meant to do to enact the company’s strategy. In a survey by Hunter & O’Shannassy (2007), 79% of the respondents indicated the need to more effectively communicate strategy internally. This suggests that current communication methods are often lacking in quality.
A solution for this lack of quality in communication methods can be found in the conceptualization and visualization of strategy (Farace, Monge & Russell, 1977; Foos & Goolkasian, 2005; Kernbach, Eppler & Bresciani, 2015). Burkhard (2005a) found evidence that there is a huge potential when complementary visualizations are used during strategy implementation, but a systematic discourse on how to actually implement visualization in strategy communication is currently missing.
The findings of Griffin (1995), Bresciani & Eppler (2009) and Vliegen & van Wijk (2006) suggest that the use of visualization in strategy communication affects communication quality negatively. Visual representations could for example be interpreted differently, and strategy visualizations might not always be fit for use given the specific context.
This study is intended to investigate the use of visualization in the communication of strategy. The findings of various scholars, such as those stated above, suggest that there is a fine line between the effective use of visualization in strategy communication, and making communication of strategy more difficult by (ineffectively) implementing visualization.
The objective of this study is to find how strategy can be effectively visualized, so that it improves the quality of strategy communication between stakeholders. Ultimately, the goal of this study was to make a recommendation regarding the effective implementation of visualization in strategy communication. This recommendation has been constructed by creating a substantiated list of requirements that effective strategy visualizations have to meet in order to be considered effective. The requirements for strategy visualizations were
determined using the design cycle from the design science methodology (Wieringa, 2014), after which these requirements have been analysed using the key driver method (Heemels & Somers, 2006).
In order to formulate the recommendation, a strategy visualization method was used as a case. This visualization method has been analysed using the newly constructed list of
6
2. Research Design
2.1 Problem statement
Businesses have to continuously adapt in order to cope with changing circumstances and conditions (Grant, 2003). They do so by implementing new strategies or adapting their current strategy. In order for strategies to work, communication is key (Hrebiniak, 2006). Communication is a complex and time-consuming process. Larger businesses tend to use mediated communication methods, which are characterized by the use of information systems, due to their multiplicative power and its speed to reach a larger audience (Fidler & Johnson, 1984). The use of mediated communication does however pose a weakness, as mediated communication methods have a lower effectiveness when it comes to communication of strategies of higher complexity (Fidler & Johnson, 1984).
A solution for decreasing the complexity through communication could be found in conceptualization and visualization of strategy.Various scholars have found the use of visualization to have positive effects on the quality of strategy communication (Farace, Monge & Russell, 1977; Foos & Goolkasian, 2005; Kernbach, Eppler & Bresciani, 2015). Others have found that the use of visualization can have negative effects on the quality of strategy communication (Griffin, 1995; Bresciani & Eppler, 2009; Vliegen & van Wijk, 2006).
The problem addressed in this study is the contradiction in the results of various scholars regarding the effects of the use of visualization in strategy communication. Their contradicting results suggest that the use of visualization in strategy communication can have positive effects, but only when done properly. How this can actually be done seems not to be clear. Burkhard (2005a) supports this statement, as he states that there is no clear discourse on how to implement visualization in strategy communication. He found evidence that there is a huge potential when visualizations are used for strategy communication.
The goal of this study was to make a recommendation regarding how strategy can be visualized effectively so that it improves the quality of strategy communication between stakeholders. This recommendation was formulated using a case, the strategy visualization method of technology roadmapping. This visualization method was used as the base of the recommendation, it has been analysed and suggestions towards its improvement have been.
2.2 Research objectives and questions
7 Main objective: To make a recommendation on the effective use of strategy visualization to improve strategy communication between stakeholders.
A: How to effectively visualize strategy in order to improve communication of strategy between stakeholders?
Sub-objective 1: Define strategy communication
A: What is strategy communication?
Sub-objective 2: Determination of effectiveness in strategy communication
A: What determines effective strategy communication?
B: What obstacles are there that hinder effective strategy communication?
Sub-objective 3: Defining strategy visualization and its use
A:How can strategy be visualized?
B: What determines effective strategy visualization?
C: How does the use of visualization affect strategy communication?
Sub-objective 4: Determination of the role of stakeholders in strategy communication
A: Who are the stakeholders in strategy communication?
B: How is communication of strategy different for the different stakeholders? C: What requirements do the different stakeholders have for strategy visualization?
2.3 Research model
A research model has been developed to give an overview of the course of this study. This research model is based on the theory by Doorewaard & Verschuren (2007) and is shown in Figure 1. The essence is: Visualization theory has been consulted to look into effective visualization methods, and requirements for effective strategy visualization have been
8
Figure 1: Research model, based on theory by Doorewaard & Verschuren (2007)
2.4 Methodology
2.4.1 Design cycle
2.4.1.1 Description
Assuming that a new, effective strategy visualization is to be created, it has to be designed systematically. Design can be done using different techniques, but in this study the design cycle from the design science methodology has been (partially) used (Wieringa, 2014). This method has been selected due to the fact that it is a rational process meant for designing treatment, that incorporates the requirements from different stakeholders. Wieringa states that treatment is a better term to use here than solutions, as there is a possibility that the designed ‘solution’ may solve a problem only partially or not at all, it could also introduce new problems.
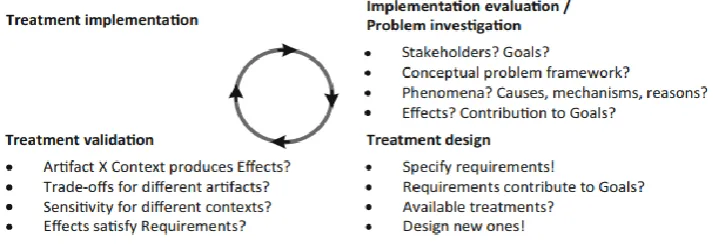
According to Wieringa (2014), the design cycle is decomposed into three tasks, namely, problem investigation, treatment design, treatment validation, described more thoroughly in the next section. The design cycle is part of a larger cycle, the engineering cycle, which also incorporates treatment implementation and implementation evaluation, shown in Figure 2 below.
[image:8.595.119.476.659.781.2]9 The scope of this study limits itself to parts of the first three steps of the design cycle. The problem was investigated and put into perspective, and a set of requirements for a
treatment to this problem was constructed. This set of requirements was then be used to assess an already existing treatment. After analysing the existing treatment, a recommendation has been written for the design of a more effective treatment for the problem at hand. This recommendation was then be validated by performing an expert review.
2.4.1.2 Design cycle steps
Problem investigation: The researcher sets out to describe what phenomena must be improved, and why, by doing so, the problem will be identified, described, explained and evaluated. The stakeholders of the problem have to be determined, and their role with regards to the problem described. A conceptual framework is to be created so that the research
problem can be framed, putting it into the right perspective.
Treatment design: The researcher must specify requirements for a treatment to the problem, and must note assumptions that are made due to the context of the problem. Also requirements that stakeholders have for the treatment have to be considered. If there are any treatments already available, these can be looked into, to find strengths and weak spots. Ultimately, a new treatment is to be designed.
Treatment validation: The researcher sets out to validate the designed treatment. Does the designed treatment satisfy the requirements that have been listed for it. Does the treatment produce the effects that it was designed to do?
The next section will describe how and to what extent the three steps of the design cycle will be followed through with in this study.
2.4.1.3 Problem investigation
During the first step of the design cycle, literature research has been done in order to create a baseline of understanding regarding the problem at hand. Next, the researcher set out to find out what research has already been done.
The topics that are relevant to this research are strategy communication, effective communication, visualization of strategy and stakeholders of strategy communication. The goal here is to answer the research sub-questions that have been formulated for these topics.
First, a literature review has been done to elaborate on strategy communication, this was done to figure out what content is communicated exactly, and what techniques or
methods are currently used in order to communicate said strategy. Subsequently, literature has been consulted to determine when strategy communication is considered to be effective, and what obstacles one can run into while trying to communicate strategy effectively. Next, visualization literature was reviewed to see how strategy can be visualized, how visualization can be incorporated into strategy communication, and how this affects said strategy
10
2.4.1.4 Treatment design
Now that the specific problem has been defined, it can be addressed. In order to address the problem with a treatment, a list of requirements for said treatment has to be constructed. These requirements can be stakeholder requirements, system requirements or organizational requirements. These requirements also have to be weighed appropriately to the context.
In order to be able to create a requirements list that provides a structured overview, rather than just an unordered list of requirements, the key driver method was used. The key driver method is a structured approach to obtain system requirements in a systematic way and provide an structured overview of said requirements (Heemels & Somers, 2006). For this reason, the key driver method fits well in the overall structure of the design cycle.
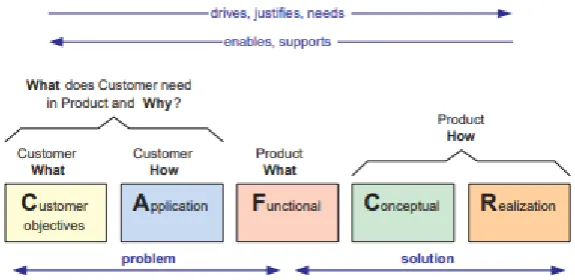
[image:10.595.174.462.330.470.2]The key driver method fits in the broader framework of the CAFCR methodology, which is a decomposition of a system architectural description into five views, as shown in Figure 3below.
Figure 3: The CAFCR Methodology (Heemels & Somers, 2006)
The key driver method can considered to be a ‘CAF submethod’ of CAFCR. The key drivers represent the main customer objectives (C view), the key driver method helps to derive the more detailed and quantified system requirements (F view). A bridge between key drivers and requirements is a layer of application drivers, as represented in the A view (Heemels & Somers, 2006). The key and application drivers in the customer views (C&A) can be linked via requirements (F) to design choices in the other views (C&R).
A more thorough explanation of the key driver method, how it is used to gather the relevant requirements, and its application within this study will follow in chapter 2.4.2.
The results of the application of the key driver method have been used to formulate a recommendation regarding the use of strategy visualization in strategy communication. An elaboration on how this recommendation has been constructed will follow in chapter 2.4.3.
11
2.4.1.5 Treatment validation
After the recommendation has been constructed, the components of this
recommendation must be validated. This validation must be done to justify that the treatment contributes to the stakeholder goals, if it were to be implemented (Wieringa, 2014). The goal of validation is to build a theory of the implemented treatment in a real world context.
One way to validate is by expert opinion (Wieringa, 2014). This method has been used to validate the findings of this study. The findings, analysis, and recommendation that were constructed during this study have been submitted to an expert in the field. This expert imagines how the proposed recommendations would interact with the problem context, were they to be applied. The expert predicts whether the effects satisfy the stakeholder
requirements. If the anticipated effects of implementation do not satisfy the predetermined requirements sufficiently, this is a reason to redesign the treatment.
Validation by expert opinion only works if the expert understands the proposed treatment, is able to imagine realistic problem contexts, and makes reliable predictions about the effects of the treatment in this context. Within expert opinions, negative opinions are more useful than positive opinions, as negative opinions give early indications of improvement opportunities, as well as indications of conditions of practice that have not been thought of by the researcher.
The researcher set out to find an expert that is knowledgeable within the fields that are relevant to this study, business strategy, (effective) strategy communication, strategy
visualization, and strategy stakeholders. This expert was used as instrument to observe, by imagining, how the recommendations made would interact with the actual problem context.
2.4.2 Key driver method
2.4.2.1 Description
This method is generally used for the design of complex products, where different parties have (possibly contradicting) requirements and needs regarding the actual design. During this study, a visualization that is used for strategy communication was considered to be the ‘product’, also, the stakeholders of strategy communication (strategy executives, top- and middle-management as well as their subordinates) were considered to be the ‘customer’. The functional viewpoint used within this study is the viewpoint of those that formulate and wish to implement the strategy.
12
2.4.2.2 Key driver method steps
1. Define the scope specific
- Who are considered to be the stakeholders in this situation, and what is considered relevant to them? How are the stakeholders interconnected, and how does this translate to certain requirements? Does the context of strategy communication and the use of visualization within said communication create any new requirements that are not directly related to the stakeholders?
2. Acquire and analyze facts
- Extract facts from product specifications and ask why questions about the
specification of existing products. Literature was reviewed to find whether strategy communication in itself introduces requirements for a strategy visualization. A stakeholder analysis was done to construct the stakeholder requirements for strategy visualizations.
3. Build a graph of relations between drivers and requirements
- List all requirements from all stakeholders, and find the key drivers by comparing similarities of requirements, also look for contradicting requirements, build a graph of the relations between drivers and requirements. One requirement can serve multiple key-drivers, and one key-driver results in many different requirements.
4. Obtain feedback
- In order to put the graph of requirements and drivers to the test, it can be discussed with different stakeholders. This could result in new insights or requirements that had previously not been considered.
2.4.2.3 Requirements gathering
To be able to make a valid list of requirements, a set of steps has to be followed through with (Muller, 2011):
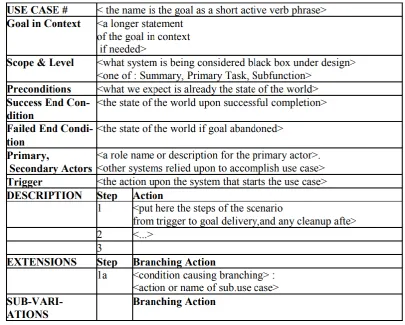
1. Stakeholders and their wishes, wants, and needs
- It has to be clear who the stakeholders are, what they want to achieve with the product, and why. This can be done by, for example, doing a stakeholder analysis (Harrison & St John, 1998). The stakeholders’ requirements were formulated by reviewing
13
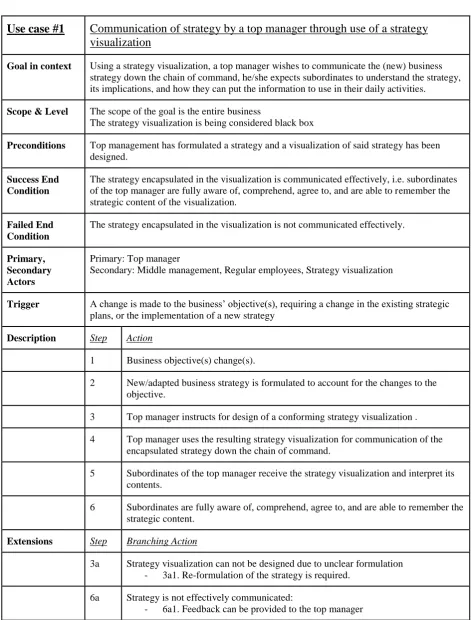
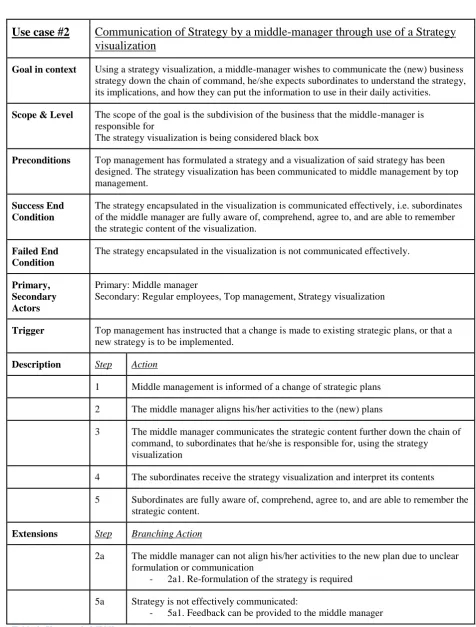
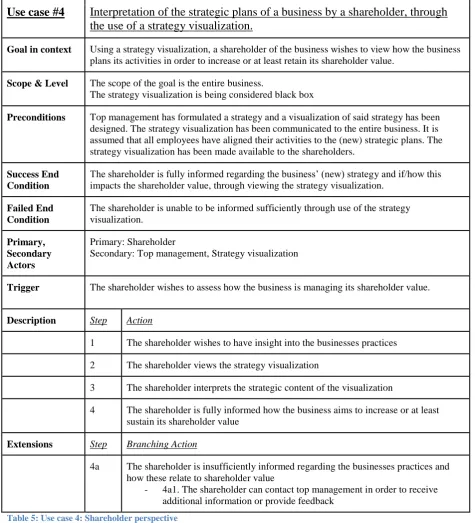
Figure 4: Usecase template (Cockburn, 2000)
2. Mandatory and non-mandatory requirements
- A distinction has to be made between requirements that must be fulfilled, and requirements that are optional, such as customer wishes.
3. Consider the product to be a black box
- One of the main characteristics of a requirement is that they describe what has to be achieved by the product, rather than how it has to be achieved.
4. Requirements for requirements
- There are several requirements for the requirements themselves: - Specific, what exactly is needed?
- Unambiguous, so that there can be no different expectations of the outcome - Verifiable, requirements must be able to be verified after realization
- Quantifiable, a quantifiable requirement makes it able to verify the requirement
- Measureable, also to support verification of the requirement
- Complete, requirements must be as complete as possible, completeness is a dangerous criterion however, as in practice, requirements are never complete. - Traceable, all requirements must be able to be traced back to their origin - Next to the requirements for requirements listed above, there are three requirements
14 Understandable, and have a Low threshold. These three requirements may be
conflicting with requirements prescribed in the requirement management process. Many problems in practice can be traced back to violation of the human-imposed requirements(Muller, 2011).
2.4.3 Recommendation: Case study
2.4.3.1 Preparation of the recommendation
After determining the key drivers of effective use of strategy visualization in strategy communication, these key drivers can be used to formulate a recommendation. This
recommendation is made using an existing strategy visualization method as base. This strategy visualization method was analysed using the key drivers that have been formulated during the earlier phase. Ultimately, it is argued how the visualization method can be improved, why it should be improved, and how this can be done.
2.4.3.2 Technology roadmapping
In this study, the case of technology roadmapping has been used as base for the recommendation. The choice for this strategy visualization method has been made due to its presence in the industry and its flexibility in application (Phaal et al., 2004). Phaal et al. (2004) describes technology roadmapping to be a flexible visualization method that supports strategic and long-range planning. Technology roadmaps provide a structured, often graphical means for exploring and communicating between evolving and developing markets, products and technologies over time. Roadmaps can be considered to be dynamic business or system frameworks, that enable the evolution of a complex system to be explored and mapped, supporting innovation and strategy development and deployment at all levels (Phaal, Farrukh & Probert, 2009). Often, hierarchies of roadmaps are used, to enable information at different levels of granularity to be displayed
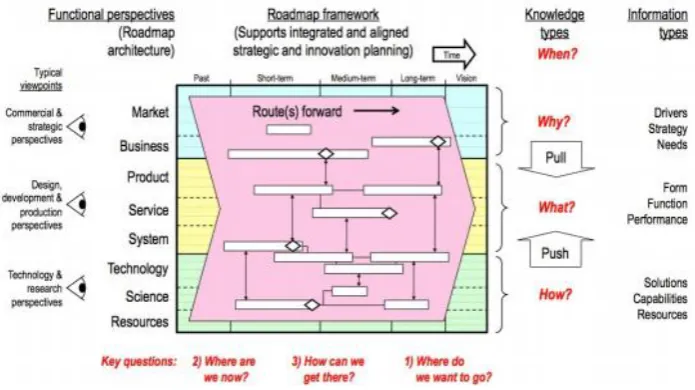
Within technology roadmaps, there are many different types of specific roadmaps, depending on the purpose of the roadmap, and the type of format used (Phaal et al., 2001). Examples of types of purposes are: Product planning, service/capability planning, strategic planning, long-range planning, knowledge asset planning, programme planning, process planning and integration planning. The different formats that can be used are the following: Multiple layers, bars, tables, graphs, pictorial representations, flow charts, single layer and text. The generic template of the roadmap can be viewed in Figure 5 on the next page:
15
2.4.3.3 Technology roadmapping design
Phaal, Farrukh & Probert (2015) designed the generic technology roadmap template, they claim this is the most flexible and powerful framework for the creation of roadmaps. It comprises a multilayered time-based chart, bringing together various perspectives into a single visual diagram. This type of roadmap enables both ‘demand’ and ‘supply’ side views to be represented, balancing ‘market pull’ and ‘technology push’. The roadmap framework links to the fundamental questions that apply in any strategic context:
1: Where do we want to go? Where are we now? How can we get there?
2: Why do we need to act? What should we do? How should we do it? By When?
Phaal, Farrukh & Probert (2015) state that roadmaps are simple, adaptable ‘strategic
lenses’, through which the evolution of complex systems can be viewed, supporting dialogue, alignment and consensus. They state that, although the generic format is helpful for
[image:15.595.128.476.92.287.2]developing strategy, it might not always be the best way to communicate said strategy, depending on context, purpose and audience. This already suggests that there is room for improvement in the current design.
16
3. Problem investigation:
In this literature review, the researcher showcases previous research regarding the relevant topics: strategy communication, effective communication, visualization of strategy
and stakeholders of strategy communication. The goal here is to answer the research sub-questions that have been formulated for these topics.
3.1 Strategy: definition and description
A strategy can be defined as a pattern in a stream of decisions with regards to the intended changes (Mintzberg, 1978). More specifically, business strategy can be summarized as the set of plans designed to achieve a business’ goals, and strategic management is the set of decisions and actions that result in the formulation and implementation of mentioned plans (Koskei, 2003). Strategic management guides the aspects of general management that have effects on the survival and success of businesses (Teece, Pisano & Shuen, 1997) Strategic management can be divided in three interdependent steps, strategy formulation, strategy implementation and strategy evaluation (David, 2011).
Strategy formulation consists multiple tasks, one is gathering and specifying the objectives and goals of the business, and another task consists of planning actions for actors within the business, these actions should be in accordance with the formulated objectives and goals (David, 2011).
According to Hrebiniak and Joyce (1984), strategy implementation is a set of actions regarding organizational structures, key personnel activities, and control systems designed to control performance with respect to the desired ends. Similarly, Floyd and Wooldridge (1992) state that implementation is the managerial interventions that align organizational actions with strategic intention. In order to be able to communicate strategy implementation, all
departments of the business are required to be appropriately aligned (Beer, 1980;
Venkatraman & Camillus, 1984). Noble (1999) combined several perspectives on strategy implementation, with a focus on the processes involved, this resulted in strategy
implementation being defined as the communication, interpretation, adoption and enactment of strategic plans.
Strategy evaluation is the third step of strategic management, where the process of strategy implementation is evaluated. During this third step, the business’ actions, as carried out during the implementation stage, are monitored, to verify whether they are in line with the business objectives or goals as described during the strategy formulation stage (David, 2011). If evaluation is properly carried out, this creates a closed loop, feedback from the
implementation can be used in the next formulation stage.
17
3.2 Strategy communication: definition and description
It is clear that there is a need for effective and sound inter-organizational
communication, in order to formulate, implement and evaluate strategies. The survival and success of a business is partly dependent on the effectiveness of its strategic management (Teece, Pisano & Shuen, 1997), therefore it is of importance that communication is of sufficient quality. It could be argued that the implementation stage of a strategy consists mostly of the communication of said strategy to all actors involved. Kaplan & Norton (2005) define strategy communication as “Communicating and educating employees about the strategy of the organization” (p. 18). They also state that effective communication to
employees about strategy, targets, and initiatives is vital if employees are to contribute to the strategy (Kaplan & Norton, 2005).
Hrebiniak (2006) states that the implementation stage always involves more people than the formulation stage. In addition to this, strategy implementation is usually played out over longer periods of time. Communication down the organization, or across different functions or departments, over a longer time span, becomes more of a challenge. Especially when the number of people involved is large, the challenge of effective strategy
communication becomes greater. Hrebiniak (2006) also argues that communication through transferring knowledge and achieving coordination across operating units within a business are vital to strategic success.
Beer & Eisenstat (2000) state that one of the major barriers in strategy implementation is poor vertical communication, this is in resemblance with what Hrebiniak (2006) argued. When strategies are formulated, this is usually done in the upper side of the chain of
command. In order to implement said strategy, it has to be communicated vertically down the organization, involving a larger amount of people.
Farace, Monge & Russell (1977) state that communication also plays a key role in overcoming resistance to innovations and in the reduction of uncertainty. Strategy being an innovation that has to be adopted by the entirety of the business, suggests that proper communication is vital to successful implementation of said strategy.
Hambrick and Cannella (1989) argue that employees are the people who will make a strategy work, requiring them to be fully informed about the intended changes to the current course of events and underlying intentions of these changes. Employees have to be ‘sold’ a strategy in order for it to work, requiring full understanding of said strategy. If the quality of the executed communication is not sufficient, thus not having ‘sold’ the strategy to
employees, this will result in insufficiently informed employees, limiting adoption of changes, and therefore making the implementation of a strategy less successful.
18
3.3 Strategy communication: managing change
Hrebiniak (2006) argues that there are two different approaches to managing large changes due to implementation of new strategies; sequential or complex change. A sequential intervention consist of smaller, more manageable pieces or proportions of the large change, over a longer period of time, whereas a complex change consists of all changes to be
implemented simultaneously during a usually shorter implementation horizon. Depending on the objectives of the implementation of a new strategy, and the anticipated time-horizon in which these objectives are to be achieved, different approaches are appropriate. Hrebiniak (2006) suggests that an organization that faces a large strategic change should always rely on sequential change, when there a sufficient time span to do so. It could however be the case that there simply is not enough time to perform all portions of the change step-by-step, where complex change becomes the favourable choice. Below, the benefits and disadvantages of the two types of change are listed.
Sequential change benefits from its step-by-step process, as this allows managers to reduce resistance to change, as the success of the first stages in the change process can be used to win over doubters who were originally against the entire intervention. Step-by-step sequential change also allows cause-effect analysis of the independent steps, since the degree of success during certain stages can be attributed to specific steps. Lastly, sequential change allows for incremental investment of time, money and effort. There is no need to “bet the entire house” on a new strategy, as small portions of an investment can be done with minimal risk, lowering the overall risk profile and uncertainty for the organization (Hrebiniak, 2006).
Sequential change has several disadvantages that can be attributed to one
characteristic. Sequential change takes time. Different parts of the change are spread over the course of months or even years. One disadvantage that results from this is that people lose sight of the ultimate goals of the change. Another disadvantage of the long implementation horizon of sequential change is the volatility of external factors, over the course of several months to years, competitors’ actions or plans could change, consumers could change in spending behaviour, rules and legislations presented by the government could change. Sequential change must always be ready to adapt to any of these external sources of change.
Complex change, in contrast to sequential change, benefits most from its
implementation horizon, as complex change can be done over much shorter periods of time. This shorter time span allows for quick adaptability to changes from external sources. Complex change allows large problems to be confronted faster, and simultaneously.
19 Sommer & Loch (2004) describe complexity as the amount of variables and
interactions, they however also state that the use of the term complexity is not consistent in literature. Using the definition of complexity of Sommer & Loch (2004), when there is a high amount of variables and interaction, this leads to increased difficulty in assessing optimal actions beforehand.
Fidler & Johnson (1984) define complexity as the number of dimensions along which an innovation can be evaluated by a potential receiver, which makes it an inherent
characteristic of said innovation, innovation here being the business strategy. They argue that a greater complexity leads to higher resistance to adopting a new strategy within the
organization. They also found greater complexities to be linked to a lower likelihood of successful strategy implementation.
In the context of strategy, the variables or dimensions that are most relevant for businesses are industry characteristics, environment, size, time span of change, and
objectives. Larger businesses, those that operate in uncertain industries and/or environments and businesses with more complex objectives over shorter time spans, and all possible combinations, are required to implement strategies of larger complexity to be able to cope with its conditions. This higher complexity might result in added risk, higher
inter-organizational adoption resistance, uncertainty and a lower likelihood of successful implementation (Fidler & Johnson, 1984).
The sequential change process as defined above, offers a method of reducing
complexity, it does this by spreading the objectives of a strategic change over a longer period of time, this enables the business to account for changes in the industry or environment, while taking its time to follow through with the steps required to make the larger overall change.
In turbulent, highly competitive and/or changing industries however, there could simply be insufficient time to apply the sequential change process. A business might not have the ability to timely react to external forces, and has to stay ahead. In order to be able to do so, the business must find other methods of reducing complexity, enabling complex change
Summarizing the relevance of the change approaches and strategy complexity, time spans of objectives are of great importance, change has to be made in an appropriate fashion, accounting for all relevant (both internal and external) factors.
3.4 Strategy communication: obstacles
Next to the varying complexities of strategies, there are more obstacles that prevent strategies to be communicated properly, e.g. Lengler & Eppler (2007) emphasize that the communicator should not only be occupied with conveying the message, but also shape the message to the recipient’s context, in such a way that this recipient can reconstruct the knowledge, integrate it and put it to meaningful action.
Kaplan & Norton (2008) emphasize that strategies that are not communicated well are very difficult to execute well. Executives would prefer a decent strategy that is executable by their organization to a brilliant strategy that the organization does not understand and
20 Kaplan & Norton (2008) state that employees can’t implement a strategy that they are not aware of, and employees who do not understand the strategy are unable to link their daily actions to its successful execution, management should therefore align employees with the strategy. All employees have to understand the strategy and are motivated to achieve it, in order for it to be successfully executed.
Cummings & Angwin (2011) found it not to be a surprise that many people in organizations are not sure what to do to enact the company’s strategy, as a result of the fact that company strategies are generally being captured in and communicated by documents and generic PowerPoint presentations, that are packed with text and numbers. In a study by Hunter & O’Shannassy (2007), 79% of respondents to a survey indicated the need to more effectively communicate their strategy internally. This suggests that communication as it is carried out now leans towards being of insufficient quality.
According to Hrebiniak (2006), one basic problem is that managers know more about strategy formulation than implementation. They’ve been trained to plan, not implement plans. A large difference can be distinguished between planning a strategy and executing
implementing strategy, since planning a strategy involves little communication, while
implementation consists largely of communication. Another problem Hrebiniak (2006) found is that some top-level managers believe strategy implementation is ‘below them’ - something best left to lower-level employees, while improper informed lower-level employees, as result of insufficient communication, are unable to execute plans accordingly. This inability of managers in execution or implementation of strategies is a result of most MBA programs being focussed on strategy formulation and functional planning. Core courses are typically about competitive strategy, marketing strategy, financial strategy etc. These core courses do however lack the emphasis on the actual ‘doing’ (Hrebiniak, 2006).
Li, Guo-hui & Eppler (2011) did a literature review, reviewing 60 studies regarding strategy implementation, and found four main problem areas that hinder said implementation:
attention, comprehension, agreement and retention.
Attention:
Consensus can not be achieved if lower-level management and nonmanagement are not aware of the same information as those that are trying to implement the strategy, therefore, proper attention to the strategic information needs to be stimulated. Kaplan & Norton (2008) found that “employees cannot help implement a strategy that they are not
aware of”(p. 12)
Comprehension:
21 Agreement:
Management should align employees with the strategy, as the majority of employees is required to agree with and be committed and motivated to implementing the strategy, in order for it to work. Schaap (2006) concluded that “when employees do not understand and agree
with the company's strategic plan, there will be a much higher likelihood that the implementation process of that plan will fail” (p. 23).
Retention:
The strategy needs to be communicated in a memorable way, to stimulate retention in employees. An employee that can not remember the key elements of the strategy is an
employee who cannot participate to the successful execution of the strategy. Collis & Rukstad (2008) state that few executives can remember the companies’ strategy enough to be able to summarize it in such a way that colleagues would put it the same way. This suggests that said executives have not been instructed about the strategy in a memorable way.
3.5 Strategy communication: effectiveness
Communication can be executed in various ways, but for communication to be effectively executed, the problems summed above have to be overcome.
Fidler & Johnson (1984) found one of the primary structural features associated with the diffusion of innovation within organizations to be the number and arrangement of communication channels. Each channel has its own capacities with regard to the type and volume of information that is to be shared among parties. The efficacy of communication channels is important, as it partially determines the cost effectiveness of the process of strategy implementation.
Rogers & Shoemaker (1971) state that there are two possible channels of
communication that have been focused on in innovation research: Interpersonal, involving primarily face-to-face modalities; and mediated channels, which are usually a method that lies between source and receiver (often referred to as mass media).
Carr & Kaynak (2007), state that there are multiple methods of communication, traditional communication methods are those that involve the use of telephone, fax, email, written and face-to-face contact. More advanced methods of communication are computer-to-computer links, electronic data interchange and enterprise resource planning.
Interpersonal channels can often provide the social support and enhanced confidence in the outcomes of the innovation that is crucial to the implementation of this innovation (Katz, 1957; Katz, 1961). Mediated channels, usually written ones, provide information in a more general way. The strength of mediated channels lies in its multiplicative power and its speed to reach a larger audience (Fidler & Johnson, 1984). “For increasingly risky
innovations, interpersonal channels will become increasingly effective in innovation implementation; conversely, with decreases in perceived risk, mediated channels become more efficacious in innovation implementation” (Fidler & Johnson 1984, p. 708).
22 regarding the intervention not only with a minimum of effort, but also costs (Rogers &
Shoemaker, 1971). It could be beneficial to find a method or mean of communication that both benefits from the low effort and costs of a mediated channel, but also addresses potential complexity issues.
One key for the better execution of strategies is thus to engage employees through a better way of communicating the strategy. Many researchers have mentioned the
importance of communication for the strategy implementation process (Mazzola & Kellermanns, 2010) and “communication is mentioned more frequently than any other single item promoting successful strategy implementation” (Li, Guo-hui & Eppler, 2011, p. 18).
Yet, little empirical research has so far looked at what really constitutes effective managerial communication of business strategies (Kernbach, Eppler & Bresciani, 2015). Kernbach et al. (2015) state that strategy communication could benefit from the use of visualization, as there are extensively documented benefits of graphic representations for complex communication.
3.6 Visualization: definition and description
Visualization is a very broad concept, it includes everything that involves some kind of graphical or visual display. MacEachren (1994) defines visualization as “to bring
something as picture before the mind” (p. 53). Usage of visualization can range from simple, for example a euro-symbol (€) instead of ‘euro’ in plain text, to more complex, for example an interactive map of air pressure over time, such as used in the weather report in the news. A visualization can replace one word, but can also tell an entire story with one figure. When the weather reporter shows a map such as described in the example, this carries a relatively large message, one view of a weather map can explain the forecasted weather of a day or even week to even those that are uninstructed.
3.7 Visualization in communication: benefits &
disadvantages
In psychology literature, Foos & Goolkasian (2005) state that people can receive and understand instructions with higher complexities far more readily when they are presented graphically, rather than textually. Further, individuals have better recall of pictures, while printed words receive less attention. This suggests that adding visuals in the form of graphs or pictures to mediated channel communication could make the use of mediated channels for communication a more viable method when complexities are higher, while keeping effort and costs low.
23 relationships for both the sender and receiver of messages. This in turn makes it possible for communication to be less filled with text.
Similarly, Rode (2000) has shown that processing information through the visual system rather than through language can substantially increase the degree to which
complexity can be handled successfully. “Representing connected information visually rather
than verbally serves as an important tool to support knowledge capturing by reducing working memory capacity demands and thus enhance our ability to perceive complex relationships” (p. 7).
Tory & Möller (2004) state that visualization can support cognition of data or
information in various ways. visualization can increase resources through parallel processing, offloading work to the perceptual system, reduce demands on human memory, and increase storage and accessibility of information. Next to that, visualization can help group related information, represent a large quantity of data in a small space, and impose structure on data and tasks in such a way that it reduces task complexity. Visualization can also enhance
recognition, as visualizations of information are easier to be recognised than recalling said information, and higher level patterns can be recognised if data is aggregated more
selectively. Visualization can also support cognition through perceptual monitoring andbeing a manipulable medium, since using preattentive visual characteristics allows monitoring of a large number of potential events, and manipulation of the structural organization of data may allow different patterns to be recognised (Tory & Möller, 2004).
Kernbach, Eppler & Bresciani (2015) did an experiment to gather evidence regarding whether the use of visualization is better than text in communication of a business strategy. Subjects were found to pay significantly more attention to, agree more with and better recall the strategy when they had seen a graphic representation of the strategy rather than a textually identical bulleted list version. However, no significant difference could be found regarding the comprehension of the strategy. Subjects that were shown graphic representations of strategies perceived the presentation and presenter significantly more positively than those that were shown bulleted lists.
Contrarily, Griffin (1995) found the use of visuals in business communication through symbols to be more complicated. The use of symbols could be an aid in lowering complexity when communicating. The meaning and message that symbols carry are however largely dependent on how they are interpreted. “When considering the importance of business communication and the fragile nature of the message, business people must recognize that symbols mean different things to different people” (p. 186). Griffin (1995) also states that the interpretation of certain symbols is influenced by cultural differences. This brings up the following problem, how must visualization be implemented in communication, to ensuring that said visuals represent the actual message correctly, to all receivers respectively.
Abdallah & Langley (2014) state that this ambiguity in strategic communication is not necessarily bad, as it can offer considerable benefits, such as enabling strategic development and change, and contribution to cyclical patterns of strategy development and reorientation.
24 diminish the potential of visualization. A better understanding of the limitations enables the support of designers’ decisions on the use or modification of the appropriate visual format. Based on their findings, they distinguish between cognitive, social, and emotional risks of visualizations, that can be viewed from two perspectives, the point of view of the designer of the visual representation, and the point of view of the ‘user’. Table 1 below shows an
overview of the risks of visualization, where a distinction is made between the three types of risks, and the perspective.
Designer induced User induced
Cognitive Ambiguity
Breaking conventions Confusion
Cost to make explicit Cryptic encoding De-focused Hiding/obscuring Implicit meaning Inconsistency Low accuracy Misleading
Misuse of figure-ground Not respected gestalt principles Over determinism
Over/under reliability appearance Over-complexity/simplification Redundancy
technology/template driven Time consuming to produce Unclear
Unevenness
Change blindness Channel thinking
Depending on perceptual skills Difficult to understand
High requirement on training and resources Misuse
Overload Reification Wrong salience
Emotional Disturbing Boring
Ugly/ unappealing Wrong use of colour
Visual stress Personal preferences
Prior knowledge and experience
Social Affordance conflict
Hierarchy, exercise of power Inhibit conversation
Rhythm of freezing and unfreezing Turn taking alteration
Unequal participation
Altered behavior
Cultural and cross-cultural differences Defocused from non-verbal interaction Framing effect
Different perspectives Hiding differences of opinion Time consuming to agree upon
Table 1: Risks of visualization (Bresciani & Eppler, 2009)
25
3.8 Visualization methods
There are many visualization methods. “A visualization method is a systematic,
rule-based, external, permanent, and graphic representation that depicts information in a way that is conducive to acquiring insights, developing an elaborate understanding, or communicating experiences” (Lengler & Eppler, 2007, p. 1). In their paper, Lengler & Eppler (2007)
attempted to create visual overview of all visualization methods that are fit for use in
management. It is called the periodic table of visualization methods, and within this table they categorized the visualization methods based on five dimensions. These five dimensions were based on previous (meta-)taxonomies as proposed by previous studies, and are chosen specifically because they should address challenges related to managerial thinking(cognitive challenges), managerial communication(social challenges) and the managers’ ability to motivate and engage their peers and employees(emotional challenges). The five dimensions are described below:
Complexity of visualization
Low to high, referring to the number of rules applied for use and/or the number of
interdependencies of the elements to be visualized. As it is with strategy, visualizations can vary largely, as a lot of variables could be accounted for.
Main application or Content area
Visualizations tend to differ according to what kind of information they are representing, these kinds of information can be categorised under: Data, Information, Concept, Metaphor,
Strategy, Compound Knowledge. It is important that it is clearly visible what kind of information is being shown.
Point of view
This dimension describes the extent to which detail is shown, also categorised: Detail
(individual item highlighting) Overview (big picture), and the combination Detail and
Overview (both at the same time). The point of view immediately shows what detail is meant to be emphasized by the visualization.
Type of Thinking Aid
Is the visualization method trying to reduce complexity, then it is Convergent, if it adds complexity, it is Divergent. Visualization can be used to simplify information of high complexity, while it could also show the complication of something that seems simple firsthand.
Type of Representation
26 An example of visualization in business communication can be found in business modelling, where models are becoming increasingly more complex, similarly to business strategies. Visual representations of a business model usually enhance understanding among readers (Osterwalder & Pigneur, 2005). Gordijn & Akkermans (2003) found that using conceptualizations to capture business models enables users to present them graphically, with little additional effort.
3.9 Visualization of strategy
Lengler & Eppler (2007), argue that strategy visualizations are visualizations of concepts, and what sets them apart from other concept visualizations is is their higher degree of complexity of visualization. This higher degree of complexity can be explained by the fact that obtaining an understanding of the visualization may require more management or domain specific knowledge. They found a sizable amount of visualizations that are used for strategy communications: supply demand chain, performance charting, strategy map, organization chart, house of quality, feedback diagram, failure tree, magic quadrant, stakeholder rating map, porter’s five forces, s-cycle, stakeholder map, life-cycle diagram, technology roadmap, edgeworth box, portfolio diagram, strategic game board, mintzberg’s organigraph, zwicky’s morphological box, affinity diagram, decision discovery diagram, bcg matrix, strategy canvas, value chain, hype-cycle ishikawa diagram, taps and spray diagram. Even though these visualization methods are all meant to visualize strategies, they differ in degree of complexity, low to high, point of view, detail, overview or both, type of thinking-aid,
convergent or divergent and type of representation, process or structure visualization.
Burkhard (2005a) introduced Strategy Visualization, which is defined as the
systematic use of complementary visual representations to improve the analysis, development, formulation, communication, and implementation of strategies in organizations. Strategy Visualization is more than a mapping of measurements, as it is developed to engage and activate employees. Since a strategy is required to be communicated to the stakeholder’s context, it is similar to other knowledge visualizations. The Strategy Visualization is based on the Knowledge Visualization Framework (Burkhard, 2005b; Eppler & Burkhard, 2006), which designates all graphic means that can be used to develop or convey insights,
experiences, methods, or skills among individuals. For effective transfer and creation through knowledge through visualizations, four questions should be considered:
What’s the goal of using a visualization method? What type of knowledge needs to be visualized? Who is being addressed?
What is the best method to visualize this indicator?
27 management is missing. The visualizations used in their case study had attracted individuals, presented overview and detail, and fostered the creation of a shared vision among the
presenter and addressees. The complementary use of visualizations, illustrating different levels of detail and different aspects of the strategy, lead to more motivation and engagement regarding the strategy implementation.
Cummings & Angwin (2011) argue that individualized visualizations of strategy could enable more effective conceptualization and communication of strategies that are higher in complexity. They refer to this visualization of strategy with the term stratography.
Stratography is defined as pictorial abstractions that outline the unique terrains and/or some relationships related to this terrain: competition, internal relationships, or market conditions in which organizations are embedded.
3.10 Visualization of strategy: design criteria
According to surveys conducted by Cummings & Angwin (2011), there are seven good stratography practices. These stratography practices could be called the design criteria for a functional strategic visualization. Four of these criteria are associated with mechanical movements, stopping the eye, spreading the eye across a terrain; enabling the eye to seek out connections; and facilitating the eye to zoom in and out. The latter three are more related to cognitive and sensual principles, mimesis, synaesthesis and mnemonics.
Attracting and focusing the eye
Good stratography requires the eye to be stopped, in order to command a viewer's attention. To do so, the visual representation should be perceived to be interesting, useful and easily comprehensible. Key elements for stopping the eye and encouraging it to pay attention to a visual are:
● Novelty, which can go a long way toward earning a second glance, but too much can make a graphic to appear irrelevant;
● Aesthetics, clear lines and good use of colours, not too many of either;
● Purpose, the first time a graphic is viewed, it should be clear what it seeks to do. ● Utility, the graphic should convey a sense that the viewer could acquire interesting
information from it.
Spreading the eye
In western cultures, the eye is generally accustomed to scanning graphics
28 Encouraging the eye to search
After attracting and focusing the eye, a good graphical representation may do two more things simultaneously. Keeping it engaged to the picture, and begin to loosen up the eye, enabling it to seek new patterns or information.
Facilitating the eye’s zooming in and out
The visual representation should enable the eye to see both the big picture and the detail, as both the simple and complex components are important aspects of effective strategic action. Good stratography should support this. Too much detail can turn people off, so the fewest dimensions necessary to aid decision making should be incorporated. Even though three dimensions may be a better representation of reality, two-dimensional graphics or maps allow work to be much easier. Within the two dimensions, no more than seven colours, seven directions or seven value categories should be introduced, as this would become too detailed. Similarly, the amount of different shapes should be kept low, to simplify complexity.
Mimesis: Leading the eye in human direction
Visual representations can mirror the different directions that individuals might take in actual life. Strategy implementation, presented as text, can only go left to right and top to bottom, other directions would lead to confusion, whereas visuals can show mimetic dimensions that help learning and retention by connecting cognition to physiology.
Synaesthesis: uniting different modes of communication, sense and behaviours An advantage with regards to communication that visualizations have is that it can be multimodal: it can consist of more than just text. Multimodality enhances the ability to communicate meaning (Hull & Nelson, 2005). Effective multimodal visual representations also have a synaesthetic effect, that is, they encourage readers to engage other senses to work together to give the visual a greater meaning. For example, a good map of subway tracks invites you to trace what you see. Synaesthesis supports readers to get a greater mental connection to the meaning of the visual.
Mnemonics: Entering the mind’s eye
29
3.11 Stakeholders of strategy communication
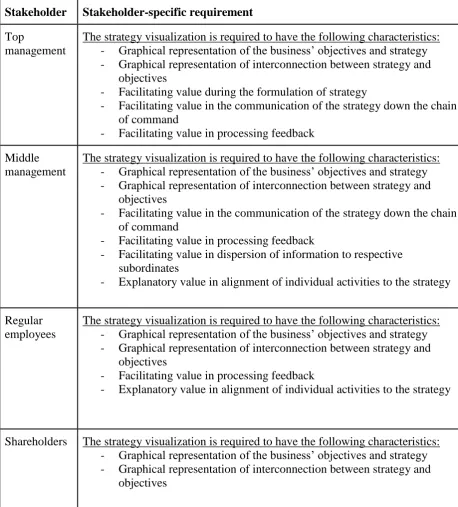
There are several stakeholders that are relevant to strategy, its formulation, communication and implementation, listed below:
Top management
This is the team that formulates, designs and wishes to implement the strategy in a business. Some top management teams have a chief strategy officer (CSO)(or equivalent), this is a executive who is responsible for developing, communicating, executing, implementing and sustaining strategic initiatives in businesses (Breene, Nunes & Shill, 2007). Their role in use of the strategy communication is the largest. CSO’s articulate a clear definition of the strategy, and explain how each employee can fit into the greater scheme of this strategy by adjusting their daily activities to the overall business objectives. Through the use of the strategy communication, they spread all knowledge required to implement the strategy, down the chain of command to all levels or departments of the business (Breene, Nunes & Shill, 2007).
Middle-management
These are the groups of managers who are located below top-managers and above first-level supervision in the hierarchy, that disseminate and communicate the strategic plans that top-management wishes to implement down the chain of command, to their subordinates (Wooldridge, Schmid & Floyd, 2008). Shi, Markoczy & Dess (2009) argue that middle
management plays a brokerage role in businesses, where they mediate the flow of resources or information between other unconnected actors. In this case this means that they communicate strategic information down the chain of command, and if this results in difficulties or other problems, these can be communicated back up the chain of command.
Regular employees
This is essentially all non-management personnel. These are the individuals that have to execute the plans that are described in the strategy. How the strategy relates to their everyday activities is what is relevant to them. Also, how their activities fit into the bigger picture of the business’ activities may prove to be important to them. Hambrick and Cannella (1989) argue that all employees need to be sufficiently informed about the strategy and its implications, in order for it to work. Their role can be described as the actor that actually executes the plans described in the strategy.
Shareholders
30
3.12 Summary of literature review
In order to give a structured overview of the findings of the literature review, some of the sub questions as formulated in the study design have been answered below.
Sub-objective 1: Define strategy communication A: What is strategy communication?
Strategy communication can be described as the communication and education of employees regarding the strategic goals of the company. This means that all employees of an organization have to be thoroughly informed of what their daily activities are, and how these activities fit into the greater scheme of the business’ objectives. Strategy communication is a substantial component of the process of strategy implementation. Sufficient strategy
communication has been found to be a requirement for businesses to successfully implement their strategies. The content that is to be communicated includes but is not limited to all strategic plans that the business
Sub-objective 2: Determination of effectiveness in strategy communication A: What determines effective strategy communication?
In order for strategy communication to be effective, several main problems have to be overcome. These main problems are: raising attention and awareness amongst those that are communicated to, making sure that the communicated strategy is understood thoroughly enough to be able to put it to use, stimulating support and commitment of the strategy, and communicating in a memorable way, so that it can be clearly remembered.
B: What obstacles are there that hinder effective strategy communication?
There are different sources of obstacles that hinder effective strategy communication, not all of which can be avoided. For example, when businesses grow, this often involves an increase in the amount of employees it has, which in turn makes communication more difficult, as more individuals have to be informed of the course of events. Other obstacles in achieving effective strategy communication are all practices that:
- Do not foster awareness of employees to the strategy
- Communicate the strategy in such a way that it is not understood by those that are enacting the activities it involves
- Do not inspire employees to support and commit to the strategy - Are not memorable enough for employees to remember
Sub-objective 3: Defining strategy visualization and its use A: How can strategy be visualized?
31 B: What determines effective strategy visualization?
Effective strategy visualization takes place when the visualization is able to aid or replaces dialogue regarding strategy communication. Visualization, when implemented correctly, can aid in communication by for example conveying the same message with less text, or by giving a better overview of the entire process for comprehension purposes. Effective use of visualization in strategy communication can lead to an increase in attention, agreement and degree of retention of said communication. The use of complementary visualizations in communication is expected to have great potential in improving said communication
C: How does the use of visualization affect strategy communication? There is a dichotomy in literature regarding the effects of visualization on
communication quality. On the one hand visualization is expected increase communication effectiveness through enhancing attention, agreement and retention levels, but due to ambiguity, the addition of visualization could also lead to confusion, especially when the information that is being communicated could be interpreted differently by different parties.
Sub-objective 4: Determination of the role of stakeholders in strategy communication
A: Who are the stakeholders in strategy communication?
The stakeholders of strategy communication can be categorised in four groups, top management, middle management, regular employees and shareholders.
B: How is communication of strategy different for the different stakeholders?
Each stakeholder has a different role regarding strategy communication, for example, top management is mainly responsible for the formulation of said strategy and communicating it in such a way that their subordinates know what to do or how to communicate the
information down the chain of command towards the respective relevant parties. Middle management’s role in strategy communication can be summarized as the brokerage role.They manage the flow of strategic resources up and down the command, providing subordinates with the information that is relevant for them, and providing feedback regarding the execution of the strategic plans to their superiors. Regular employees are the individuals that actually execute the strategic plans, their role in the communication of strategy more passive. The are supposed to be ‘sold’ the plan and its consequences. If their motivation, attention, support, comprehension and retention of the information is not sufficient, they will not be able to execute the plans as effective. Shareholders also hold a more passive role. They wish to be and stay informed about the business and its activities, therefore they are concerned with how the business’ strategic plans aims to increase the shareholder value (or at least sustain).
The information gathered during this literature review has given a more in-depth view into problem and its context. A framework was created regarding the research topics strategy, strategy communication, stakeholders of strategy communication, and strategy visualization. Next up is the design of a treatment to the problem. In order to design a treatment,