Climate Active City Enschede
Dico DefizeUniversity of Twente
Name Student: D. R. Defize Student number: s1565958
Abstract
Acknowledgements
Table of Contents
Abstract ... 2
Acknowledgements ... 3
Table of Contents ... 4
1. Introduction ... 6
2. State of the art ... 8
2.1 Background research ... 8
2.2 Smart Rainwater Buffer ... 9
Concept ... 9
2.3 Technology adoption ... 10
Diffusion of Innovations ... 11
Theory op planned behaviour ... 12
Adoption of rainwater harvesting technologies and strategies ... 13
Government regulation ... 14
3. Methods and techniques ... 16
3.1 Creative Technology Design Process ... 16
3.2 Stakeholder analysis ... 18
3.3 Interviews ... 18
4. Ideation ... 19
4.1 Altering behaviour ... 19
5. Specification ... 22
5.1 Interview content... 22
Internal factors ... 22
External factors ... 24
6. Realisation ... 25
6.1 Internal factors ... 25
6.1.1 Environmental knowledge and values (EK, EV) ... 25
6.1.2 Pro-environmental behaviour (Q1) ... 26
6.1.3 Motivation for pro-environmental behaviour (Q2) ... 26
6.1.4 Motivation for smart water buffering (Q5) ... 27
6.2 External factors ... 28
6.2.1 Political (Q3) ... 28
6.2.2 Social environment (Q4) ... 29
6.2.4 Economical and design (Q7)... 31
6.3 Conclusion ... 35
6.4 Introduction strategy ... 37
6.4.1 Informational intervention ... 37
6.4.2 Structural intervention ... 41
7. Evaluation ... 43
Discussion ... 43
Recommendations ... 46
APPENDIX A: Interview questions ... 47
APPENDIX B: Raw data... 52
1.
Introduction
The geography of Enschede makes water management challenging. The city is situated on a moraine, that causes a height difference of 44 meters between the highest and lowest parts of the city. This puts a lot of strain on the existing sewage system in the lower parts of the city in periods with a large volume of rainfall in a short period of time. This results regularly in floods, causing material damage and potentially dangerous situations (Water in Enschede, 2012). The municipality and water board Vechtstromen are involved in multiple projects that aim to reorganize water management and prevent flooding. The municipality Enschede set their vision in the report ‘Watervisie Enschede 2013 - 2025 Water verbindt’. The report can be summarized into six main goals:
• Detach rainwater from sewage system to lower the load. • Improve the landscape by adding surface water.
• Create water buffer areas to selectively store and release water. • Restrain increasing costs for water filtration.
• Create awareness and participation in the water facilities amongst residents. • Combine efforts with other parties in a water agreement.
The water agreement resulted into the Watermanagement Plan 2016-2021 by water board Vechtstromen. One 2021 goal is that municipalities act as Climate Active Cities, that can adapt to climate change. In a Climate Active City, climate projects feature a technical and social innovative bottom-up approach, involving close collaboration with residents, companies, housing corporations, power companies, and knowledge institutes.
Literature on technology adoption, extended with environmental influences, provide an outline to research the adoption potential. After media coverage of this project, a small group of residents already showed interest to participate in a trial. This group can be seen as innovators and their motivation can be used to develop a strategy to introduce the smart rainwater buffer to a larger target group. The main research questions are:
• Which factors do influence the attitude of innovators, towards adopting a smart rainwater buffering system?
• How are innovators willing to invest in a smart rainwater buffering system? o How much are innovators willing to invest?
o Which financing structure is most favourable? • How to design an introduction strategy for early adopters?
2. State of the art
This chapter covers relevant background information and the current status of the smart rainwater buffer project. The first part briefly reflects on current initiatives from the municipality and the ideation of the smart rainwater buffer. The second part is on the technological development of the buffer itself, and previous findings. The final part covers the literature on technology adoption and rainwater harvesting adoption strategies.
2.1 Background research
Water management is of increasingly importance to the municipality of Enschede. Due to climate change, extreme rainfall is occurring more often. Combined with a high amount of paved area and the current sewage system, this causes an increasing risk of flooding (Water in Enschede, 2012). The solution to this problem needs to connect with the current sewage system, as it is very costly to replace. The current sewage system is 40 years old. Normally, the sewage system gets replaced every 70 years, so the current system has to last for another 30 years (Scholz, 2006).
In recent history, the municipality has invested in multiple centralized measures to reduce the risk of floods. The current sewage system is extended with water retention basins, to cope with peak flow volume. One recent project is the Kristalbad, a multifunctional retention area (gemeente Enschede, 2015). Another, one of the most recent projects is the Stadsbeek, which is a retention area between two neighbourhoods (gemeente Enschede & Marion, 2015). Individual households are only obligated to account for their rainwater drainage when they apply for new construction permits from the municipality. Most of the current projects are time-intensive, expensive and inadequate. In line with the municipality’s vision, as described in ‘Watervisie Enschede 2013 - 2025 Water verbindt’, there is a need for low-maintenance, low-cost bottom-up solutions.
2.2 Smart Rainwater Buffer
The Smart Rainwater Buffer ideated at a Creathon on the 27th and 28th of November 2016. This Creathon was organized by the University of Twente, Kennispark, municipality Enschede and waterboard Vechtstromen, with the theme: ‘Living with climate change in the city of the future’. The Ensketon Smart Rainwater Buffer was the most promising solution (Vechtstromen, 2016). The development continued with various graduation projects on the development and design of the Smart Rainwater Buffer by Steeghs, (2017), Rindt, (2017) and Vetter (2017).
Concept
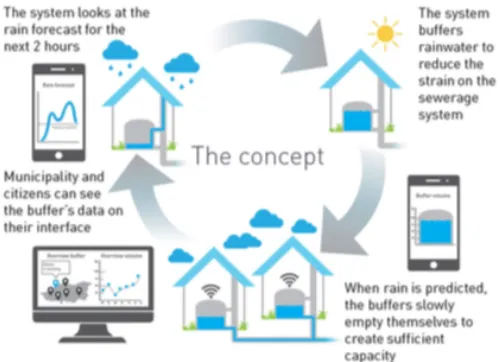
The research done by Steeghs (2017) and Rindt (2017) focuses on converging the creative idea of a smart rainwater buffer into a product idea. They drafted functional and system requirements from a municipality and user point-of-view. A rainwater buffer can be made smart by implementing a system with sensors and actuators. Those include two solenoid vales for automatic and manual drainage, a faucet, five flow sensors to measure in- and outgoing water flows and an ultrasonic sensor to measure water levels.
The system uses the rain forecast to selectively drain the water buffer, to maximize the buffering capacity during heavy rainfall. Users are able to monitor and control their smart rainwater buffer via a mobile interface. The ecosystem of connected smart buffers allow the municipality to monitor buffering capacity. The visual representation of this concept can be found in figure 1.
[image:9.612.115.365.509.690.2]Rindt (2017) analysed the target area, ‘de Bothoven’ and ‘Velve-Lindenhof’ and found that buffering solutions are most likely to be placed in backyards, as not all rooftops are suitable for buffering rainwater. Vetter (2017) continued on the design of the water buffer. Out of five concepts, the municipality preferred the water fence design. The final prototype was made with a 600L IBC-tank, as this proved to be the most efficient way to establish proof of concept.
2.3 Technology adoption
To introduce the smart rainwater buffer on a large scale, the technology needs to be widely adopted. Technology adoption is a well-researched topic. Literature on this topic provide reputable theories on factors that influence adoption on an individual level, and the diffusion of adoption on a community level. In the field of information technology (IT) adoption, there are two dominant theories. Salahshour Rad, Nilashi and Mohamed Dahlan (2017) conducted a literature review of 330 articles, published between 2006 and 2015, to map out the current knowledge in the topic. The two most dominant strategies are the Technology Acceptance Model (TAM) and Diffusions of Innovations theory (DOI), which were covered by half of the articles. These models aim to identify factors in innovation adoption, on individual and group level.
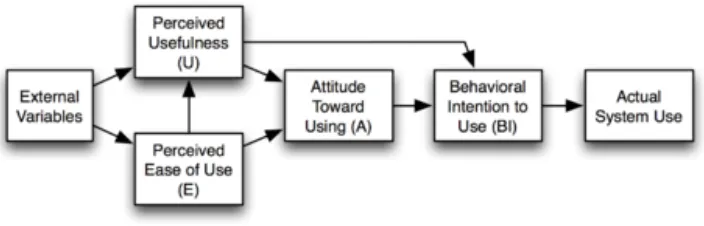
The TAM theory models how users accept and use a technology. Davis (1989) identified a number of factors that influence their decision on when and how they use it, as displayed in figure 2. The first factor is perceived usefulness, which he defined as the degree to which a person believes using a particular system improves his or her job performance. The second factor is perceived ease of use, which he defined as the degree to which a person believes that using a particular system would be free from effort.
[image:10.612.128.480.527.640.2]Further research on the TAM concerning green IT, incorporates the influence of economic, environmental and social causes on the attitude and actual use of a system. These factors positively influence the attitude towards adoption for consumers, since sustainability or a product creates extra value (Esty and Winston, 2006). Olso (2008) and Gonzalez (2005) add that even with a negative attitude, regulatory requirements and legislative actions stimulate the actual use of green it. Both influences result in a shift towards the adoption of green IT for both customers and companies.
Diffusion of Innovations
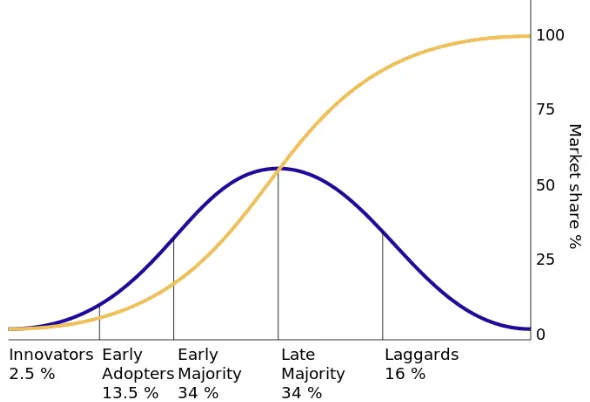
The first group of adopters is identified as the innovators. The diffusion of innovations theory describes the characteristics and importance of this group for the adoption of consecutive groups. The Diffusions of Innovations theory, seeks to explain how and at what rate new innovations adopted on a community level, in extension to the individual TAM. Rogers (2003) optimized this theory and states that diffusion is the way of communicating the innovation over time, to groups within a social system. The four elements that influence the adoption are the innovation itself, the communication channels, time and social system. Different types of adopters and their characteristics can be divided into five groups: innovators, early adopters, early majority, late majority and laggards. The size or each group and adoption curve are displayed in figure 3. The first two groups are most relevant for this paper, since its goal is to design a strategy to reach the early adopters, using knowledge from the group of innovators.
Innovators are fundamentally committed to a new technology, and are motivated by the idea of being change agents. They are the first to adopt a new product, despite any flaws or bugs it might have. Often, they are willing to help develop and improve the technology. The residents that reported interest in the rainwater buffer project fit in this group, most of them have indicated to already have a rainwater buffer. The group of innovators is key to accessing the next group.
[image:11.612.104.399.488.689.2]Early adopters are visionaries in the early market. In general, this group is not very price-sensitive. They peruse new innovations to gain significant competitive advantage, and are willing to take risks. Communications across this group crosses industry and professional boundaries. They help to publicize new innovations, to give them a boost for the rest of the early market.
In the DOI theory there are five stages in the adoption process: knowledge, persuasion, decision, implementation and confirmation. Roger (2003) outlines two adoption strategies, the first is to create instinctive desire by the adoption of an innovation by a highly respected individual within a social network. The second is to introduce the technology to a specific group that is ready to adopt and generates positive reactions for early adopters. The technology then diffuses within the social networks of the users, until it reaches the critical mass. At this point the number of adopters is high enough, to ensure that the innovation is self-sustaining.
Since adoption is a process of communication over time, it is critical to distinguish each group. Furthermore, Moore (1999) demonstrates that the adoption categories do not connect, but have a disassociation. This is the difficulty any group will have in accepting a new product, if it is presented the same way as the previous group. The largest gap, called the chasm, is in-between the early adopters and the early majority. Innovations that are able to cross the chasm become mainstream. Moore advocates that marketing efforts should be focused on a single group at a time, using each group as marketing base for the next.
Theory op planned behaviour
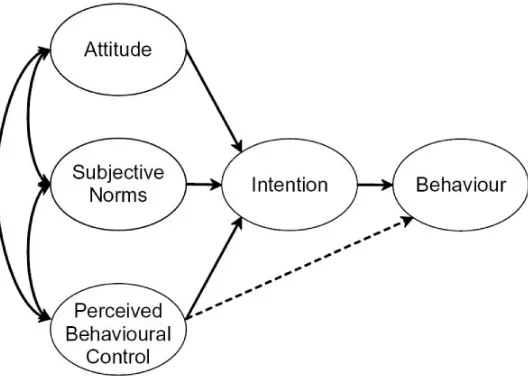
How the adoption of technology is influenced by environmental factors can be explained by the theory of planned behaviour. The theories described by Davies, Rogers and Moore consolidate each other. They focus on the adoption of technology on an individual and group level. The underlying behaviour to decide to try a certain technology can be explained using the theory of planned behaviour (Ajzen, 1991). This theory states that human behaviour can be explained by the intention towards a certain behaviour. The intention is influenced by three factors: the attitude towards the behaviour, the subjective norm and the perceived behavioural control. Figure 4 shows each factor and their relations. Several studies (Aguilar, García, Calvo & Salinas, 2012; Bamberg & Schmidt, 2010; Kaiser, Hübner & Bogner, 2005) believe that the theory of planned behaviour can be used in the study of environmental behaviour.
Figure 4: Theory of Planned Behaviour (Ajzen, 1991)
Adoption of rainwater harvesting technologies and strategies
The majority of literature on the adoption of rainwater buffering systems is on rainwater harvesting systems (RwHS). These systems are often linked to (arid) regions that experience periods water scarcity, or have a high agricultural use. The adoption of RwHS in such regions show adoption factors that are linked to water scarcity and achieving independence (White, 2016). However, studies found that rainwater harvesting systems in non-arid regions are able to significantly reduce rainwater peak flow volume (Steffen, Jensen, Pomeroy & Burian, 2013). Gee and Hunt (2016) found that in similar circumstances, smart systems show an even greater reduction than passive systems. Knowledge on RwHS can be used to identify factors that could play a part in the adoption or rainwater buffering systems in Enschede.
The financial sustainability of RwHS seems inconclusive and heavily dependent on local conditions. One case study found that government subsidies lower water prices, making RwHS economically not viable (Gómez and Teixeira, 2017). Stec en Kordana (2015) argue that RwHS are already financially viable, when taking the investment costs for their specific use into account. In their calculations, they differentiate water usage for showers, washing machines, toilet bowls and watering for green areas. The water-bill savings alone seem to be able to recoup the investment, if the rainwater is only used for the toilet. The installation costs to be able to water the green areas with the same system exceed the water-bill savings, eliminating the financial advantage. In contrary, Kim, Li, Kim and Lee (2016) found that the payback time on water-bill savings is too long, even with government subsidies. These subsidies were estimated by savings on sewage extension plans. Other benefits could provide an overall advantage of RwHS usage, such as reduction of flooding risk, insurance fees and cost savings on the sewage system. These factors become more relevant in rainwater buffering systems, since they are less likely to be used for water-bill savings.
Apart from decisive factors for adopters of RwHS, there seems to be a reoccurring strategy in the adaption of such systems. The social network approach (Sammadar, Murase, Okada, 2014), which is often used in arid regions. In this approach, adopters are active promotors of the system, which persuades other members of the community to become an adopter as well. Even though there are different environmental factors, it is consistent with the diffusion of innovations theory by Moore (1999) and Rogers (2003).
Government regulation
The government can play an important role in the implementation of new innovations. Partzsch (2009) proposes a state regulation support system for the water sector, based on the smart regulation concept of Jänicke (2008). This concept builds on ecological modernization and has three main objectives: (1) to mobilize all major actors, (2) create horizontal rather than vertical relations between actors and institutions and to (3) focus on the goals and not the methods to achieve them. Accordingly, Partzsch (2009) identified three policies as the main causes for Germany becoming a world reference in the use of rainwater. These include the investment subsidies for decentralized technologies, the imposition of water extraction rates and the separate charging of drinking water and drainage bills.
3. Methods and techniques
3.1 Creative Technology Design Process
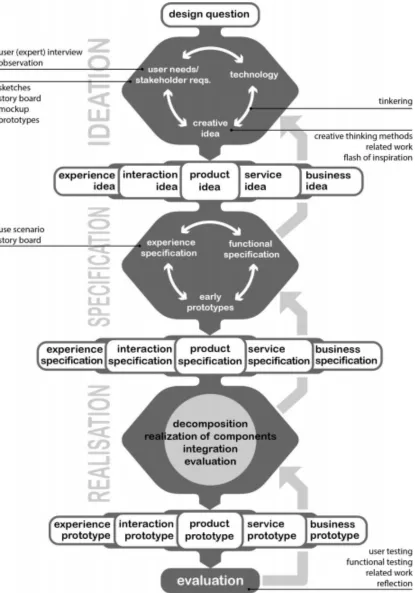
The aim of the bachelor program Creative Technology is for students to design products and applications that improve the quality of life, building on Information and Communication Technology (ICT). The design process of Creative Technology consists of four phases: ideation, specification, realization and evaluation (Mader & Eggink, 2014). A visual representation the design process is shown in figure 5. This process is iterative and based on a combination of Divergence-Convergence and Spiral models of design practice. In each iteration the design is improved based on human-centred design. The Creative Technology Design Process is used for the smart rainwater buffer project as a whole, and for the subpart within this thesis. During this research, the smart rainwater buffer project is in the specification phase, which is similar to technology readiness level 3 (European Commission, 2014). There is a working concept, which has multiple possible designs and functionalities. These need to be explored in early user tests, before realizing a final product prototype.
3.1.1 Ideation
The starting point for the ideation phase is a design question. This may result from a product idea, an order from a client, or a creative inspiration. Early ideas can then be visualized and evaluated with clients, users or experts. The result of the ideation phase is a more elaborated project idea, with associated problem requirements.
3.1.2 Specification
The specification phase is characterized by using multiple prototypes to explore the design. These prototypes are evaluated with users to explore functionalities and corresponding user experiences. This phase results in a more detailed product specification.
3.1.3 Realization
The realization phase follows the product specification into the realization and integration of components into the final prototype. Iterations in this process focus on the validation of the product specifications.
3.1.4 Evaluation
3.2 Stakeholder analysis
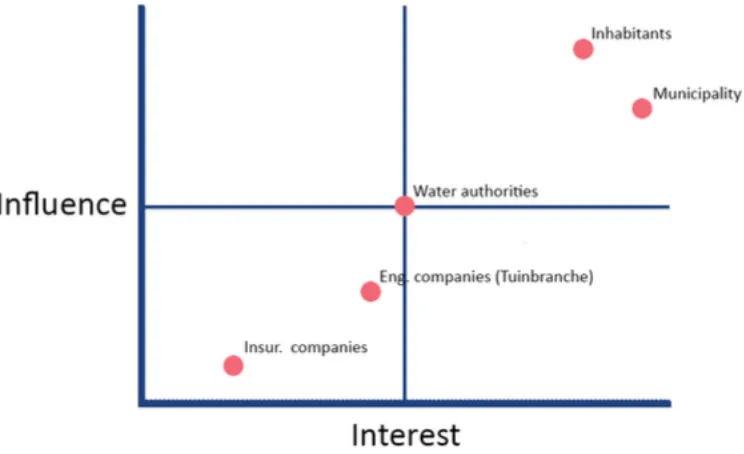
[image:18.612.114.486.196.423.2]Previous research identified all the stakeholders in the smart rainwater buffer project. These stakeholders are: the inhabitants of Enschede, the municipality, the water authorities, engineering and insurance companies. Vetter (2017) made an influence-interest matrix with these stakeholders, which can be found in figure 6. The municipality has the highest interest and the inhabitants the highest influence. This provides a framework for the project as a whole, whereas this report focusses on the inhabitants.
Figure 6: Influence-interest matrix of different stakeholders in the project (Vetter, 2017)
3.3 Interviews
4. Ideation 4.1 Altering behaviour
The technology acceptance model (Davis, 1989) describes which factors influence the adoption of technology on an individual level, the diffusion of innovations (Rogers, 2003) describes the adoption within the community. The theory of planned behaviour (Ajzen, 1991) maps out factors that influence behaviour and explains the influence of ecological factors. Chapter 4 and 5 describe how constructs of these theories can be used to alter behaviour.
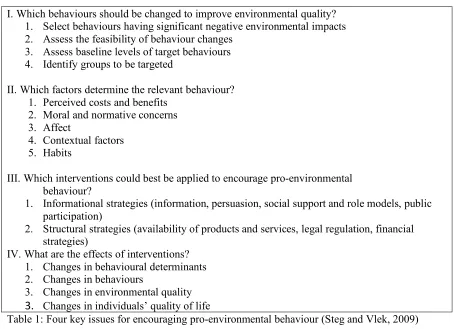
Geller (2002) argues that promoting environmental change is more effective when one: (1) select behaviour to improve environment (2) examine which factors cause those behaviours (3) apply specific interventions to change relevant behaviour and their antecedents (4) evaluate the effect of this behaviour themselves. Steg and Vlek (2009) created a comprehensive framework for the steps proposed by Geller (2002). This framework can be found in table 1. Following this framework, the following part describes the first three steps to promote pro-environmental behaviour.
I. Which behaviours should be changed to improve environmental quality? 1. Select behaviours having significant negative environmental impacts 2. Assess the feasibility of behaviour changes
3. Assess baseline levels of target behaviours 4. Identify groups to be targeted
II. Which factors determine the relevant behaviour? 1. Perceived costs and benefits
2. Moral and normative concerns 3. Affect
4. Contextual factors 5. Habits
III. Which interventions could best be applied to encourage pro-environmental behaviour?
1. Informational strategies (information, persuasion, social support and role models, public participation)
2. Structural strategies (availability of products and services, legal regulation, financial strategies)
IV. What are the effects of interventions? 1. Changes in behavioural determinants 2. Changes in behaviours
[image:19.612.65.519.333.662.2]3. Changes in environmental quality
3.
Changes in individuals’ quality of lifeBehaviour
The negative impact on the environment, in the rainwater buffering case, is the strain of rainwater on the sewage system, especially during heavy rainfall. The underlying problem is the amount of impermeable roofing and pavement, that eventually flows to the sewage system. The desired change in this context, is to restrain the drainage (during heavy rainfall), using rainwater (Steg & Vlek, 2009) (Geller, 2002) buffers. Undesired behaviour can be described as ‘doing nothing’, in which households do not participate in any solution. The desired behavioural change is to actively participate in a solution, which can be a rainwater buffering system or another solution.
Factors influencing relevant behaviour
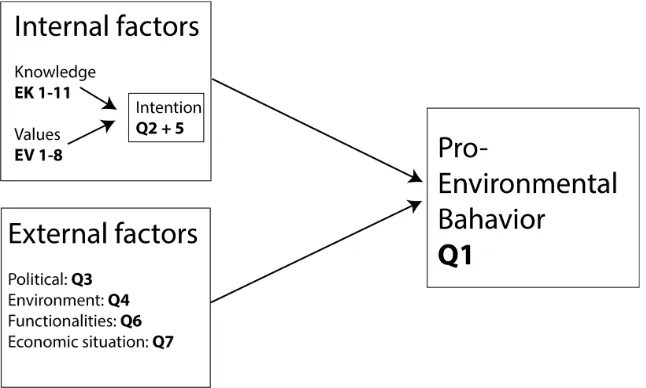
Relevant factors can be synthesised from multiple theories. Kollmuss and Agyeman (2002) propose an extensive model for pro-environmental behaviour, in which there is a distinction between internal and external factors. An overview of the model can be found in figure 7. Internal factors include environmental knowledge and values. Kaiser et al. (1999) statistically prove that ecological behaviour is determined by the ecological behaviour intent, which is a function of ecological knowledge and ecological values. External factors (Kollmuss & Agyeman, 2002) include infrastructure, political, social factors and economic situation. Steg and Vlek (2009) differentiate informational (antecedent) strategies, which relate to internal factors, and structural (consequence) strategies, which relate to external factors. Internal factors can be determined by the method used by Kaiser et al. (1999), external factors can be combined into financial matters, or willingness to pay. The results can be used to design an informal and structural strategy accordingly.
Interventions
5. Specification 5.1 Interview content
[image:22.612.72.395.244.438.2]Interviews are used to gain in-depth knowledge from the trial group respondents. The model of Kollmuss and Agyeman (2002), combined with Kaiser et al. (1999) maps out factors that influence pro-environmental behaviour. The interview is structured to gain insight in each of those factors, as shown in figure 8. The interview consists of two parts. The first part consists of structured questions on environmental knowledge and values (EK and EV), the second part consists of semi-structured questions (Q). The statements and questions are explained in the following part, the full list, with translations can be found in appendix A.
Figure 8: Combined frameworks, including corresponding questions.
Internal factors
The first part of the interview is structured and aims to identify internal factors. Similar as in Kaiser et al. (1999), the respondents are asked to respond to theses, that correspond to global environmental issues and local water management challenges. The first set of questions aims to assess the ecological knowledge. This set of questions consists of 11 positively and negatively formulated theses, on which the participant is asked to respond with ‘yes/agree’, ‘no/don’t agree’ or ‘don’t know/neutral’.
Knowledge (EK): (yes/no)
1. Due to climate change extreme weather, like heavy rainfall occurs more frequently. (yes) 2. Mixed sewage systems drain used- and rainwater through the same pipeline. (yes)
3. Rainwater absorbed by soil, does not cause strain on the sewage system. (yes) 4. Pavement increases the strain on the sewage system. (yes)
5. The world climate will probably massively change if CO2 emissions shay the same. (yes) 6. Periods of draught will more often occur in the future. (yes)
7. In case of flood, the municipality will cover damages. (no) 8. My home insurance covers flood damages to some extent. (no) 9. Water will be scarcer and more expensive in the future. (yes)
10. The current sewage system can handle heavy rainfall, without floods. (no) 11. The yearly sewage tax is roughly €220 per household. (yes)
Values (EV): (1-5)
1. People need to react to environmental changes.
2. Rainwater should not be reused when possible, e.g. to water the garden or wash a car. 3. Rainwater should naturally be absorbed by the soil, not drained.
4. Environment improving projects should counter the cause, not the effect. 5. Nature must be preserved.
6. Not only the municipality, but individual households are responsible to reduce the strain on the sewage system.
7. You could say the municipality should be responsible, since you pay your taxes. 8. A garden should be green, not paved.
Semi-structured questions (Q)
1. Are you, or have you ever been involved in pro-environmental projects? If yes: what kind of projects? 2. What is your main motivation to participate in pro-environmental projects?
3. Do you think there is enough stimulation to participate in pro-environmental projects? Why? 4. Have you, or someone in your surroundings, ever experienced a flood?
5. Would you adopt a rainwater buffering system? Why? 6. Which functionalities should a rainwater buffer have? 7. For each design (A-E):
7.1. What do you think of the design?
7.2. How much would you be willing to invest, considering a yearly sewage tax of €220? 7.3. On what base would you be willing to invest? (single investment/yearly/monthly)
External factors
6. Realisation
Out of the 25 contacts, 15 responded to the (reminder) e-mail. Out of this group, 3 respondents responded negatively and chose to restrain from any engagement with the project. One respondent showed interest, but was unable to attend an interview. In total 11 interviews took place, of which two double interviews where a partner or colleague attended, making a total of 13 interviewees. The interview results, per factor are presented in the following part. If multiple responses are in line, one umbrella quote is chosen that represents all respondents within that group. Quotes of respondents are abbreviated with QR, for example the quote by respondent one is noted as QR1. More detailed raw results can be found in appendix B, transcriptions of interviews are available upon request.
6.1 Internal factors
6.1.1 Environmental knowledge and values (EK, EV)
Results show that in general, respondents score high on environmental knowledge questions. On average, 8.8 out of the 12 questions were answered correctly, with only three respondents scoring below-average. The lowest-scoring respondent had 5 correct answers, two others had 7 correct answers. Almost all questions show a high amount of correct answers, with two exceptions. Five out of thirteen respondents falsely think that their home insurance covers flood damages, another three are unknowing (EK 8). Only five respondents are aware of the sewage tax fees, the other eight were not (EK 11).
6.1.2 Pro-environmental behaviour (Q1)
A positive intention towards pro-environmental behaviour often results in the actual behaviour itself (Kaiser, Hübner, & Bogner, 2005). The first open-question (Q1) of the interview is about previous and current involvement in pro-environmental behaviour. Out of all of the 13 respondents, only one indicated not to be involved in any pro-environmental behaviour, due to the high costs of solar panels. 10 respondents are already actively buffering rainwater, of which one has a grey-water circuit. 6 respondents have invested in solar panels, and also 6 respondents indicate being involved pro-environmental behaviour like separating waste and nature clean up actions. The high involvement in pro-environmental behaviour is in line with the high scores on environmental knowledge and values.
6.1.3 Motivation for pro-environmental behaviour (Q2)
To gain insight in the factors that influenced previous and current environmental behaviour, the second open question (Q2) is about motivation. For this, the factors from the TAM and TPB are used, extended with the positive influence of pro-environmental arguments on these models (Esty & Winston, 2006) (Akman & Alok, 2014) (Dezdar S., 2017). These include the perceived usefulness, ease of use, attitude, subjective norm and perceived control (Davis, 1989) (Ajzen, 1991). The interview results provide three main motivations for pro-environmental behaviour: idealism/sustainability, economical and personal interest.
Idealism and sustainability arguments are strongly related to perceived usefulness and perceived control. One is convinced of the benefits of pro-environmental behaviour and the potential impact. All but one respondent named sustainability related arguments (QR1, QR2, QR10).
Respondent 1: ‘The world seems to perish. One should be aware that we’re depleting the world’s recourses.’
Respondent 2: ‘We should leave a clean earth for the next generation’
Respondent 10: ‘To do my contribution to climate problems, like the emission problem’
Respondent 5: ‘Low interest, I thought: I can better put my money on my roof,
it’s more profitable. Sustainability is important, but this returns €600-700 per year,
that is important.’
Respondent 9: ‘My main motivation is economical; I get a return. On the other hand, if it is pro-environmental, it is nice.’
Three respondents showed clear characteristics of innovators, as they mentioned personal interest as motivation (QR8, QR9). These respondents also had a related job at the UT or Saxion. Innovators are often involved with the technology, and like to customize and work with it (Rogers, 2003).
Respondent 8: ‘I’m working on [pro-environmental] projects at the UT [..] I placed my own sun boiler.’
Respondent 9: ‘I like to contribute to projects when I hear about them’
6.1.4 Motivation for smart water buffering (Q5)
The participants showed interest in the smart rainwater buffer project, and the interviews revealed that most of them already buffer rainwater. Question 5 (Q5) aims to map out the motivation to participate in the project. All but one (12/13) named re-using rainwater in the garden as main motivation. Three respondents specifically added to do this to save tap water (QR1, QR3).
Respondent 1: ‘It is purely about thinking consciously, so you have to use less tap water to water the garden.’
Respondent 3: ‘I think it is a waste to water the plants in the garden with tap water.’
Apart from environmental arguments, three respondents specifically indicated the need for a rainwater buffer, due to a lack of sewage connection. In these cases, a renovation or new construction was built without sufficient drainage, which caused a direct need for a solution. Even though all these respondents named environmental arguments, this seemed to be the direct cause to respond to the trial. Two of those three respondent currently do not collect rainwater (QR7), the third mentioned to be forced to do so because of the problem (QR4).
Respondent 7: ‘Next to the problem with the loose rain pipe, for which I really need a solution, it is a waste that all the other rain pipes drain into the sewage’
Three respondents mentioned drainage problems in their motivation to participate. One respondent wanted to reduce the strain on the general sewage system (QRL4), the other two hoped it would help with drainage problems in his own household (QR9, QR10).
Respondent 4: ‘For the rainwater project, to reduce the strain on the sewage system and to collect water.’
Respondent 9: ‘I would use it as a buffer to counter the thrust effect during heavy rainfall.’
Respondent 10: ‘I would like to extend my buffer capacity, although I doubt whether that will fix my problem.’
6.2 External factors
6.2.1 Political (Q3)
Participants where asked whether there was enough stimulation to participate in pro-environmental behaviour, by the (local) government or any other party. The results revealed two reoccurring themes: a lack of good institutional examples (QR12) and a lack of personal approach. Two respondents from de Bothoven, one of the target areas of the municipality, mentioned that they are aware of the sustainability plans, but fail to see results (QR5, QR13).
Respondent 5 (neg): ‘They want to make de Bothoven a sustainable neighbourhood, but I do not notice it at all.’
Respondent 12 (neg): ‘We should propagate more. The new building [Saxion] has solar panels, why not make a demo in the hallway? That would reach all the
visitors.’
Respondent 13 (neg): ‘Multiple housing associations have been renovating recently [in the Bothoven], but did not install solar panels. Apparently, that is not in the policy of the housing associations, or part of the agreements with the municipality.
Respondents that were negative on institutional stimulation often named a lack of awareness about problems and potential solutions. This is in line with the literature, where the (lack of) subjective norm and perceived usefulness can cause the lack of adoption and behavioural change (Davis, 1989) (Ajzen, 1991). Notable is that of the four respondents that were content with the institutional stimulation, three of them were personally approached to participate in a pro-environmental project. In one case it was the housing association that approached tenants to lease solar panels (QR11), in another case it was a commercial contractor that targeted a whole neighbourhood (QR9). One respondent indicated to be willing to be an advocate to the neighbourhood (QR5). This enthusiasm is typical for innovators, and can be used as an adoption strategy (Rogers, 2003). In the adoption of rainwater harvesting systems, the social network approach has already proven to be effective (Samaddar, Murase, & Okada, 2014).
Respondent 5 (neg):’ Let me tell my neighbours; why do I have solar panels? What do they yield? Involve the people that already made the step, and let them
convince others.’
Respondent 9 (pos):’ There was a lot of interest in sustainable isolation. A company heard about that, and notified they will contact us in January, so we can do
a joint purchase.’
Respondent 11 (pos):’ The housing association mediated the placement of solar panels, I could choose. [..] I agree [there is enough stimulation], especially with
solar panels.’
6.2.2 Social environment (Q4)
The subjective norm plays an important role in the one’s intention towards a certain behaviour (Ajzen, 1991). For the rainwater management problem in Enschede, experience with the consequences of floods can be an important motivation to participate in a solution. The respondents were asked if they, or anyone in their social circle experienced flooding (Q4). All respondents have experienced water problems to some extent. Most of them had little or no serious consequences and did not seem to personally affected, these include news-coverage and local well-known issues (QR3, QR11).
Respondent 3: ‘Close to the Saxion there’s a tunnel that floods sometimes, often that’s in the news.’
Four respondents mentioned flood related experiences with serious consequences. A flooding basement is a much-heard occurrence (QR7). To some respondents this seemed like a custom, which they would not even label as a flood (respondent 7, 11). Others perceive it as a greater concern and fear for high renovation costs (QR2, QR9). Apart from the perceived severity, the cause of flooded basements is often linked to high groundwater levels. The extent to which experience with floods influences the respondent’s behaviour on rainwater management is therefore inconclusive, and very personal. Experience with floods however, positively influences the awareness and knowledge on the problem. Multiple respondents referred to such events when asked if they think the current sewage system can handle heavy rainfall (Q10).
Respondent 7: ‘I know people whose basement regularly floods, that’s a local problem.’
Respondent 2: ‘My brother from Amsterdam had to renovate his house for
€100.000, because his basement flooded every year.’
Respondent 9: ‘I have a water pump in my basement. My neighbour renovated the water drainage of his whole house. Nowadays you see the street flooding 3-4 times
a year during heavy rainfall, that used to be once per 5 years.’
6.2.3 Functionalities (Q6)
For mass implementation, the technology of the smart rainwater buffer needs to be accepted. The main factors in the technology acceptance model are the perceived usefulness and perceived ease of use. These are dependent on the functionalities of a smart rainwater buffer, and its benefits over a regular rainwater buffer. The participants are asked which functionalities they want from a smart rainwater buffer (Q6).
Ten participants indicated remote monitoring (level and temperature) and remote control (QR1). Two specified they would like a dripping system, to remotely water the garden. One respondent showed interest in implementing a grey water system, to reuse the water rather than a functionality of the buffer itself. Two respondents did not specify any smart functionalities (QR10). The current prototype can fulfil every respondent’s expectations on functionalities. For ten out of thirteen respondents this directly increases the perceived usefulness, as they want to use smart functionalities.
Respondent 1: ‘I would like to be able to measure the water temperature and to remotely control the buffer.’
Respondent 10: ‘For me it is important to be able to tap water, to use a watering can.’
6.2.4 Economical and design (Q7)
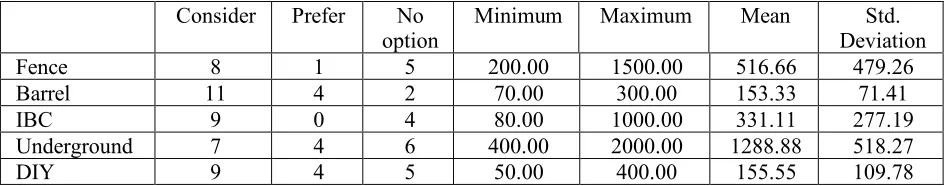
[image:31.612.70.544.446.539.2]In the final part of the interview, the respondents were shown five possible designs of the smart rainwater buffer (appendix A). These designs are based on the prototype and the findings by Rindt (2017), who found that buffering solutions are most likely to be placed in backyards, and the preference of the municipality for the water fence (Vetter, 2017). The five designs are the water fence, water barrel, IBC tank, underground buffer and do-it-yourself (DIY) kit. The respondents were asked for general remarks, and what amount they would be willing to invest in such a system, considering the yearly sewage tax of €220. Also, the terms of the payment were discussed, like spread payments and discounts or mark-ups on the sewage tax. For each design, the respondents were asked to give an estimation of the price and whether they would consider investing in it. For some designs, respondents indicated that the design was not applicable in their household, or would not consider it. Some estimates were given in an interval, of which the upper limit is used. Each respondent also indicated their preference out of all options. The overview for each design can be found intable 2. Results per design will be discussed in the following section.
Table 2: Overview considerations and willingness to pay per design.
Water fence
The water fence was the most preferred design by the municipality of Enschede in the research done by Vetter (2017). The majority of the respondents was positive on the aesthetics of the design. For the five respondents that indicated that they would not consider it, two indicated they did not like the design. Two others thought it would be too expensive (€500 and €200 estimations) and for one it is not applicable within the household. Every respondent that would consider the water fence, expects the price to be
Consider Prefer No option
Minimum Maximum Mean Std.
Deviation
Fence 8 1 5 200.00 1500.00 516.66 479.26
Barrel 11 4 2 70.00 300.00 153.33 71.41
IBC 9 0 4 80.00 1000.00 331.11 277.19
Underground 7 4 6 400.00 2000.00 1288.88 518.27
similar to a regular fence and often would only consider it when their current fence needs replacement (QR12). Only respondent 4 would prefer the fence over the other designs.
Respondent 4 (€500 estimation): ‘That would be an investment, but the same
holds for a regular fence. [..] I think my neighbour would be interested in joining.’
Respondent 12 (€600 estimation): ‘If my fence needs replacement, I would go
for this one. I would expect it to be cheaper than a regular fence, if it is made from plastic or recycled plastic.’
Barrel
The water barrel was one of the early prototype designs by Steeghs (2017) and Rindt (2017). The only two respondents that would not consider this option already had an IBC tank and did not want to downscale on capacity. Four respondents already owned a similar barrel, three others indicated that they would need multiple barrels to have enough capacity or to cover all rain pipes. One respondent suggested that the barrels should be modular, to that the capacity of one smart barrel can be easily expanded. Two respondents (QR11, QR12) did not like the design.
Respondent 11 (€150 estimate): ‘I don’t like this design. I think this would
cost €150, I wouldn’t pay more because I think it is ugly.’
Respondent 12 (€320 estimate): ‘If it was smaller, I would buy it. Or if it has
a wooden-look or if it is anthracite coloured.’
IBC tank
The final prototype is made with a 600L IBC tank, the trial is set out to be with 1000L IBC tanks. This can be a major flaw in the trial, because four respondents indicate they cannot fit such a tank in their garden (QR12). Four others do not reject the design immediately, but require the tank to be covered in wood (QR4). Even then, they would have serious doubts or prefer other options (QR6).
Respondent 4 (€300 estimate): ‘At least I would want it covered in wood. I
would prefer previous options, because this is quite big in a small garden.
Respondent 6 (no estimate): ‘That is big. If I would want one, it must be covered with wood. I doubt whether I would want this in my garden.’
Respondent 12 (€80 estimate): ‘You would need a gigantic garden to hide
Out of the five respondents that would consider the IBC tank more seriously, four already have water buffers of 200L+. The other (respondent 9) wants to use the water buffer to reduce the peak flow in his own garden. All of these respondents already utilize large amounts of rain water and want to preserve or expand their capacity. Of this group, two already have an IBC tank and two others would prefer an underground tank. Respondents that do not need such capacity show little willingness to adopt such a system.
Underground
An underground tank provides another garden-based solution. As it is the most complicated solution, it is also the least suitable for most. Only the four respondents that would prefer the system seriously consider it (QR 9). Six respondents immediately indicated that they would not consider this design. Three of them simply because they are not able to bury it in the garden, three others because it is too expensive, difficult to install or has more downsides over alternatives. The other respondents would only conditionally consider this design, if they would get a subsidy (QR8) or if they had to renovate their garden (QR12).
Respondent 8 (estimate €2000): ‘There is clearly subsidy needed to realize
this. It is not easy to install yourself.
Respondent 9 (estimate €1000 tank only): ‘This is ideal for me, I’m planning
on doing this within the next few years.
Respondent 12 (estimate €1200): ‘If I would renovate my garden, I would
consider it.’
DIY kit
Innovators are known to be familiar with the technology and like to play with it. The final option is a do-it-yourself kit, where users make their own rainwater buffer smart. Four respondents indicate they cannot or do not want to install the system themselves (QR4). The other eight would be comfortable with a kit, or which four would prefer is over the other designs (QR5). Respondent 8 and 9 would prefer a DIY-kit for the short term, and an underground solution for the long term. Three respondents would need detailed instructions for installation (QR13).
Respondent 4: ‘I’m not that handy, I need someone to install it for me.’
Respondent 5 (estimate €100): ‘If I would join the trial, I would say: give me
Respondent 13: ‘I like tinkering, I’m not super good at it, but I can install something.’
Investment
In addition to the amount respondents are willing to pay, the preferred structure was also analysed. This included the possibility of a spread payment in yearly or monthly terms, as well as incorporating the investment into a mark-up on the sewage fee, or an expected discount after installing a smart rainwater buffer. Six respondents indicated they would prefer a single investment (QR4), and did not expect any tax benefits. One respondent did also prefer a single payment, but expected a tax discount to be logical, without specifying any amount.
Respondent 4: ‘I generally like to do a single investment, no periodical
payment. [..] I would pay it in once up till €3000, if it would be more I would invest in
solar panels.’
The other six responded showed interest in a spread payment, as a loan. For each respondent, the conditions and preferences can be found in table 3. What is notable, is that four of them indicated they would only consider a spread payment, for large amounts. All of them indicated they would prefer a solution which is within their one-payment budget. The other two showed interest, but did not name it as precondition. Effectively the investment structure seems to be of no influence to the buying intention of all respondents.
Resp. Condition Preference
1 Large amounts spread over two years DIY kit (€200)
2 Large amounts spread over two years DIY kit (€400)
5 €1500+ over 10 years via tax DIY (€100), long term underground (€2000) 9 Dependent on interest DIY (€100), long term underground (€1000)
10 Would consider Underground (€400)
[image:34.612.67.528.479.622.2]11 €200+ Barrel (€200)
6.3 Conclusion
The following part draws conclusions from the observed results. The first part answers the research question on which factors influence the attitude of innovators towards adopting a smart rainwater buffer. The respondents scored high on environmental knowledge and values. This can be expected from innovators, as they are generally involved in the technology and the functionalities. For the general public, the scores are expected to be lower. Therefore, it is interesting to notice that the results show that a significant number of respondents is unaware of the sewage tax fees, and falsely think that their insurance covers flood damages.
The respondents showed large involvement in pro-environmental behaviour (Q1). The majority (10/13) already buffers rainwater, and six people have solar panels installed. This is in line with the expectation that environmental knowledge and valuation precede pro-environmental behaviour. When asked on their motivation, 12/13 named sustainability as a main motivation (Q2). For large investments like solar panels, the return on investment was an important factor. As for the motivation to participate in smart rainwater buffering (Q5), 12/13 indicate it is for usage in the garden, three respondents specified it would be a waste to use tap water, one respondent mentioned reducing the strain on the sewage system. Three others indicated that they need a solution due to a lack of sewage connection. This reveals a difference in motivation. Whereas in previous pro-environmental behaviour people would often refer to the global environment, the motivation for rainwater buffering is often personal and limited to reducing water usage. This is while each respondent is aware of the increased strain due to pavement (EK 4) and the problems with the current sewage system (EK 10).
The analysis of political factors (Q3) revealed a lack of institutional willingness and lack of personal attention. People often accuse the municipality of mismanagement and a lack of decisiveness, mostly on cases outside this project. Respondents that were positive on the political environment were often personally contacted to participate in pro-environmental projects. Other respondents indicate that they would play an active role in such projects, but expect to be approached to participate.
Previous experiences with floods increases the awareness of the sewage problem (Q4). None of the participants were forced to take measures due to flooding problems. The influence of people in their environment which had such experiences is variable and very personal. Some might be influenced by those experiences, others seem not to be bothered at all.
if the price for a smart one is high. The different designs showed that the rain barrel and the DIY provide the most universally applicable and most favourable solution (Q7). Some respondents indicated to have strong preference or a strong rejection for certain systems, thus a flexible solution would be most preferable. In this solution, a rainwater buffer can be made smart with a separate module and can be attached to an existing or new buffer. When asked on the preferred financing structure, 2/13 respondents showed interest in a spread payment regardless of the price, 4/13 only for large amounts and would prefer the solution to be in their single-payment-budget. The majority of respondents prefers a single payment. The investment term seems to be of no influence towards the intention to adopt a smart rainwater buffer.
The following part answers the research question on the design of an adoption strategy for the early adopters. The strategy is based on an antecedent strategy, which results in an informational invention and consequence strategy, which results in a structural intervention. Both interventions are explained in chapter 6.4.
Antecedent strategy
Antecedent strategies are aimed at factors that precede behaviour. They may rise problem awareness, inform about choice options and inform about positive or negative consequences. The results reveal that the respondents are aware of the water management problem, and the strain of rain water on the sewage system. Respondents are also aware that this is caused by pavement and rainwater drainage into the sewer. However, there is a strong indication that that there is ignorance on the liability of flood damages and the sewage tax rate. Antecedent strategies for early adopters should focus on informing: 1) the existence of the smart rainwater buffer as a solution to reduce rainwater strain on the sewage system. 2) about the personal liability of flood damages. 3) about the sewage tax rate and increasing costs.
Consequence strategy
6.4 Introduction strategy
6.4.1 Informational intervention
[image:37.612.75.525.259.693.2]Informational strategies are aimed at internal factors and are aimed to increase knowledge, influence attitudes and to show social support. To describe the informational intervention in more detail, the four stages of the AIDA-model are used (Strong, 1925). This is a marketingmodel that descibes the future customer jouney of the purchase of a smart rainwater buffer, based on the findings of this research. This customer journey is represented by a funnel, which consists of four consecutive phases: Awareness, Interest, Desire and Action. The visual representation of this funnel can be found in figure 9. Since the smart rainwater buffer is still in development, stage 0 is added as a pre-condition.
Stage 0: Development
The first step is to upscale the effect of the prototype to the combined effect of dozens of smart rainwater buffers. The trial should reveal the degree of water storage and the further potential for upscaling, combined with performance and user interface optimization. To achieve those goals, the trial ideally consists of 30 people, as included in the original plan. With the limited response to the interview invite for this research, and the inability to place IBC tanks for some respondents, the DIY kit with optional buffer and installation would be most suited for the trail. To find enough participants, a second news item urging inhabitants to participate in the trial should be placed in local news and the Sax and U-Today. The first article generated response, but as innovators often have ties with the academic world, more can be expected from media related to the University of Twente and Saxion. If the trial is successful, and there is a marketable product, the informational intervention can commence.
Stage 1: Awareness
In the first phase, the early adopters will first be aware of the smart rainwater buffer. This is the first contact and should therefore immediately draw the attention of the lead and make it curious. The first step is to identify the target group, the early adopters.
Early adopters are potential customers who have a problem, know they have the problem and are actively seeking a solution. Early adopters are often quite active on social media and often publicize new innovations, that help promote it to other adopters. The main problem that the smart rainwater buffer is aiming to solve, is the strain on the sewage system, to prevent flooding. In that definition, the municipality and water board are clearly early adopters. Next is the environmentally conscious citizen, that wants to minimize its environmental footprint. These are often leading community members and often are active in (local) politics or nature and environmental organizations (as associated with Stichting Natuur- en Milieuraad Enschede). This group can be directly contacted, or via the following channels.
There is a strong hype being created around the term ‘start-up’. Tonnie can use this to boost awareness via media. All local media (U-Today, Sax, Tubantia) should receive a press release focusing on a new start-up that launches a smart rainwater buffer, with a reference to the website.
The university and the municipality should propagate this project, and place smart rainwater buffers visibly in public spaces. Social support and the existence of role models can strengthen social norms and effectively inform actors (Steg, 2009). The buffers should have an attractive design, possibly in co-operation with (ArtEZ) artists. These buffers can contain a small info-panel with reference to the website, or a QR-code. Such showcases can improve the visibility of institutional projects, as interviewees indicated a lack of institutional examples. The smart rainwater barrel can also be offered via other existing outlets. Mijnwaterfabriek.nl, which focusses on sustainable water systems already showed interest in the technique, but also more ‘traditional’ rainwater barrel vendors might be interested. If the ‘smart part’ can be made into a module, it can be attached to regular rain barrels, and construction markets like Karwei, Gamma, Praxis, Kwantum and Welkoop might be interested. In bullet points, awareness can be created via:
• Direct approach: innovator environment, environmental organizations, policy makers • News: UT-start-up to launch Tonnie, the smart rainwater buffer, U-Today, Sax, Tubantia • Social media: targeted promotion
• Public space: visible (art) rainwater buffers, with info + QR • Partner with regular rain barrel outlets
• Website: sing-up for trial (early stage), newsletter (in production), information and sales (final product)
Step 2: Interest
After creating awareness, the second phase is to create interest in the smart rainwater buffer. The leads have recently received messages about the smart rainwater buffer. In this phase it is important to communicate relevant, personalized information. This information should be available on all platforms for which awareness is created. These mainly include the website and more extensive (social) media posts and pages. This research identified relevant motivations amongst the respondents, which can be used to create interest for the early adopters. The main motivations are personal use and sustainability. The research also revealed ignorance on the liability of flood damages and the height of the sewage tax, which both can be relevant factors in creating interest.
convenience of a rainwater barrel, the benefits of using rainwater for plants and the possibility of installing an automatic dripping system.
The sustainability argument is in line with the awareness of the smart rainwater buffer solution and should have an undertone in all communications. In the interest stage, people should be informed that the smart rainwater buffer reduces the strain on the sewage system, which reduces the risk of floods. Solidarity for lower parts of the city is an additional argument.
The height of the sewage tax and liability of flood damages are arguments of which a large group is not aware of, but can create strong interest. This can be combined into a message that emphasizes the efforts of the municipality, which are now covered with a tax of €220, and increasing due to increasing costs. Citizens now have the ability to contribute to minimize the increasing costs and reduce the chances of a flood, of which they are liable in case of damages. In bullet points, interest can be created via:
• Personal motives: o Convenience, o Benefits for plats o Dripping system • Sustainable motives:
o Height of increasing sewage tax o Own liability for flood damages
Step 3: Desire
In the next phase, the interest has to be converted into desire for the smart rainwater buffer. In this phase, the lead must be convinced that Tonnie is the solution for their problem. This will be strengthened by naming the benefits and knowing the wishes and needs of the leads. In addition, it is important that any objections are invalidated at this stage before moving on to the next and final phase.
To fully utilize all the benefits that are presented, it is helpful to include a tool on the website that calculates the size of the water buffer needed. Primarily this should focus on the rooftop area on which the buffer is connected, so that it can effectively reduce the strain. Possible standards could be 50L per m2. Heavy rain is defined as 50mm per day, which occurs once in 10 years (kmni.nl, 2018). The same tool can also be used to calculate how much capacity is needed to water a garden. Plants need an average of 20L per m2 per week, which could be a good minimum capacity (milieucentraal.nl, 2018).
can be included in the caculation tool, which can predict a return on investment. This can stimulate higher investments in rainwater buffering, as respondents indicated that a return on investment is a motivation for expensive pro-environmental investments such as solar panels. In bullet points, desire can be created via:
• Website calculator: based on water needed and rooftop size • Structural benefits
o One-year exemption on current sewage tax o Discount on differentiated rainwater tax
Step 4: Action
In the final phase, the choice to purchase/adopt a smart rainwater buffer is made. In this phase, everything is centralized on the purchase of the buffer. It is important that it is clear where Tonnie can be bought, and what the options are. When the leads have gone into action, the goal of the campaign has been reached. This research found that there are strong preferences and rejections for certain buffer designs. The final offer should therefore be personal and customizable. Customers should have the option to purchase a DIY-kit, with optional buffer designs and optional installation. These costs can be included into the described calculation tool, or a different one that presents the different offers. This tool should include a reiterating of the benefits per design, including financial benefits by structural interventions, optionally based on the customer’s rooftop or garden area. The action can be finalized by purchasing the smart rainwater buffer, or by requesting a personal consult. In bullet points, action can be created via:
• Modularized offer: o Based on DIY kit o Optional buffer o Optional installation
o Calculation tool (or consult option)
6.4.2 Structural intervention
the rainwater management problem, the municipality needs to apply structural adjustments to change the contextual factors to decrease costs and create benefits, such as differentiated sewage tax and/or co-payment and proportional investment subsidies.
The sewage tax can be designed in many different ways. Under the current system, every household (under 5000m3) pays the same amount of sewage tax for wastewater and rainwater combined. Van der Velde and Teekens (2016) proposed multiple options for a differentiated sewage tax rate. In this proposal 50% of the tax costs is based on wastewater and is imposed on households, the other 50% is based on rainwater and is imposed on landowners. Within the rainwater part there are three reasonable options: 1. Levy on the basis of WOZ value. 2. Levy on the basis of m2 discharging hardened surface. 3. Levy on the basis of the plot area and the granted water label. The water label is based on the amount of rainwater that is drained to public space (sewer), where an A-label (no drainage) gives a 50% discount on the rainwater fee. For a sewage tax of €220, this would mean a discount of €55 (25%). If the municipality acknowledges the impact of the smart rainwater buffer, it could contribute to achieving the A-label and the corresponding discount. These structural adjustments would create a return on investment for the smart rainwater buffer. However, it is noted that such changes require courageous policy makers, based on the conviction that it contributes to making the city more sustainable. This plan must still be substantiated in terms of content and law, but the smart rainwater buffer can certainly contribute and benefit from those plans.
7. Evaluation Discussion
This study is unable to encompass the entire spectrum of behavioural science. Human behaviour is complex and there are many theories on what influences it. This report aims to use the most accepted and renowed theories and their constructs and apply them to the rather noval case of rainwater buffering. There are many other theories and possible research methods, which may have lead to different results.
The reader should bear in mind that the study is based on a small group of people and the results are indicative. There is no baseline group to compare the results with, and the results have no empirical weight. To ensure validation, all questions (EK, EV Q) are based on questions from peer-reviewed research, mostly by Kaiser et al. (2005) and Kollmuss and Agyeman (2002). Especially the environmental knowledge and value statements, of which some directly come from Kaiser et al. (2005). This means that the results from the environemtnal knowledge and values statements indicate that the respondents score high, but research with a larger group of respondents should reveal if it is higher than the average person. What these questions do reveal is the individual knowledge of the respondents, so it can be concluded that some of them are not aware of the liability of flood damage (EK8) and the hight of the sewage tax (EK11).
Successful introduction
This research focusses on the introduction of a smart rainwater buffer. The goal is a successful introduction. The definition of a successful introduction might differ amongst the stakeholders. The municipality names multiple goals in their vision ‘Watervisie Enschede 2013 - 2025 Water verbindt. The smart rainwater buffer has the potential to contribute to three of them: to create awareness and participation in the water facilities amongst residents, to detach rainwater from sewage systems to lower the load and possibly to restrain increasing costs for water filtration. The municipality has acknowledged that this project has the potential to contribute to these goals, but not to which extend. Hendrikjan Teekens from the municipality mentioned that there are multiple structural projects that aim to (partially) solve the water management problem. He also mentioned that he valued the resident involvement of this project. This means that the potential cost-saving benefits of the smart rainwater buffer projects may be lower, and there may be little willingness by the municipality to participate in structural strategies involving subsidies and new tax rules. Therefore, the municipality might consider the introduction successful, if it leads to more awareness and participation amongst residents, without making a significant impact on the water management problem.
For the water authorities, the University of Twente and the residents, the introduction might only be labelled successful if it does make a significant impact on the water management problem. Vetter (2017) specified this significant impact to a reduction of the runoff of 7.000 m3 rainwater in area of the Oldenzaalsestraat. The Oldenzaalsestraat runs through the neighbourhoods Enschede -Noord and Binnensingelgebied. These two neighbourhoods combined have 23.985 households (10743 +13242), of which 14.358 (6016+8342) are multi-family (flats, apartments) and probably have a shared rainwater drainage (Overzichtspagina voor de gemeente Enschede, 2018). The majority of these households are not individually responsible for their rainwater drainage. The remaining 9.627 households would have to buffer at least 730L each to create this capacity.
for the whole municipality would be 7.140m3. It is unknown how much of the rainwater is actually drained into the sewer.
The average water usage per person is 119L per day (vitens.nl, 2018). The neighbourhoods Enschede-Noord and Binnensingelgebied have a total of 44.810 inhabitants (25.115 +19.695) (Overzichtspagina voor de gemeente Enschede, 2018), which would make a total of 5.332 m3 or 5.332.390 L of wastewater. This would suggest that on a rainy day the strain on the sewage system may reach 7.000m3, if there falls 1.668m3 of rainwater. This would require 138mm of rain in those two neighbourhoods alone (1.668/12100), which would be double the average rainfall for a whole month and therefore very unlikely.