http://go.warwick.ac.uk/lib-publications
Original citation:
Thoroughgood, T. D., et al. (2005). The component masses of the cataclysmic variable
V347 Puppis. Monthly Notices of the Royal Astronomical Society, 357(3), pp. 881-894.
Permanent WRAP url:
http://wrap.warwick.ac.uk/50087
Copyright and reuse:
The Warwick Research Archive Portal (WRAP) makes the work of researchers of the
University of Warwick available open access under the following conditions. Copyright ©
and all moral rights to the version of the paper presented here belong to the individual
author(s) and/or other copyright owners. To the extent reasonable and practicable the
material made available in WRAP has been checked for eligibility before being made
available.
Copies of full items can be used for personal research or study, educational, or
not-for-profit purposes without prior permission or charge. Provided that the authors, title and
full bibliographic details are credited, a hyperlink and/or URL is given for the original
metadata page and the content is not changed in any way.
Publisher’s statement:
The definitive version is available at
www.blackwell-synergy.com
http://dx.doi.org/10.1111/j.1365-2966.2004.08613.x
A note on versions:
The version presented here is a working paper or pre-print that may be later published
elsewhere. If a published version is known of, the above WRAP url will contain details
on finding it.
arXiv:astro-ph/0411555v1 19 Nov 2004
The component masses of the cataclysmic variable
V347 Puppis
T. D. Thoroughgood,
1⋆V. S. Dhillon,
1D. Steeghs,
2C. A. Watson,
1D. A. H. Buckley,
3S. P. Littlefair,
4D. A. Smith,
1,5M. Still,
6†
K. J. van der Heyden,
3B. Warner
71Department of Physics and Astronomy, University of Sheffield, Sheffield, S3 7RH, UK
2Harvard-Smithsonian Center for Astrophysics, 60 Garden Street, MS-67, Cambridge, MA 02138, USA
3South African Astronomical Observatory, PO Box 9, Observatory 7935, Cape Town, South Africa
4School of Physics, University of Exeter, Stocker Road, Exeter, EX4, UK
5Winchester College, Winchester, SO23 9LX, UK
6NASA/Goddard Space Flight Center, Code 662, Greenbelt, MD 20771, USA
7Department of Astronomy, University of Cape Town, Private Bag, Rondebosch 7700, South Africa
Accepted for publication in the Monthly Notices of the Royal Astronomical Society
2 February 2008
ABSTRACT
We present time–resolved spectroscopy and photometry of the double–lined eclipsing cataclysmic variable V347 Pup (= LB 1800). There is evidence of irradiation on the inner hemisphere of the secondary star, which we correct for using a model to give a secondary star radial velocity of KR = 198 ± 5 km s−1. The rotational velocity
of the secondary star in V347 Pup is found to be vsini = 131 ± 5 km s−1 and the
system inclination is i = 84.0◦
±2.3◦. From these parameters we obtain masses of
M1 = 0.63 ±0.04 M⊙ for the white dwarf primary and M2 = 0.52 ±0.06 M⊙ for
the M0.5V secondary star, giving a mass ratio of q = 0.83± 0.05. On the basis of the component masses, and the spectral type and radius of the secondary star in V347 Pup, we find tentative evidence for an evolved companion. V347 Pup shows many of the characteristics of the SW Sex stars, exhibiting single–peaked emission lines, high–velocity S–wave components and phase–offsets in the radial velocity curve. We find spiral arms in the accretion disc of V347 Pup and measure the disc radius to be close to the maximum allowed in a pressureless disc.
Key words: accretion, accretion discs – binaries: eclipsing – binaries: spectroscopic – stars: individual: V347 Pup – novae, cataclysmic variables.
1 INTRODUCTION
Cataclysmic variables (CVs) are close binary stars consist-ing of a red–dwarf secondary transferrconsist-ing material onto a white dwarf primary via an accretion disc or magnetic ac-cretion stream. V347 Pup is an example of a nova–like vari-able (NL), a class of CV with high mass transfer rates and no recorded nova or dwarf–nova type outbursts; see Warner (1995a) for a comprehensive review of CVs.
⋆ E-mail: [email protected] † Also Universities Space Research Association
motion because of contamination from, for example, the bright spot. At present, reliable masses are known for only ∼20 CVs, partly due to the difficulties in measurement (see Smith & Dhillon 1998 for a review).
V347 Pup was identified spectroscopically as a NL by Buckley et al. (1990) from the presence of high–excitation emission lines. Even though V347 Pup emits at X-ray wave-lengths (as the Uhuru X-ray source 4U 0608–49), the NL classification was favoured over a magnetic CV class on ac-count of the negligible polarisation present. The study by Buckley et al. (1990) revealed a bright and deeply eclips-ing system, with a spectroscopic and photometric orbital period of 5.57 hrs. Their measured system inclination and emission–line radial velocity curve, together with an empir-ical secondary star mass estimated from the orbital period, suggested a high primary mass close to the Chandrasekhar limit.
A multiwavelength study by Mauche et al. (1994) re-vealed an X-ray spectral energy distribution similar to many dwarf novae in outburst, with a likely origin in an ex-tended emission region rather than the boundary layer. The UV emission lines appear to have a similar origin and, in a later paper by Shlosman, Vitello & Mauche (1996), their behaviour in eclipse was sucessfully modelled as disc light scattered in a rotating wind. The presence of an accre-tion disc in V347 Pup was confirmed by a rotaaccre-tional dis-turbance of the optical emission lines through primary eclipse (Mauche et al. 1994; Still, Buckley & Garlick 1998). The latter authors found evidence for spiral arms and disc overflow accretion, and identified the low-excitation optical emission profiles as a composite of emission from the accre-tion disc and secondary star.
Secondary star absorption lines were found by Diaz & Hubeny (1999), who measured the system pa-rameters of V347 Pup using the radial velocity semi– amplitudes of the primary and secondary stars. The ra-dial velocity of the optical emission lines in V347 Pup varies widely in the literature, with published values of 134 ± 9 km s−1 (Buckley et al. 1990), 122 ± 19
km s−1 (Mauche et al. 1994), 156 ± 10 km s−1, 125 ± 13
km s−1(Still, Buckley & Garlick 1998) and 193±16 km s−1
(Diaz & Hubeny 1999). The radial velocities of the UV emis-sion lines published by Mauche et al. (1994) ranged between 220 and 370 km s−1with large phase shifts between
spectro-scopic conjuction and photometric mid–eclipse. This wide range in values, and the known unreliability of using disc emission lines in NLs to determine the motion of the white dwarf (e.g. Dhillon, Marsh & Jones 1997), makes the deter-mination of system parameters from the secondary star fea-tures alone highly desirable. In this paper, we derive the system parameters from the radial and rotational velocities of the secondary star in V347 Pup.
2 OBSERVATIONS AND REDUCTION
During January and December 1998 and January 1999, we obtained optical spectra of V347 Pup using the Cassegrain spectrograph + SITe1 CCD chip on the SAAO 1.9-m tele-scope. Simultaneous photometry was available for most of the spectra using the SAAO 1.0-m telescope with the TEK8 CCD chip. See Table 1 and its caption for full details.
On the December 1998 run, we observed 17 spectral type templates ranging from G7V–M5.5V and telluric stars to remove atmospheric features. We observed flux standards on both the 1.9-m and 1.0-m telescopes on all nights.
The spectra and images were reduced using stan-dard procedures (e.g. Dhillon, Jones & Marsh 1994; Thoroughgood et al. 2001). The photometry data were corrected for the effects of atmospheric extinction by subtracting the magnitude of a nearby comparison star. The absolute photometry is accurate to approximately±0.5 mJy; the relative photometry to ±0.01 mag. Comparison arc spectra were taken every∼40 min in order to calibrate the wavelength scale and instrumental flexure. The arcs were fitted with fourth–order polynomials with an rms scatter of better than 0.04˚A. Where possible, slit losses were then corrected for by multiplying each V347 Pup spectrum by the ratio of the flux in the spectrum (over the whole spectral range) to the corresponding photometric flux.
3 RESULTS
3.1 Ephemeris
The times of mid–eclipse for V347 Pup were determined by fitting a parabola to the eclipse minima in the photometry data. A least–squares fit to the 21 eclipse timings listed in Table 2 yields the ephemeris:
Tmid−eclipse= HJD 2 446 836.96176 + 0.231936060 E
±0.00009 ± 0.000000006. (1)
Our new ephemeris is exactly the same as that given by Baptista & Cieslinski (1991), except we have reduced the errors on both the zero point and orbital period. We find no evidence for any systematic variation in the O–C values listed in Table 2.
3.2 Average spectrum
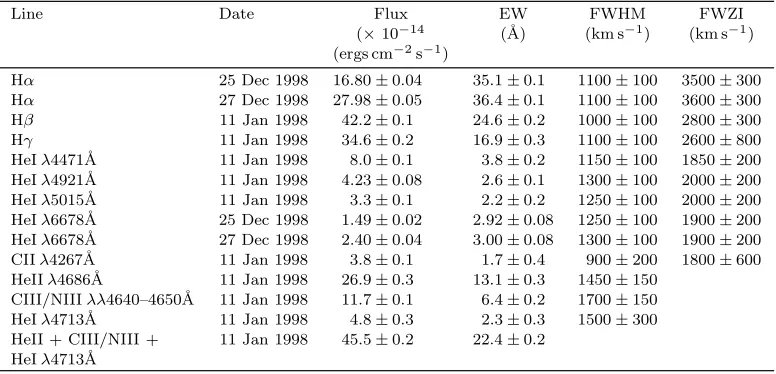
The average spectra of V347 Pup, uncorrected for orbital motion, are shown in Fig. 1. In Table 3, we list fluxes, equiv-alent widths and velocity widths of the most prominent lines measured from the average spectra.
The Balmer emission lines are broad, symmetric and single–peaked, instead of the double–peaked profile one would expect from a high inclination accretion disc (e.g. Horne & Marsh 1986). This behaviour is characteristic of the SW Sex stars (e.g. Dhillon, Marsh & Jones 1997). Previous studies of V347 Pup by Buckley et al. (1990) and Diaz & Hubeny (1999) agree with this single– peaked observation, however, the study by Still, Buckley & Garlick (1998) shows double–peaked low excitation lines (although this could be due to the presence of absorption cores). The HeIλ6678˚A line appears to be composed of a narrow single–peaked component superimposed upon a broad double–peaked component. The other HeI emission lines can clearly be seen in the wavelength region centred onλ4610˚A as double peaked in nature, with the possible exception of HeI λ4471˚A. High– excitation emission is present through HeIλ4686˚A and the CIII/NIIIλλ4640–4650˚A Bowen fluoresence complex.
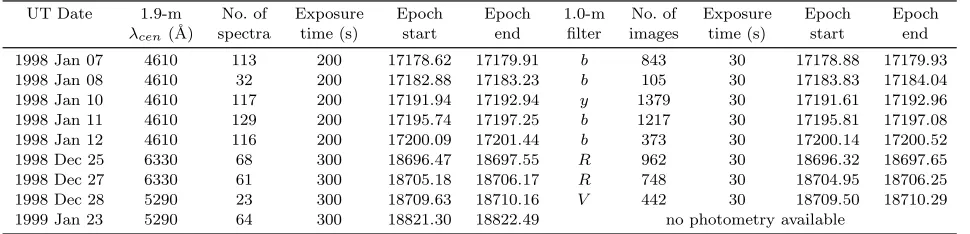
Table 1.Journal of observations. During Jan 1998, we used Grating No. 4 to give a wavelength range of∼4200–5060˚A (λcen= 4610˚A) at 0.99-˚A (64 km s−1) resolution. Grating No. 4 was again used on 28 Dec 1998 and 23 Jan 1999 to give a wavelength range of∼4900–
5720˚A (λcen= 5290˚A) at 0.95-˚A (54 km s−1) resolution. On 25 and 27 Dec 1998, we used Grating No. 5 to give a wavelength range of ∼5960–6725˚A (λcen= 6330˚A) at 0.88-˚A (42 km s−1) resolution. Simultaneous photometry for the December 1998 spectra was recorded in the Johnson–CousinsV andRbands. Photometry was also available during the January 1998 run in the Str¨omgrenbandy filters. The seeing measured around 1.0 arcsec with photometric conditions on 25 and 27 Dec 1998 and Jan 23 1999. On 28 Dec 1998, however, the seeing was poor and patchy high cloud was present. The seeing varied between 1.0–1.5 arcsec over the January 1998 run. The epochs are calculated using the new ephemeris presented in this paper (equation 1).
UT Date 1.9-m No. of Exposure Epoch Epoch 1.0-m No. of Exposure Epoch Epoch
[image:4.612.43.287.320.568.2]λcen(˚A) spectra time (s) start end filter images time (s) start end 1998 Jan 07 4610 113 200 17178.62 17179.91 b 843 30 17178.88 17179.93 1998 Jan 08 4610 32 200 17182.88 17183.23 b 105 30 17183.83 17184.04 1998 Jan 10 4610 117 200 17191.94 17192.94 y 1379 30 17191.61 17192.96 1998 Jan 11 4610 129 200 17195.74 17197.25 b 1217 30 17195.81 17197.08 1998 Jan 12 4610 116 200 17200.09 17201.44 b 373 30 17200.14 17200.52 1998 Dec 25 6330 68 300 18696.47 18697.55 R 962 30 18696.32 18697.65 1998 Dec 27 6330 61 300 18705.18 18706.17 R 748 30 18704.95 18706.25 1998 Dec 28 5290 23 300 18709.63 18710.16 V 442 30 18709.50 18710.29 1999 Jan 23 5290 64 300 18821.30 18822.49 no photometry available
Table 2.Times of mid–eclipse for V347 Pup according to Buckley et al. (1990; B90), Baptista & Cieslinski (1991; BC91) and this paper.
Cycle HJD Uncertainty O–C Reference (E) at mid–eclipse on HJD (secs)
(2,400,000+)
–4 46836.0379 5x10⁻⁴ 335.96 B90
0 46836.9621 5x10⁻⁴ 29.74 B90
39 46846.0059 5x10⁻⁴ –117.69 B90
43 46846.9333 5x10⁻⁴ –147.43 B90
48 46848.0930 5x10⁻⁴ –145.73 B90
56 46849.9500 5x10⁻⁴ –15.13 B90
65 46852.0373 5x10⁻⁴ –25.89 B90
69 46852.9651 5x10⁻⁴ –21.08 B90
78 46855.0533 5x10⁻⁴ 45.92 B90
6177 48269.63136 1.5x10⁻⁴ 48.28 BC91
7583 48595.73325 1.1x10⁻⁴ 30.04 BC91
7587 48596.66022 9x10⁻⁵ –36.85 BC91
17179 50821.39199 5x10⁻⁴ 56.29 This paper
17184 50822.55127 5x10⁻⁴ 21.70 This paper
17192 50824.40676 5x10⁻⁴ 21.83 This paper
17196 50825.33428 5x10⁻⁴ 2.46 This paper
17197 50825.56611 5x10⁻⁴ –6.70 This paper
18697 51173.47035 1x10⁻⁴ 6.20 This paper
18705 51175.32562 1x10⁻⁴ –12.68 This paper
18706 51175.55802 1x10⁻⁴ 26.54 This paper
18710 51176.48519 1x10⁻⁴ –22.21 This paper
CaI, FeI and MgI, as seen in Diaz & Hubeny (1999). Sec-ondary star features in the SW Sex stars are not un-usual in the longer period systems, such as BT Mon (Smith, Dhillon & Marsh 1998), AC Cnc and V363 Aur (Thoroughgood et al. 2004).
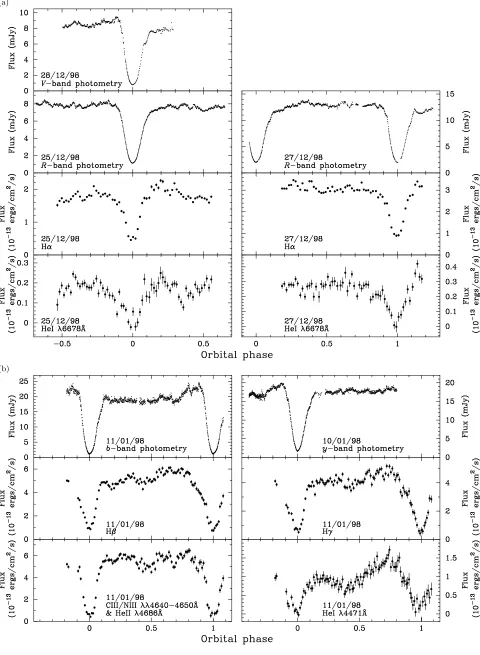
3.3 Light curves
Fig. 2 shows the broad–band and emission–line light curves of V347 Pup. The emission–line light curves were produced by subtracting a polynomial fit to the continuum and sum-ming the residual flux. All light curves are plotted as a func-tion of phase following the ephemeris derived in Secfunc-tion 3.1. The b, y, V and R–band light curves show deep,
asymmetrical primary eclipses with the egress lasting longer than ingress. Flickering is present in all light curves, as well as an increase in brightness approaching eclipse in theb,yand V–bands. Theband y–band data recorded in 1998 Jan show no significant brightness variations during the run, with out-of-eclipse magnitudes of 13.3 ± 0.1 in both filters. The eclipse depths are 3.2 and 2.6 mag, respectively. We measureR–band out-of-eclipse magnitudes of 14.00±0.05 mag on Dec 25, increasing in brightness to 13.45 ± 0.10 mag on Dec 27. The eclipse depth remains roughly the same at 2.1 mag and 2.0 mag, respectively. In the V–band, the out-of-eclipse magnitude is 14.10 ± 0.10 mag, with an eclipse depth of 2.6 mag. Photometric out-of-eclipse magnitudes in the literature range between 13.05–13.28 inRand 13.2–13.58 in V (Buckley et al. 1990, Mauche et al. 1994), suggesting that our observations in Dec 1998 find V347 Pup around 0.5–1 mag fainter. Long–term variations in the magnitudes of NLs are not un-common (e.g. Honeycutt 2001) and have been observed in other SW Sex stars (e.g. BH Lyn, Dhillon et al. 1992; DW UMa, Dhillon, Jones & Marsh 1994; PX And, Still, Dhillon & Jones 1995). Low states are often ac-companied by the weakening or disappearance of the high–excitation HeII and CIII/NIII lines, which were unfortunately not observed in Dec 1998. There is, however, a change in the HeI λ6678˚A Doppler maps between the two nights’ observations, which is considered in Section 3.4. Further evidence that V347 Pup exhibits changes of state is seen in the EWs of the emission lines between the observed epochs. For example, the EW of Hβ varies between 17.0±0.6˚A (July 1986, Buckley et al. 1990), 62.6 ±1.9˚A (April 1991, Mauche et al. 1994), 9.8± 0.1˚A (Jan 1995, Still, Buckley & Garlick 1998) and 24.6 ±0.2˚A (Jan 1998, this paper), although the high–excitation CIII/NIII complex has a constant EW between epochs.
We measured the phase half–width of eclipse at the out-of-eclipse level (∆φ) by timing the first and last contacts of the eclipse and dividing by two. Our average value of ∆φ
Figure 1.The average spectra for the three wavelength regions; the spectrum centred onλ4610˚A is an average of all spectra recorded on the Jan 1998 run, and has not been corrected for slit–losses. The spectrum centred onλ5290˚A is an average of all data recorded on 28 Dec 1998 and 23 Jan 1999, placed on an absolute flux scale (as determined from the 28 Dec 1998 photometry and flux standards). The spectrum centred onλ6330˚A is composed of all data from 25 and 27 Dec 1998 and has been placed on an absolute flux scale. All average spectra are uncorrected for orbital motion, resulting in smeared spectral features.
Table 3.Fluxes and widths of prominent lines in V347 Pup, measured from the 2 nights’ data centred onλ6330˚A and the night of 11 Jan 1998 centred onλ4610˚A. The full–width half–maximum (FWHM) velocities were determined from Gaussian fits, whereas the full–width zero–intensity (FWZI) velocities and their errors have been estimated by eye. HeIIλ4686˚A, CIII/NIIIλλ4640–4650˚A and HeIλ4713˚A are blended, so separate values of the flux and EW are given (determined from a triple–Gaussian fit) as well as the combined flux of the three.
Line Date Flux EW FWHM FWZI
(×10−14 (˚A) (km s−1) (km s−1)
(ergs cm−2s−1)
Hα 25 Dec 1998 16.80±0.04 35.1±0.1 1100±100 3500±300 Hα 27 Dec 1998 27.98±0.05 36.4±0.1 1100±100 3600±300 Hβ 11 Jan 1998 42.2±0.1 24.6±0.2 1000±100 2800±300 Hγ 11 Jan 1998 34.6±0.2 16.9±0.3 1100±100 2600±800 HeIλ4471˚A 11 Jan 1998 8.0±0.1 3.8±0.2 1150±100 1850±200 HeIλ4921˚A 11 Jan 1998 4.23±0.08 2.6±0.1 1300±100 2000±200 HeIλ5015˚A 11 Jan 1998 3.3±0.1 2.2±0.2 1250±100 2000±200 HeIλ6678˚A 25 Dec 1998 1.49±0.02 2.92±0.08 1250±100 1900±200 HeIλ6678˚A 27 Dec 1998 2.40±0.04 3.00±0.08 1300±100 1900±200 CIIλ4267˚A 11 Jan 1998 3.8±0.1 1.7±0.4 900±200 1800±600 HeIIλ4686˚A 11 Jan 1998 26.9±0.3 13.1±0.3 1450±150
CIII/NIIIλλ4640–4650˚A 11 Jan 1998 11.7±0.1 6.4±0.2 1700±150 HeIλ4713˚A 11 Jan 1998 4.8±0.3 2.3±0.3 1500±300 HeII + CIII/NIII + 11 Jan 1998 45.5±0.2 22.4±0.2
HeIλ4713˚A
the radius of the accretion disc in V347 Pup using the ge-ometric method outlined in Dhillon, Marsh & Jones (1991). Combining ∆φwith the system mass ratio and inclination derived in Section 3.10 gives an accretion disc radius (RD) of 0.72±0.09R1, whereR1is the volume radius of the
pri-mary’s Roche lobe. This value is in agreement with the value ofRD/R1≥0.82 quoted by Harrop-Allin & Warner (1996)
at the 2σlevel.
[image:5.612.100.488.429.616.2]The HeI eclipses are wide with V–shaped minima, similar to the SW Sex stars (e.g. Knigge et al. 2000). Note that the HeI flux is completely eclipsed, indicating an origin in the central portion of the disc, and not in an extended emis-sion region which is larger than the secondary star. The HeI
λ4471˚A emission line shows a broad dip in flux around phase 0.4, before climbing to reach a maximum around phase 0.75, which could be a further signature of the disc asymmetry.
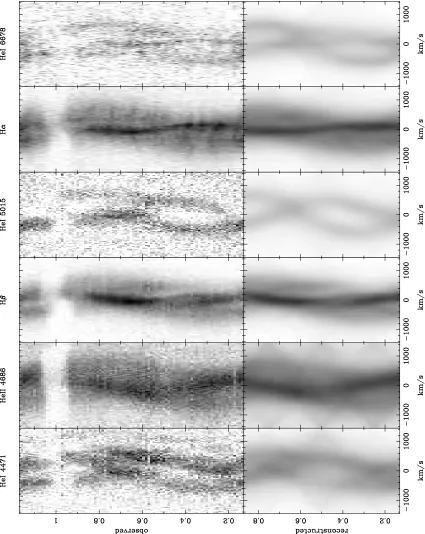
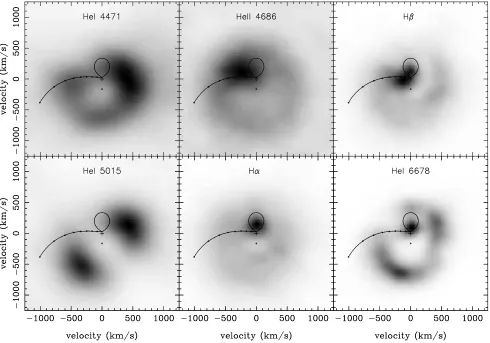
3.4 Trailed spectrum & Doppler tomography
We subtracted polynomial fits to the continuum and then rebinned the spectra onto a constant velocity–interval scale centred on the rest wavelength of the principal emission lines. For the data obtained in Jan 1998, we phase–binned all the spectra in order to boost the signal-to-noise (S/N). Individual spectra were weighted according to their S/N in order to optimally combine the spectra. The trailed spectra of Hα, Hβ, HeIIλ4686˚A and HeIλλ4471˚A, 5015˚A, 6678˚A are shown in Fig. 3. Doppler maps were calculated for the principal emission lines using the modulation Doppler to-mography code of Steeghs (2003). This method is an ex-tension to the conventional Doppler tomography technique (e.g. Marsh 2001), and maps both the constant and variable part of the line emission using a maximum–entropy regu-larised fitting procedure (Skilling & Bryan 1984). We found that the modulated contribution to the line emission was weak (< 1 per cent), and thus our S/N was not sufficient to detect significant modulation in the accretion disc emis-sion. We therefore plot in Fig. 4 the corresponding aver-age Doppler maps only. The reconstructed line profiles are plotted next to the observed ones in Fig. 3 for comparison. Good fits to the data were achieved in all cases (reduced
χ2= 1−1.4)
The Balmer–line trailed spectra are dominated by a low–velocity component with a semi–amplitude of ∼150 km s−1, moving from blue to red across primary eclipse. This
is consistent with emission from the irradiated inner face of the secondary star, which is clearly seen in the correspond-ing Doppler maps. In the Hβ map, a second low–velocity emission source is present, seemingly coincident with the gas stream at a distance of 0.9L1, whereL1 is the distance
from the white dwarf to the inner–Lagrangian point. There is also a weak two–armed disc asymmetry visible in the Hβemission, which is much more prominent in the double– peaked HeI emission lines. Doppler maps of V347 Pup have been produced by Still, Buckley & Garlick (1998) for data sets recorded in 1987, 1988 and 1995. The two compo-nents described above from the secondary star and the disc are clearly visible in their maps. The summed Hβ and Hγ
maps of Still, Buckley & Garlick (1998) show a stronger disc emission and spiral structure than our Balmer–line maps. The disc asymmetry is significant and is reminiscent of the two armed spiral structures that have been observed in the discs of dwarf novae during outburst (e.g. Steeghs 2001). We return to these in Section 4.1. The high–excitation HeII
λ4686˚A line is dominated by emission from the gas stream and bright spot overlayed on a weak accretion disc with radius RD ∼ 0.3 −0.4L1. Note that the HeII λ4686˚A
Doppler map shows emission at higher velocities than the low–excitation lines, demonstrating that the material origi-nates from closer to the white dwarf.
The blue and red HeI emission lines were recorded al-most a year apart and exhibit clear differences in structure. The secondary star emission is clearly evident in HeIλ6678˚A (Dec 1998), although no strong HeIλ4471˚A orλ5015˚A emis-sion can be seen in the Jan 1998 data. There is also a dif-ference in the HeIλ6678˚A Doppler maps between the 25th and 27th Dec 1998, which is probably related to the change in brightness of the system; the 25th Dec 1998 Doppler map has more enhanced spiral features and weaker secondary star emission than the 27th Dec (note that the average map of these two nights is shown in Fig. 4). During all these epochs, however, the spiral structures were observed, demonstrating that they are a persistent feature.
3.5 Radial velocity of the white dwarf
We measured the radial velocities of the emission lines in V347 Pup by applying the double–Gaussian method of Schneider & Young (1980), since this technique is sensitive mainly to the line wings and should therefore reflect the mo-tion of the white dwarf with the highest reliability. We tried Gaussians of widths 200, 300 and 400 km s−1
and we varied their separation from 200 to 3200 km s−1. We then fitted
V =γ−Ksin[2π(φ−φ0)] (2)
to each set of measurements, where V is the radial ve-locity, K the semi–amplitude, φ the orbital phase, and
φ0 is the phase at which the radial velocity curve crosses
from red to blue. Examples of the radial velocity curves measured for the Hα, Hβ, HeII λ4686˚A and HeI λ4471˚A emission lines are shown in Fig. 5. There is clear evidence of rotational disturbance in the emission lines, where the radial velocities measured just prior to eclipse are skewed to the red, and those measured after eclipse are skewed to the blue. This confirms the detection of a similar feature in the trailed spectra, and indicates that at least some of the emission must originate in the disc. There is also evidence of a phase shift in Hα and HeII λ4686˚A, where the spectroscopic conjunction of each line occurs after photometric mid–eclipse. This phase shift implies an emission–line source trailing the accretion disc, such as a bright spot, and is a common feature of SW Sex stars (e.g. DW UMa, Shafter, Hessman & Zhang 1988; V1315 Aql, Dhillon, Marsh & Jones 1991; SW Sex, Dhillon, Marsh & Jones 1997). There appear to be no significant phase shifts, however, in the other emission lines. Buckley et al. (1990), Mauche et al. (1994) and Diaz & Hubeny (1999) find no evidence of phase shift in any of their emission lines, although their errors onφ0were
much larger.
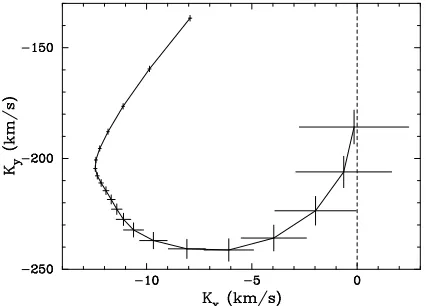
We tried to measure white dwarf radial ve-locity (KW) values using a diagnostic diagram (Shafter, Szkody & Thorstensen 1986), but with no success. We therefore attempted to make use of the light–centres method, as described by Marsh (1988). In the co-rotating co-ordinate system, the white dwarf has velocity (0,−KW), and symmetric emission, say from a disc, would be centred at that point. By plotting Kx = −Ksinφ0
versus Ky = −Kcosφ0 for the different radial velocity
fits (Fig. 6), one finds that the points move closer to the
(a)
[image:7.612.54.534.60.715.2](b)
Figure 3. Trailed spectra and data computed from the Doppler maps (Fig. 4). The blue data recorded in Jan 1998 have been phase binned into 200s bins, the red data recorded in Dec 1998 into 300s bins. Hγhas not been shown, as it is very similar in nature to Hβ.
spot, would result in this pattern, equivalent to a decrease in distortion as one measures emission further into the line wings and therefore more closely representing the velocity of the primary star. By linearly extrapolating the largest Gaussian separation on the Hαlight–centre diagram to the
Ky axis, we measure the radial velocity semi–amplitude of the white dwarf to be∼180 km s−1. The large uncertainty
in this value (∼40 km s−1), however, and the unsuccessful
application of the technique to the other emission lines, prompted us to proceed with the mass determination using the secondary star features alone.
3.6 Radial velocity of the secondary star
Figure 4. Doppler maps of the principal emission lines (Hγis not shown, as it is very similar in nature to Hβ). The cross marked on each Doppler map represents the centre of mass of the system and the open circle represents the white dwarf. These symbols, the Roche lobe of the secondary star and the predicted trajectory of the gas stream, have been plotted using theKR–corrected system parameters summarised in Table 5. The series of points along the gas stream mark the distance from the white dwarf at intervals of 0.1L1, ranging
from 1.0L1 at the red star to 0.2L1. Doppler tomography cannot properly account for variable line flux, so spectra around primary
eclipse were omitted from the fits.
regions of the spectra rich in absorption lines with a num-ber of templates with spectral types G7V–M3.5V. A tech-nique known as skew mapping was used to enhance the secondary features and obtain a measurement of the ra-dial velocity semi–amplitude of the secondary star (KR). See Vande Putte et al. (2003) for a detailed critique of skew mapping and Thoroughgood et al. (2004) for a successful application to AC Cnc and V363 Aur.
The data centred onλ5290˚A were recorded specifically to exploit the secondary star features found between the Hβ
and Hαlines. Unfortunately, the presence of weak emission lines (e.g. FeII multiplet 42 atλλ4924˚A, 5018˚A and 5169˚A, Mason & Howell 2003) hampered all efforts to determine a
KR value from these data. The dominance of the emission lines in the spectra centred onλ4610˚A also prevented aKR determination from these data. The red spectra of V347 Pup centred on λ6330˚A, however, allowed us to study the sec-ondary star through absorption features blueward of Hα, such as the CaI λ6162˚A line. Exactly the same conclusion was reached by Diaz & Hubeny (1999).
The first step was to shift the spectral type template stars to correct for their radial velocities. We then
normal-ized each spectrum by dividing by a constant and then sub-tracting a polynomial fit to the continuum. This ensures that line strength is preserved along the spectrum. The V347 Pup spectra were normalized in the same way. The template spec-tra were artificially broadened to account for both the or-bital smearing of the V347 Pup spectra due to their exposure times (texp), using the formula
V =texp2πKR
P (3)
tem-Figure 5.Radial velocity curves of Hα, Hβ, HeII λ4686˚A and HeI λ4471˚A using Gaussian widths of 300 km s−1 and a
sepa-ration of 1400 km s−1. We omitted the points around primary
[image:10.612.48.278.53.263.2]eclipse during the fitting procedure (open circles) as these mea-surements are affected by the rotational disturbance. The emis-sion lines recorded in Jan 1998 have been phase–binned into 100 bins for clarity.
Figure 6.Light–centres diagram for Hα. Points are plotted for radial velocity fits using Gaussians of FWHM = 300 km s−1, with
separations from 900 km s−1to 2900 km s−1at 100 km s−1
inter-vals. The points move anti–clockwise, towards theKx = 0 axis with increasing Gaussian separation.
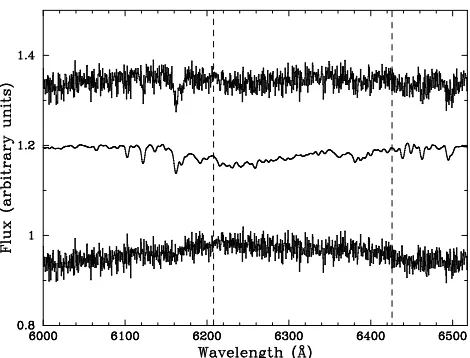
plates, and the final skew map is the one that gives the strongest peak.
The skew maps show well–defined peaks at Ky ≈ 216 km s−1 – the skew map of the M0.5V template is
shown in Fig. 7 together with the trailed CCFs. A sys-temic velocity of γ = 15 km s−1 was applied in order
to shift the skew map peaks onto the Kx = 0 axis (see Smith, Dhillon & Marsh 1998 for details). We there-fore adopt γ = 15 ± 5 km s−1 as the systemic
veloc-ity of V347 Pup, in excellent agreement with the val-ues of 16 ± 10 km s−1 and 15 ± 12 km s−1
[image:10.612.317.533.58.461.2]mea-sured by Still, Buckley & Garlick (1998) from the Balmer and HeII λ4686˚A emission lines. The γ velocities from
Figure 7. Skew maps (top) and trailed CCFs (bottom) of V347 Pup cross–correlated with a M0.5V dwarf template.
the emission lines shown in Fig. 5 ranged between 13 km s−1 and 44 km s−1. Other γ values measured from
optical emission lines vary widely in the literature (– 3 to 60 km s−1, Diaz & Hubeny 1999; –9 to 159 km s−1,
Mauche et al. 1994).
Our adoptedKR of 216±5 km s−1 was derived from the skew map peak of the best–fitting template found in Sec-tion 3.10. This result actually covers theKR values derived fromallof the template stars to within the errors, demon-strating that the result is robust to the choice of template (see Table 4).
3.7 Rotational velocity and spectral type of the secondary star
The spectral–type templates were broadened for smearing due to orbital motion, as before, and rotationally broadened by a range of velocities (50–240 km s−1). We then ran an
[image:10.612.56.269.363.516.2]aver-Table 4. vsini values for V347 Pup cross–correlated with the rotationally broadened profiles of G7 – M3.5V templates. Also shown is the factor used to multiply the template star features during optimal extraction, and the position of the strongest peak in the skewmaps derived from each template usingγ–velocities of 0 km s−1and 15 km s−1.
Templates vsini Optimal (Kx, Ky) (Kx, Ky) at minχ2 factor γ= 0 γ= 15
(km s−1) (km s−1) (km s−1)
G7V 134 0.32±0.05 (–26,212) (10,220) G9V 133 0.28±0.04 (–13,215) (13,220) K0V 133 0.23±0.03 (–2,217) (14,219) K1V 134 0.24±0.03 (–15,215) (8,220) K2V 133 0.20±0.03 (–22,212) (6,219) K3V 136 0.19±0.03 (–28,212) (0,217) K4V 135 0.14±0.02 (–17,211) (3,217) K5V 134 0.13±0.02 (–17,213) (1,218) K7V 133 0.12±0.02 (–24,210) (–3,216) M0.5V 130 0.13±0.02 (–18,213) (0,216) M1.5V 125 0.12±0.02 (–17,213) (–2,216) M2.5V 126 0.13±0.02 (–21,213) (–7,216) M3.5V 127 0.12±0.02 (–33,213) (–23,217)
age V347 Pup spectrum, adjusting the constant to minimize the scatter in the residual. (Normalisation was carried out in the same way as Section 3.6, except that this time, the spectra were set to unity.) The scatter is measured by carry-ing out the subtraction and then computcarry-ing theχ2between the residual spectrum and a smoothed version of itself. By finding the value of rotational broadening that minimizes theχ2, we obtain an estimate of both vsiniand the
spec-tral type of the secondary star. Note that thevsinivalues of the template stars are much lower than the instrumental resolution, so do not affect our measurements of vsinifor the secondary star.
The value of vsini obtained using this method varies depending on the spectral type template, the wavelength region for optimal subtraction, the amount of smoothing of the residual spectrum in the calculation of χ2 and the
value of the limb–darkening coefficient used in the broaden-ing procedure. The values ofvsinifor all of the templates calculated using values for the limb–darkening coefficient of 0.5 and smoothed using a Gaussian of FWHM = 15km s−1,
are listed in Table 4.
A plot of χ2 versus vsinifor each spectral–type
tem-plate is shown in Fig. 9. The spectral type with the lowestχ2
value is M0.5V, which agrees with a visual identification of the best fitting template. Diaz & Hubeny (1999), however, estimate a secondary star spectral type between K0V and K5V, with the possibility of a later–type subgiant. A plot of the V347 Pup average spectrum, a broadened M0.5V tem-plate spectrum and the residual of the optimal subtraction is shown in Fig. 8. Theχ2for the M0.5V template has a
min-imum at 130 km s−1, so we adoptvsini= 130±5 km s−1,
with the error accounting for the measurement accuracy and the other variables noted in the previous paragraph. The er-ror quoted on our adopted value encompasses the measured
[image:11.612.308.543.53.232.2]vsinifor all of the templates used in the analysis (except for K3V withvsini= 136 km s−1).
[image:11.612.43.286.127.306.2]Figure 8. Orbitally–corrected average spectrum of V347 Pup (top) with the broadened M0.5V template (middle) and the resid-uals after optimal subtraction (bottom). The template spectrum has been multiplied by the scaling factor found from the opti-mal subtraction. All of the spectra are noropti-malised and offset on the plot by an arbitrary amount for clarity. The wavelength lim-its shown are those used for the cross–correlation and optimal subtraction procedures, except for the region between the dashed lines owing to few secondary star features.
Figure 9.Determination ofvsinifor V347 Pup using different spectral–type templates. Degrees of freedom = 699.
3.8 The KR correction
[image:11.612.318.530.350.612.2]of the secondary, the centre of light will be shifted towards the back of the star. The measured KR will then be larger than the true (dynamical) value.
Diaz & Hubeny (1999) found evidence for irradiation of the secondary star in V347 Pup, leading them to apply a correction to their measured KR value. This fact, and the presence of Balmer and HeI emission from the inner face of the secondary star seen in the Doppler maps and trailed spectra (Section 3.4), prompted us to look for similar irradi-ation effects in the absorption lines of our data. We applied the following two observational tests. First, the rotation-ally broadened line profile would be distorted if there was a non–uniform absorption distribution across the surface of the secondary star (Davey & Smith 1992). This would re-sult in a non–sinusoidal radial velocity curve. Second, one would expect a depletion of secondary star absorption–line flux at phase 0.5, where the quenched inner–hemisphere is pointed towards the observer (e.g. Friend et al. 1990).
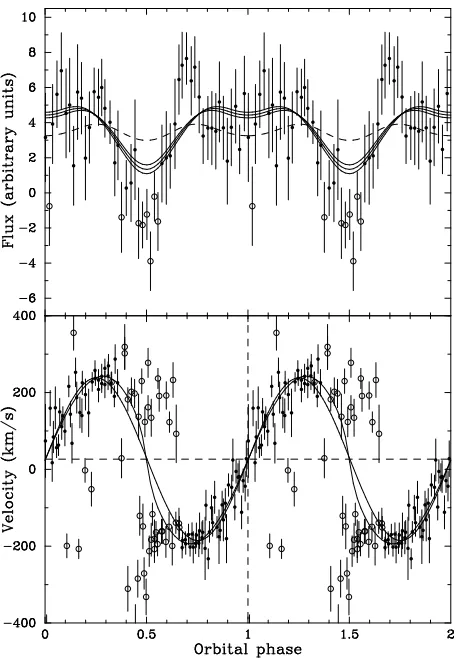
The secondary star radial velocity curves were pro-duced by cross–correlating the V347 Pup spectra with the best–fitting smeared and broadened template spectra, as described in Section 3.6. The cross–correlation peaks were plotted against phase to produce the radial velocity curves shown in the lower panel of Fig. 10. There is evidence for an eccentricity in the radial velocity curve compared with the sinusoidal fit represented by the thin solid line, although the data are noisy.
The variation of secondary star absorption–line flux with phase for V347 Pup is shown in the top panel of Fig. 10. These light curves were produced by optimally subtracting the smeared and rotationally broadened best– fitting template from the individual CV spectra (with the secondary radial velocity shifted out) as described in Sec-tion 3.7. This time, however, the spectra were continuum subtracted rather than normalised to ensure that the mea-surements were not affected by a fluctuating disc bright-ness. The constants produced by the optimal subtraction are secondary star absorption–line fluxes, correct relative to each other, but not in an absolute sense. The dashed lines super–imposed on the light curves represent the variation of flux with phase for a Roche lobe with a uniform absorp-tion distribuabsorp-tion. The sinusoidal nature is the result of the changing projected area of the Roche lobe through the or-bit. The V347 Pup light curve is clearly not represented by a uniform Roche lobe distribution as the secondary star absorption–line flux vanishes between phases 0.4–0.6.
These three pieces of evidence, as well as the disap-pearance of the CCFs between phases 0.4–0.6 seen in Fig. 7 suggest that the secondary star in V347 Pup is irradiated and we must correct theKR values accordingly.
It is possible to correct KR for the effects of irradia-tion by modelling the secondary star flux distribuirradia-tion. In our simple model, we divided the secondary Roche lobe into 40 vertical slices of equal width from the L1 point to
the back of the star. We then produced a series of model light curves (using the system parameters derived in Sec-tion 3.10), varying the numbers of slices omitted from the inner hemisphere of the secondary which contribute to the total flux. The model light curves were then scaled to match the observed data, and the best–fitting model found by mea-suring the χ2 between the two. In all models, we used a
gravity–darkening parameterβ= 0.08 and limb–darkening
coefficientu= 0.5 (e.g. Watson & Dhillon 2001). The neg-ative data points around phase 0.5 were set to zero, as the secondary star absorption line flux disappears at this point. Once the best–fitting light curve was found, we produced fake V347 Pup spectra from the model, which were cross-correlated with a fake template star to produce a synthetic radial velocity curve. In the first instance, the synthetic curve mimicked the non-sinusoidal nature of the observed data, but with a larger semi–amplitude. This was expected, as the model input parameters used the uncorrectedKR de-rived in Section 3.10. We then loweredKRand repeated the process, until the semi–amplitude of the model and observed radial velocity curves were in agreement, each time checking the light curve models for goodness of fit. The resultingKR was then adopted as the real (or dynamical)KR value.
The best–fitting model light curve was produced by omitting 12 slices when fitting the data (reducedχ2between
model and data = 1.03). The model light curves omitting 11, 12 and 13 slices are shown by the solid lines in Fig. 10. Our final model, which has an inputKRof 198 km s−1, produces the radial velocity curve shown as the thick solid line in the lower panel of Fig. 10. There is good agreement between this and the observed data. If gravity–darkening and limb– darkening are neglected, the best fit light curve remains the same, but produce aKR value which is∼6 km s−1 lower.
In summary, we correct theKRof V347 Pup from 216 km s−1 to 198 km s−1. This correction of 18 km s−1 is
ex-actly the same as that calculated by Diaz & Hubeny (1999) using a much simpler approximation, which changed their measured value of 205 km s−1 to 187 km s−1.
3.9 The distance to V347 Pup
By finding the apparent magnitude of the secondary star from its contribution to the total light of the system, and estimating its absolute magnitude, we can calculate the dis-tance (d) using the equation:
5 log(d/10) =mV −MV −d AV/1000 (4)
whereAV is the visual interstellar extinction in magnitudes per kpc.
The meanR–band photometric flux of V347 Pup during the recorded spectra is 8.93 mJy, which we convert to a mean
R–band magnitude of 13.8 ±0.3. The uncertainty reflects the change in brightness of the system between 25 and 27 Dec. During this time, the secondary star contributes 13± 2 per cent of the total light of the system, assuming an early M spectral type (see Table 4). The apparent magnitude of the secondary is thereforeR= 16.0±0.4, which we convert to aV–band magnitude of 17.3±0.4 using a typicalV −R
value for an early M star from Gray (1992). There are a number of ways of estimating the absolute magnitude of the secondary star, assuming it is on the main sequence (e.g. Patterson 1984; Warner 1995b; Gray 1992). We took each of these into account and adopt an average value ofMV = +8.8 ±0.5. Mauche et al. (1994) estimated the extinction to V347 Pup to be E(B−V) = 0.05, which results inAV = 0.16 (Scheffler 1982). The distance to V347 Pup is calculated from equation 4 to be 490±130 pc.
Figure 10. Upper panel: Secondary star absorption line light curve with model fits (solid lines). Model fits are shown for Roche lobes with 11, 12 and 13 slices removed (see text for details). The lower the line, the more slices removed. The dashed line represents a model where 0 slices have been removed. The data have been phase–binned into 50 bins to increase S/N. Lower panel: Measured secondary star radial velocity curve with a sinusoidal fit (thin solid line) and the best–fitting model fit (thick solid line). In both panels, the open circles indicate points that have been omitted from the fits and the data have been folded to show 2 orbital phases.
measured system inclination and out-of-eclipse magni-tude. Mauche et al. (1994) use their interstellar reddening measurement and a mean interstellar hydrogen number density to estimate a distance of 340–590 pc. Finally, Diaz & Hubeny (1999) find a distance of 510±160 pc from the spectral line depths of the secondary star. Our value is consistent with all distance estimates in the literature.
3.10 System parameters
Using theKRandvsinivalues found in Sections 3.7 and 3.8 in conjunction with the period determined in Section 3.1 and a measurement of the eclipse full–width at half depth (∆φ1/2), we can calculate accurate system parameters for
V347 Pup.
In order to determine ∆φ1/2, we estimated the flux out
of eclipse (the principal source of error) and at eclipse mini-mum, and then measured the full–width of the eclipse way between these points. The eclipse full–width at
half-depth was measured to be ∆φ1/2 = 0.115±0.005, in
agree-ment with the eclipse half–width at half–depth of 0.052 ± 0.002 measured by Buckley et al. (1990) at the 2σlevel.
We have opted for a Monte Carlo approach similar to Horne, Welsh & Wade (1993) to calculate the system pa-rameters and their errors. For a given set of KR, vsini, ∆φ1/2 and P, the other system parameters are calculated
as follows.
R2/a can be estimated because we know that the
sec-ondary star fills its Roche lobe (as there is an accretion disc present and hence mass transfer).R2is the equatorial radius
of the secondary star andais the binary separation. We used Eggleton’s formula (Eggleton 1983) which gives the volume-equivalent radius of the Roche lobe to better than 1 per cent, which is close to the equatorial radius of the secondary star as seen during eclipse,
R2 a =
0.49q2/3
0.6q2/3+ ln (1 +q1/3). (5)
The secondary star rotates synchronously with the orbital motion, so we can combineKR andvsini, to get
R2
a (1 +q) = vsini
KR
. (6)
By considering the geometry of a point eclipse by a spherical body (e.g. Dhillon, Marsh & Jones 1991), the radius of the secondary can be shown to be
R2 a
2
= sin2π∆φ
1/2+ cos2π∆φ1/2cos2i, (7)
which, using the value ofR2/aobtained using equations 5
and 6, allows us to calculate the inclination,i, of the system. The geometry of a disc eclipse can be approximated to a point eclipse if the light distribution around the white dwarf is axi–symmetric (e.g. Dhillon 1990). This approximation is justified given the symmetry of the primary eclipses in the photometry light curves (Fig. 2). Kepler’s Third Law gives us
K3
RPorb 2πG =
M1sin3i
(1 +q)2 , (8)
which, with the values ofqandicalculated using equations 5, 6 and 7, gives the mass of the primary star. The mass of the secondary star can then be obtained using
M2=qM1. (9)
The radius of the secondary star is obtained from the equa-tion
vsini R2
=2πsini
P , (10)
(e.g. Warner 1995a) and the separation of the components,
a, is calculated from equations 6 and 10 withqandinow known.
The Monte Carlo simulation takes 10 000 values ofKR,
vsini, and ∆φ1/2 (the error on the period is deemed to be
negligible in comparison to the errors on KR, vsini, and ∆φ1/2), treating each as being normally distributed about
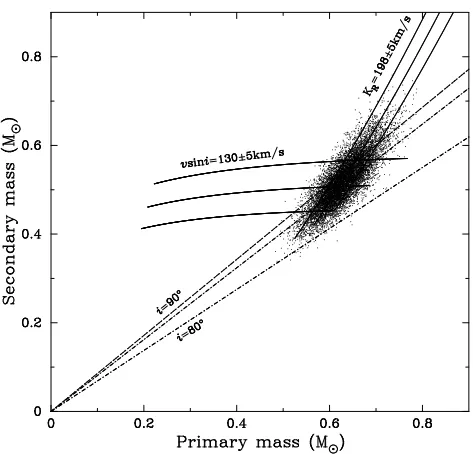
Figure 11.Monte Carlo determination of system parameters for V347 Pup. Each dot represents anM1, M2 pair; the solid curves
satisfy thevsiniandKRconstraints, and the dashed lines mark lines of constant inclinations (i= 80◦, 85◦and 90◦).
outlined above, omitting (KR,vsini, ∆φ1/2) triplets which
are inconsistent with sini≤1. Each accepted M1, M2 pair
is then plotted as a point in Figure 11, and the masses and their errors are computed from the mean and standard de-viation of the distribution of these pairs.
We find the component masses of V347 Pup to be
M1= 0.63±0.04M⊙ andM2= 0.52±0.06M⊙. The values
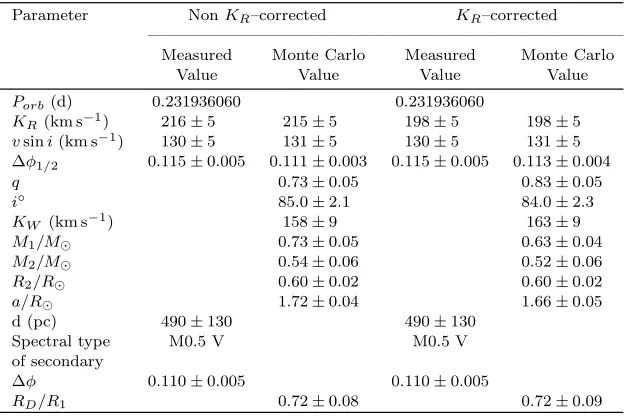
of all the system parameters deduced from the Monte Carlo computation are listed in Table 5, including KR–corrected and nonKR–corrected values for comparison. Note that our derivedKW of 163±9 km s−1 is in remarkable agreement with theKW values of Still, Buckley & Garlick (1998) who measure 156 ±10 km s−1 using a double–Gaussian
convo-lution of the Balmer lines, and 166 km s−1 as the centre
of axisymmetric Balmer emission. The white dwarf mass of 0.63 ± 0.04M⊙ is consistent with the average value of
M1 = 0.80±0.22M⊙ (for CVs above the period gap)
de-termined by Smith & Dhillon (1998). The empirical relation obtained by Smith & Dhillon (1998) between mass and ra-dius for the secondary stars in CVs predicts that if the sec-ondary star in V347 Pup is on the main-sequence, it should have a radius of 0.54±0.08R⊙. Our measured value of 0.60 ±0.02 R⊙(from equation 10) is consistent with this value.
4 DISCUSSION
4.1 Spiral arms
Spiral-armed disc asymmetries are evident in the HeI and Hβ Doppler maps, confirming the find-ings of Still, Buckley & Garlick (1998) in their Hβ
and Hγ maps. Similar spiral structures have been observed in dwarf novae during outburst (e.g. IP Peg, Steeghs, Harlaftis & Horne 1997; U Gem, Groot, Rutten & van Paradijs 2001). Tidally driven
spiral density waves can develop in accretion discs due to the tidal torque of the mass donor star on the outer disc (Sawada, Matsuda & Hachisu 1986, Blondin 2000, Boffin 2001). Their detection in outburst only reflects the much stronger tidal effects on the accretion disc when it increases in size and temperature during out-burst, in which case a tidally induced spiral structure is expected that closely matches the observed struc-tures (Armitage & Murray 1998, Steeghs & Stehle 1999, Steeghs 2001). In dwarf novae, these asymmetries decay as the system returns to quiescence, and the disc cools and shrinks. In order for a similar tidal response to be responsible for the disc asymmetry in V347 Pup, its disc must be large and comparable to the tidal radius. We calculate the tidal radius of the accretion disc to be 0.33a
using the pressureless disc models of Paczy´nski (1977) and our new system parameters. The measured disc radius of
RD/a = 0.28 ± 0.03 is comparable in size to the tidal radius, and therefore consistent with a tidal origin for the observed spiral structure.
Our observations show that the spiral structures are clearly visible in the HeI Doppler maps, but are either weak or non-existent in the Balmer and HeII maps. This is in contrast to dwarf novae in outburst, which typically show stronger spiral structures in the HeII and Balmer lines (e.g. Marsh 2001; Morales-Rueda 2004). This could be a reflec-tion of different densities and temperatures in NL discs com-pared to the discs of dwarf novae in outburst, or it could simply be due to a contrast effect where the relative contri-bution of the spiral structure is not as high in the HeII and Balmer maps due to the presence of low–velocity emission.
Note that the impact of such tidally–induced spi-ral arms on the angular momentum transport has not been fully established. If they are associated with hy-drodynamical shocks, such as in the simulations of Sawada, Matsuda & Hachisu (1986), their contribution to the angular momentum transport could be very significant. On the other hand, Smak (2001) and Ogilvie (2002) propose that these disc structures may reflect tidally thickened ar-eas in the outer disc as it expands close to its tidal radius. Their enhanced emission is then caused by irradiation from the accreting white dwarf and regions close to it.
The prospect of testing such basic disc physics with observations warrants the study of these disc structures in more detail (see also Morales-Rueda 2004). With V347 Pup, we have a target that appears to have a persistent disc asym-metry that is more accessible than the transient spiral struc-ture observed in dwarf novae.
4.2 Mass transfer stability
The mass ratio of a CV is of great significance, as it governs the properties of mass transfer from the secondary to the white dwarf primary. This in turn governs the evolution and behaviour of the system.
The secondary star responds to mass loss on two timescales. First, the star returns to hydrostatic equilibrium on the dynamical timescale, which is the sound–crossing time of the region affected. Second, the star settles into a new thermal equilibrium configuration on a thermal timescale.
Table 5.System parameters for V347 Pup. The Monte Carlo results for corrected and uncorrectedKRvalues are shown for comparison. The radial velocity of the white dwarf (KW) has also been calculated from the secondary star parameters.
Parameter NonKR–corrected KR–corrected ————————————————————————————
Measured Monte Carlo Measured Monte Carlo
Value Value Value Value
Porb(d) 0.231936060 0.231936060
KR(km s−1) 216±5 215±5 198±5 198±5
vsini(km s−1) 130±5 131±5 130±5 131±5
∆φ1/2 0.115±0.005 0.111±0.003 0.115±0.005 0.113±0.004
q 0.73±0.05 0.83±0.05
i◦ 85.0±2.1 84.0±2.3
KW (km s−1) 158±9 163±9
M1/M⊙ 0.73±0.05 0.63±0.04
M2/M⊙ 0.54±0.06 0.52±0.06
R2/R⊙ 0.60±0.02 0.60±0.02
a/R⊙ 1.72±0.04 1.66±0.05
d (pc) 490±130 490±130
Spectral type M0.5 V M0.5 V
of secondary
∆φ 0.110±0.005 0.110±0.005
RD/R1 0.72±0.08 0.72±0.09
If, upon mass loss, the dynamical response of the secondary is to expand relative to the Roche lobe, mass transfer is dynamically unstable and mass transfer proceeds on the dy-namical timescale. Politano (1996) made an analytic fit to the models of Hjellming (1989) to give the limit of dynam-ically stable mass loss, plotted as the solid line in Fig. 12. Dynamically stable mass transfer can occur if the CV lies be-low this line. This limit is important for be-low mass secondary stars (M2 < 0.5M⊙), as they have significant convective
envelopes that tend to expand adiabatically in response to mass loss (de Kool 1992).
Thermally unstable mass transfer is possible if the dy-namic response of the star to mass loss is to shrink rela-tive to its Roche lobe (i.e. mass transfer isdynamically sta-ble). This occurs at high donor masses (M2>0.8M⊙) when
the star has a negligible convective envelope and its adia-batic response to mass loss is to shrink. (e.g. de Kool 1992; Politano 1996). Mass transfer then initially breaks contact and the star begins to settle into its new thermal equilibrium configuration. If the stars thermal equilibrium radius is now bigger than the Roche lobe, mass transfer is again unstable, but proceeds on the slower, thermal timescale. The limit of thermally–stable mass transfer can be found by differenti-ating the main–sequence mass–radius relationship given in Politano (1996). Thermally–stable mass transfer can occur if the CV appears below the dotted line plotted in Fig. 12.
The limit for dynamically stable mass transfer is im-portant in the case of V347 Pup owing to the low secondary star mass. Fig. 12 shows that the system is just consistent with the limit at the 1σ level. The mass transfer stabil-ity limits, however, are true only for ZAMS stars, whereas the secondary stars in CVs are expected to have undergone some evolution. The loss of the outer envelope, for example, would result in a larger than normal helium to hydrogen ra-tio and affect the star’s response to mass loss. For instance, DX And, which lies outside the limit, has been shown to have an evolved companion (Drew, Jones & Woods 1993).
There is tentative evidence that the secondary star in V347 Pup is evolved by considering three pieces of ev-idence. First, V347 Pup falls outside the limit for dy-namically stable mass transfer (although agrees at the 1σ level). Second, the measured radius is at the upper limit for a main–sequence companion of the same mass (Smith & Dhillon 1998). Third, the secondary star mass and spectral type measured for V347 Pup are closer to the evolved models of Kolb, King & Baraffe (2001) than the ZAMS models.
5 CONCLUSIONS
(i) We have measured the radial and rotational velocities of the secondary star in V347 Pup in order to calculate the component masses and other system parameters. The sec-ondary star radial velocity is affected by irradiation from the emission regions around the primary, which we correct for using a model. We find the component masses in V347 Pup to be M1 = 0.63 ±0.04 M⊙ for the white dwarf primary
andM2 = 0.52 ±0.06 M⊙ for the M0.5V secondary star.
V347 Pup shows many of the characteristics of the SW Sex stars, exhibiting single–peaked emission lines, high–velocity S–wave components and phase–offsets in the radial velocity curves.
(ii) V347 Pup lies outside the theoretical limit for dynam-ically stable mass transfer in ZAMS stars, but is just con-sistent at the 1σ uncertainty level. This piece of evidence, together with a secondary star radius at the upper limit for a main–sequence companion of the same mass, suggests that the secondary star in V347 Pup may be evolved. Addi-tionally, the secondary star mass and spectral type mea-sured for V347 Pup are closer to the evolved models of Kolb, King & Baraffe (2001) than the ZAMS models.
con-Figure 12. Critical mass ratios for mass transfer stability. The dotted line represents the condition for thermal instabil-ity; the solid line represents the condition for dynamical insta-bility (Politano 1996). Both curves assume the star is initially in thermal equilibrium. Mass ratios and secondary masses from the compilation of Smith & Dhillon (1998), North et al. (2000), Watson et al. (2003), and Thoroughgood et al. (2004) are over-plotted. The mass ratios and secondary star masses of V347 Pup determined in this paper are also plotted.
firmed. Consistent with this, we find that the measured ac-cretion disc radius is close to the tidal radius computed from the pressureless disc models of Paczy´nski (1977). The per-sistent spiral arms seen in this bright novalike makes it an excellent candidate in which to study these features, rather than the transient spiral structures observed in dwarf novae.
ACKNOWLEDGEMENTS
TDT is supported by a PPARC studentship; CAW is sup-ported by PPARC grant number PPA/G/S/2000/00598; SPL is supported by PPARC. DS acknowledges a Smith-sonian Astrophysical Observatory Clay Fellowship.
REFERENCES
Armitage P. J., Murray J. R., 1998, MNRAS, 297, L81 Baptista R., Cieslinski D., 1991, IAU Circ., 5407 Blondin J. M., 2000, New Astronomy, 5, 53
Boffin H. M. J., 2001, in Boffin H., Steeghs D., Cuypers J., eds, Proceedings of the International Workshop on
Astro-tomography, Brussels, July 2000. Springer-Verlag Lecture Notes in Physics, Dusseldorf, p. 69
Buckley D. A. H., Sullivan D. J., Remillard R. A., Tuohy I. R., Clark M., 1990, ApJ, 355, 617
Davey S. C., Smith R. C., 1992, MNRAS, 257, 476 de Kool M., 1992, AA, 261, 188
Dhillon V. S., Jones D. H. P., Marsh T. R., 1994, MNRAS, 266, 859
Dhillon V. S., Marsh T. R., Jones D. H. P., 1991, MNRAS, 252, 342
Dhillon V. S., Marsh T. R., Jones D. H. P., 1997, MNRAS, 291, 694
Dhillon V. S., Marsh T. R., Jones D. H. P., Smith R. C., 1992, MNRAS, 258, 225
Dhillon V. S., 1990, D. Phil thesis, University of Sussex Diaz M. P., Hubeny I., 1999, ApJ, 523, 786
Drew J. E., Jones D. H. P., Woods J. A., 1993, MNRAS, 260, 803
Eggleton P. P., 1983, ApJ, 268, 368
Friend M. T., Martin J. S., Smith R. C., Jones D. H. P., 1990, MNRAS, 246, 637
Gray D. F., 1992, The Observation and Analysis of Stellar Photospheres. Cambridge University Press, Cambridge Groot P. J., Rutten R. G. M., van Paradijs J., 2001, AA, 368,
183
Harrop-Allin M. K., Warner B., 1996, MNRAS, 279, 219 Hjellming M. S., 1989, PhD thesis, University of Illinois Honeycutt R. K., 2001, PASP, 113, 473
Horne K., Marsh T. R., 1986, MNRAS, 218, 761
Horne K., Welsh W. F., Wade R. A., 1993, ApJ, 410, 357 Knigge C., Long K. S., Hoard D. W., Szkody P., Dhillon V. S.,
2000, ApJ, 539, L49
Kolb U., King A. R., Baraffe I., 2001, MNRAS, 321, 544 Marsh T. R., Horne K., 1988, MNRAS, 235, 269 Marsh T. R., 1988, MNRAS, 231, 1117
Marsh T. R., 2001, in Boffin H., Steeghs D., Cuypers J., eds, Proceedings of the International Workshop on
Astro-tomography, Brussels, July 2000. Springer-Verlag Lecture Notes in Physics, Dusseldorf, p. 1
Mason E., Howell S. B., 2003, AA, 403, 699
Mauche C. W., Raymond J. C., Buckley D. A. H., Mouchet M., Bonnell J., Sullivan D. J., Bonnet-Bidaud J., Bunk W. H., 1994, ApJ, 424, 347
Morales-Rueda L., 2004, Astron. Nach., 325, 193 North R. C., Marsh T. R., Moran C. K. J., Kolb U.,
Smith R. C., Stehle R., 2000, MNRAS, 313, 383 Ogilvie G. I., 2002, MNRAS, 330, 937
Paczy´nski B., 1977, ApJ, 216, 822 Patterson J., 1984, ApJS, 54, 443 Politano M., 1996, ApJ, 465, 338
Rappaport S., Verbunt F., Joss P. C., 1983, ApJ, 275, 713 Sawada K., Matsuda T., Hachisu I., 1986, MNRAS, 219, 75 Scheffler H. in Schaifers K., Voigt H. H., eds, Landolt–B¨ornstein
Numerical Data and Functional Relationships in Science and Technology, New Series, Group VI, Vol. 2, Subvol. c, p. 47, Springer Verlag, Heidelberg, 1982
Schneider D. P., Young P. J., 1980, ApJ, 238, 946
Shafter A. W., Hessman F. V., Zhang E. H., 1988, ApJ, 327, 248 Shafter A. W., Szkody P., Thorstensen J. R., 1986, ApJ, 308,
765
Shlosman I., Vitello P., Mauche C. W., 1996, ApJ, 461, 377 Skilling J., Bryan R. K., 1984, MNRAS, 211, 111
Smak J. I., 2001, Acta Astron., 51, 295
Smith D. A., Dhillon V. S., 1998, MNRAS, 301, 767
Smith D. A., Dhillon V. S., Marsh T. R., 1998, MNRAS, 296, 465
Spruit H. C., Ritter H., 1983, AA, 124, 267 Steeghs D., Stehle R., 1999, MNRAS, 307, 99
Steeghs D., Harlaftis E. T., Horne K., 1997, MNRAS, 290, 28L Steeghs D., 2001, in Boffin H., Steeghs D., Cuypers J., eds,
Proceedings of the International Workshop on
Astro-tomography, Brussels, July 2000. Springer-Verlag Lecture Notes in Physics, Dusseldorf, p. 45
Steeghs D., 2003, MNRAS, 344, 448
[image:16.612.49.276.54.296.2]Still M. D., Dhillon V. S., Jones D. H. P., 1995, MNRAS, 273, 863
Thoroughgood T. D., Dhillon V. S., Littlefair S. P., Marsh T. R., Smith D. A., 2001, MNRAS, 327, 1323 Thoroughgood T. D., Dhillon V. S., Watson C. A., Buckley D.
A. H., Steeghs D., Stevenson M. J., 2004, MNRAS, 353, 1135 Vande Putte D., Smith R. C., Hawkins N. A., Martin J. S.,
2003, MNRAS, 342, 151
Wade R. A., Horne K., 1988, ApJ, 324, 411
Warner B., 1995a, Cataclysmic Variable Stars. Cambridge University Press, Cambridge
Warner B., 1995b, Ap&SS, 232, 89
Watson C. A., Dhillon V. S., 2001, MNRAS, 326, 67