Preface & Acknowledgements
This thesis is part of my final project in my Computer Science master (Software Technology specialization) at the University of Twente.
Abstract
In this thesis we introduce iFat: an Interface for Fault/Attack Trees. iFat is our solution for the shortage of user friendly interfaces for academic Fault Tree analysis and Attack Tree analysis. iFat is a web based GUI for the creation of Fault and Attack Trees, and can produce input files for a large number of analysis tools through model transformations. We will present and justify our design, and propose a test to determine the user friendliness compared to existing products like DFTCalc and ADTool. We have successfully implemented most of the desired functionality, and the resulting product can be found at http://ctit-vm1.ewi.utwente.nl/FT_analysis/.
Keywords:
Table of Contents
1. Introduction...9
1.1. Thesis organization...9
2. Related Work...11
2.1. Fault Trees...11
2.1.1. Static Fault Tree...11
2.1.2. Dynamic Fault Tree...12
2.1.3. Repairable Fault Tree...12
2.1.4. Attack Trees...12
2.2. Metamodel...13
2.2.1. Structure...14
2.2.2. Values...15
3. Requirements...17
3.1. Core requirements...17
3.2. Usability requirements...17
3.3. Fault Tree Feature requirements...18
3.4. Tool support and interoperability requirements...18
3.5. Query support requirements...19
4. Design Choices 1: Graph Drawing Frameworks...21
4.1. Overview...21
4.1.1. Web based...22
4.1.2. Locally embeddable...23
4.1.3. Miscelaneous...24 4.2. Highlights...25 4.2.1. CINCO...25 4.2.2. Cytoscape.js...25 4.2.3. yFiles...26 4.2.4. Conclusion...26
5. Design Choices 2: Client-Server Balance...27
5.1. Option 1: both on the client...27
5.2. Option 2: both on the server...28
5.3. Option 3: hybrid solution...29
5.4. Conclusion...29
6. Design Context...31
6.1. Target operating environment...31
6.1.1. Client...31
6.1.2. Server...31
6.1.3. PHP + Java Servlets...32
6.2. Project setup...33
6.3. Project hosting...34
7. Interface Design...35
7.1. Core interface elements...36
7.2. Tree Type menu...37
8. Data flow design...39
8.1. Server...39
8.2. Client...40
9. Validation Plan...41
9.1. Expert testing...41
9.2. User testing...41
9.2.1. Test subject selection...41
10. Expert Testing feedback and resulting changes...43
11. Conclusion...47
11.1. Satisfaction of requirements...47
12. Discussion & Future work...49
12.1. Built a working product...49
12.2. Failed to integrate DFTCalc...49
12.3. Failed to complete user tests...49
12.4. Future updates to metamodel...50
12.5. Future additions to the interface...50
13. Reflection...51
13.1. Design science...51
13.2. Lessons learned...52
14. Bibliography...55
Appendix A Framework suitability table...58
Appendix B User interface (large)...61
Appendix C User Test Survey...62
1. Introduction
Fault Trees1 (FT) are a method for analyzing system reliability. They work by modeling
the impact of subcomponents on the reliability of a complete system. For example: they can predict the likelihood of a car breaking down within five years (and the likelihood of that being caused by the gearbox), based on the components that make up the car. This information can be used to make more reliable cars; as well as inspire business decisions like how much warranty to give on a new product. A more elaborate explanation of what FTs are - and the different kinds of FTs - can be found in the Related Work chapter (section 2.1).
While FTs are popular in industry, we feel that adoption in academia is held back by a lack of accessible tools. The tools in use by industry are typically closed source commercial packages with user friendly interfaces (the interface is what sells the tool), whose inner workings are closely guarded secrets. Academic tools tend to be more open about their inner workings (that is what goes into the paper) but less user friendly: often lacking a Graphical User Interface (GUI) and expecting the FTs to be provided in a textual format. This raises the question: is the lack of accessibility in academic tools a problem? We belief so because a tool that is hard to use for third parties, is also hard to test for third parties; and independent validation is the basis of science. Furthermore user friendly tools are easier to use as teaching aids, helping to improve education. To address the lack of accessibility in academic tools, we have designed an interface for FT analysis (iFat). This interface is installation-free and should be easy to use. The interface offers support for the whole cycle of FT analysis: the creation and editing of FTs, running queries on those FTs and displaying the result of those queries. And the interface integrates with existing academic tools for FT analysis. For the integration with existing tools we use a preexisting FT metamodel[1] by the University of Twente’s Formal Methods and Tools (FMT) group.
The main contribution of this work is iFat. The interface does almost everything that we wanted it to do, and it does what it does well enough that we feel it is ready for actual users; iFat has always been designed with real users2 in mind. We also describe a
first round of user tests, meant to improve the interface; and we propose a second round of testing, meant to give a quantitative comparison of the usability of iFat and several competing products. An unexpected lesson we learned is that the choice of what web server software you use, can have a large impact on the performance of the final product.
1.1. Thesis organization
The remainder of this thesis is organized as follows. Chapter 2 deals with related work. Chapter 3 details the requirements we have laid out for our solution. Chapters 4 and 5 motivate some of the choices we made during the design process: chapter 4 motivates our choice of using the Cytoscape.js graph drawing framework; while chapter 5 details the balance of responsibilities between the client and the server, and motivates our
project decision to add Java Servlets to our technology stack. Chapter 6 deals with the project setup and the context in which we made our design. Chapter 7 focuses on the final GUI design that we came up with. Chapter 8 explains how the various internal components communicate with eachother. Chapter 9 lays out our two stage validation plan, of which only the first stage was completed. Chapter 10 is devoted to the results of that stage, while the reasons for not completing the second stage are detailed in the discussion chapter (chapter 12, section 12.3). Chapter 11 deals with conclusions on our design. Chapter 12 is devoted to discussion on the current work, and recommendations for future work, while chapter 13 is devoted to reflection on design science in computer science and lessons learned. Chapter 14 is the bibliography.
2. Related Work
This work is based on several[2][3][4][5][6] papers related to Fault Trees, including one related to a metamodel for transforming Fault Trees[1] as well as some unpublished documents related to Fault Trees. It is also based on several[7][8] papers related to design science. This chapter will start with a description of what Fault Trees are, and the different types of FT (section 2.1). Then we will introduce the metamodel (section 2.2).
2.1. Fault Trees
We will start this section with a general introduction to Fault Trees, followed by subsections devoted to introducing different types of FT. We do this because there is no universal definition of a Fault Tree; and doing this will let us create a functional working definition of an FT that covers most of the types of FT in practice.
Fault Trees3 are a way of modeling system reliability by
representing the system as a graph where vertices's represent either components that can fail, or gates that model how aggregations of components fail. An example of a FT can be seen in Illustration 1, taken from Junges et al.[4], which models a simple abstraction of a computer. The computer has one processor P, and two memory units M1 and M2; these
are modeled by the leaves of the tree. The computer fails if either the processor or both memory units fail; this is modeled by an OR-gate ( ) as the root of the tree representing system failure, and an AND-gate ( ) representing dual memory failure between the memory units and the root. Failures are propagated up along the edges, with an AND-gate failing if all its children fail, while an OR-gate fails if any of its children fails. Which kinds of
gates are available depends on what definition of Fault Trees is being used; for this project we will try to bring together four different types of FT: Static FT, Dynamic FT, Repairable FT and Attack Tree. The set of gates that we will support is based on this, but formally defined in the design requirements chapter (section 3.3).
2.1.1. Static Fault Tree
Static Fault Trees (SFT) are the most simple form of FT. Basic Events (BE, leaves in the example) fail with fixed probabilities. Gates in an SFT fail solely based on the number inputs that have failed: a gate with n inputs has failed iff k or more inputs have failed. The general case of this is called a voting gate, OR and AND gates are two special cases of this (k=1, k=n respectively). A key characteristic of SFTs is that for any set S of failed BEs, it is possible to determine whether the system has failed, and if S
3 Despite the name containing the word tree, Fault Trees may typically also be Directed Acyclic
Illustration 1: Fault Tree of a computer with 1 processor and 2 memory
implies failure of a system, then any superset of S also implies failure of that system. If S implies failure and there are no strict subsets of S that imply failure, then S is a Minimal Cut Set (MCS), formally: MCS(S):=FAIL(S)∧¬∃S '⋅S '⊂S∧FAIL(S ')
where FAIL(S) denotes a system failure under S.
2.1.2. Dynamic Fault Tree
Dynamic Fault Trees (DFT) are an extension of Fault Trees that looks at sequences of BE failures, rather than at sets. One example of where this may be relevant is a situation where there is a primary system A, a backup system B, and a switch C that turns on B when A fails: If C fails first, and then A fails, B is never turned on so the system fails; if A fails first, and then C fails, B keeps the system from failing. To model this DFT introduces the Priority-AND-gate (PAND) which fails iff all its inputs fail in a specific order, and the Priority-OR-gate (POR) which fails iff its first input fails before any other input fails. DFT also has Sequence Enforcers (SEQ) that can enforce that B may not fail before A; and spare gates that can reduce the likelihood of B failing if A hasn’t failed yet. The last feature DFT adds is the ability for failures to trigger other BEs to fail with a given probability, this is called a Probabilistic dependency (PDEP), or Functional dependency (FDEP) if the probability is 1. One scenario where this may be used is to model a surge protector: if a power spike manages to overload the surge protector, then it will probably destroy any equipment protected by that surge protector; but this equipment may also fail independently of the surge protector.
2.1.3. Repairable Fault Tree
Repairable Fault Trees are Fault Trees that allow for failed components to eventually get replaced or repaired. The current FT metamodel does not actually support repairable FTs yet, but an extension that does is being worked on.
2.1.4. Attack Trees
Attack Trees is the application of Fault Tree principles to security analysis. Instead of computing how likely a system is to fail under normal use, Attack Trees are used to compute how difficult it is to cause a system to fail deliberately. In this case the BEs are vectors of attack, like phishing, and the gates model how these may be combined to compromise a system. These attack vectors have costs associated with them: time, labor, computing power, etc; and tools can then find the cheapest way to compromise a system.
As an example, let X be a company that has sensitive information about its customers. Then an attacker has several avenues of attack to obtain access to that information: phising X’s customers, phising X’s employees, actually getting a job at X (under a fake identity), etc. These avenues of attack, as well as possible countermeasures, can be modeled in an Attack Tree. X can then use this Attack Tree to decide which countermeasures are worth investing in.
2.2. Metamodel
This section introduces the Unified Attack Fault Tree MetaModel[1] (the metamodel). We start with a short segment on the metamodel organization and how to read the metamodel diagrams. Then we describe the two parts of the metamodel in subsections (2.2.1 and 2.2.2).
In metamodeling terminology, a Fault Tree is a model of a system (in this case the model describes the failure behaviour of that system). Models have a format that they are written in, tools typically only support a limited number of formats. Model transformations are algorithms that can transform a model in a specific input format to an equivalent model (or approximation thereof) in a specific output format. A metamodel is a model that describes other models (in this case the metamodel describes Fault Trees). Metamodels serve to provide intermediate formats for model transformations: a first model transformation transforms the model from the input format to an instance of the metamodel, and a second model transformation transforms it to the desired output format. The advantage of using a metamodel is that, if a new format is introduced, only two transformations need to be written (one to and one from the metamodel) to allow transformations to and from all formats that already have such transformations.
The metamodel is organized as an Eclipse Modeling Framework[9] (EMF) project. This project includes several metamodel files (*.ecore) to describe Fault/Attack Tree models, as well as transformations to convert these models to/from a number of formats.
2.2.1. Structure
This section describes the structure part of the metamodel. The diagram for this part can be found in Illustration 2.
The root of the structure is the AttackTree (found in the bottom right of the diagram) it contains the Nodes and Edges of the tree, has a pointer to the root node, and may optionally contain arbitrary metadata.
Edges are effectively defined twice in the metamodel: there is the explicit Edge object, and there is the parent/child relation between nodes. The Edge object is a later addition to the metamodel to allow more complicated relationships between nodes, and may eventually replace the parent/child relation; but currently the older parent/child relation is still used by various model transformations. The explicit Edge object uses an enumeration (EdgeKind, currently DEPENDENCY or TRIGGER) to denote the relation of the Edge.
Nodes have the most properties of any object in the metamodel. Besides the previously mentioned parent/child relationships, they have an id to identify them, a label for longer textual descriptions of the node, a Nature which tells wether it counts as an AT node or an FT node (or both), a RoleType which can be used to mark a node as a countermeasure against attack, and -if the node isn’t a Basic Event- a Connector to define the node type. Connector is extended by many classes representing the concrete node types, this allows concrete implementations to have their own properties.
2.2.2. Values
This section describes the values part of the metamodel. The diagram for this part can be found in Illustration 3. The values part of the metamodel serves to enrich the structure part with node attributes, for example the likelihood that a basic event will fail in a given time period. The reason that the values part is in a separate metamodel, is so that you can have multiple versions of the same data domain for a single tree. For example, for the tree from Illustration 1, one could have a failure rate domain for cheaper but less reliable memory, and a second failure rate domain with more expensive and more reliable memory, with the same tree model.
The root of the values is the Domain, this class serves as a container for the individual Attributes, and defines the nature of those attributes. Domain has a Type, which determines the type of the Value. Domain also has a Purpose, which is intended to convey the meaning of the Domain without relying on the domain name, but in practice the name is used to identify the Domains in transformations.
3. Requirements
This chapter lists the design requirements that we have set for our solution. The requirements have been grouped into several sections based on the type of requirement: Core requirements, Usability requirements, Fault Tree Feature requirements, Tool support and interoperability requirements, and Query support requirements. All requirements have a name and number. Requirements have a description, except the Fault Tree Feature and Tools support requirements, where we felt descriptions would be self evident. Requirements may be dependent on other requirements, in which case we do not believe that the requirement can reasonably be met unless the dependency is first satisfied.
3.1. Core requirements
Core requirements are the fundamental requirements that a solution should meet. They are typically so obvious, that writing them down as explicit requirements is sometimes forgotten.
Requirement name Description Dependent on
I. Creating of Fault/Attack
Trees Our solution must allow end users to create Fault Trees and Attack Trees.
3.2. Usability requirements
As the problem is one of accessibility, usability is one of the most important aspects of our solution. At a minimum our solution should feature the following elements.
Requirement name Description Dependent on
II. Graphical interface Command line tools are intimidating to many of the less-technically inclined, at a minimum we should provide a graphical interface.
III. Integrated tool-chain For ease of use it is
undesirable if users have to manually switch between tools for editing and
analysis. Instead, we should integrate a complete
tool-chain into our solution. IV. Clear and intuitive
result visualization Our solution should present analysis results in a way that is clear even to non experts.
3.3. Fault Tree Feature requirements
As a tool for Fault Tree Analysis, the solution needs to support some definition of Fault Tree. As there is no universal definition of Fault Trees, we have selected the following set of FT features to support based on Junges et al.[4]. The features are further grouped based on the types of FT described in the Related Work section (2.1), with the addition of Core Features for features that are shared between Fault Trees and Attack Trees. For this section we distinguish between node types that may be part of a tree, and properties that those nodes may have. For a description of the FT types we refer to section 2.1.
Requirement name Node types Properties Dependent on
V. Core Features Basic Event (BE) AND-gate (AND) OR-gate (OR)
VI. Static FT Voting-gate (VOT) Failure rate Voting threshold
Requirement V (Core Features) VII. Dynamic FT Priority-AND-gate
(PAND) Priority-OR-gate (POR) Spare parts (SPARE) Functional dependency (FDEP) Probabilistic dependency (PDEP) Sequence enforcer (SEQ) Dormancy factor PDEP probability Requirement VI (Static FT)
VIII. Repairable FT Repair rate Requirement VII
(Dynamic FT)
IX. Attack tree Attack cost Requirement V
(Core Features)
3.4. Tool support and interoperability requirements
The problem to be solved is one of accessibility: there are existing tools for fault tree analysis, they are simply not user friendly enough. We seek to leverage those tools not just as a way to limit the scope of this project, but also as a way to facilitate comparisons of the underlying tools.
Requirement name Dependent on
X. Support existing metamodel
XI. Support DFTCalc Requirement X (Support existing metamodel) and requirement VI (Static FT)
XII. Support ADTool Requirement X (Support existing metamodel) and requirement IX (Attack tree)
3.5. Query support requirements
As a tool for Fault Tree Analysis, the solution needs to support some set of queries to run on those FT's. We have selected the following queries to support.
Requirement name Description Dependent on
XIII. Mean Time To Failure Average time it takes for a system to fail for the first time.
Requirement XI (Support DFTCalc)
XIV. Mean Time Between
Failures Average time it takes for a system to fail after it has been repaired.
Requirement XI (Support DFTCalc) and Requirement VIII (Repairable FT)
XV. Reliability Chance that a system will work correctly for a certain duration.
Requirement XI (Support DFTCalc)
XVI. Availability Long term average percentage of time that a system works correctly.
Requirement XI (Support DFTCalc) and Requirement VIII (Repairable FT)
XVII. Minimal Cut Sets Minimal sets of BE failures needed to obtain system failure.
Requirement XI (Support DFTCalc) or Requirement XII (Support ADTool) XVIII. Minimal cost to
induce system failure
The minimal cost for an attacker to cause a system failure.
4. Design Choices 1: Graph Drawing
Frameworks
In our design we made many choices, some of which are worth elaborating on. The first of those choices is the choice of a graph drawing framework. Because we wish to allow our users to graphically create FTs (which are graphs), we need some way to draw graphs interactively. Developing this part ourselves would take a prohibitively long time, thus we need to use a preexisting solution. We started with a list of 21 candidates which we briefly examined to assess their likely suitability. Based on that initial assessment we picked three frameworks for closer examination, which led to our final choice. Section 4.1 provides an overview of the examined software, with a brief description and a condensed scoring for each framework, the full scoring can be found in Appendix A. Section 4.2 compares the frameworks that we examined more closely, and motivates our final choice.
4.1. Overview
4.1.1. Web based
Framework Suitable for
drawing FTs Suitable for displaying results
Type License
Framework description
Cytoscape.js[10 ]
Yes Yes JavaScript
Library
MIT
Cytoscape.js is a JavaScript framework for displaying graphs, and has extensions that make it suitable for drawing them as well. Cytoscape.js is discussed in more detail below.
Meurs
Challenger[11]
No No Flash
Application
Proprietary
Meurs Challenger is a closed source tool for data driven graph visualization. Currently it is available to the public as a Facebook application which displays a network of the user’s friends.
SpicyNodes[12] No No Flash
application
SaaS
SpicyNodes is a service for displaying information in a radial graph. Spicy nodes works a service, meaning a connection to the SpicyNodes servers must be maintained at all times. Spicy nodes is limited to displaying a small amount of information at a time, and can only display that in a radial graph format.
VEGA[13] No Yes JavaScript
Library
BSD
VEGA is a language for specifying data visualizations, as well as a library for rendering those visualizations. VEGA is not a dedicated graph drawing framework, but rather a visualization framework that happens to include graphs.
yFiles/yEd[14] Yes Yes JavaScript
library (among others)
Proprietary
yFiles is a line of commercial graph rendering and editing products. The line includes graph drawing frameworks for a range of platforms, including a web framework that is similar to Cytoscape.js and is discussed in more detail below.
4.1.2. Locally embeddable
Framework Suitable for
drawing FTs Suitable for displaying results
Type License
Framework description
BioFabric[15] No No Java
Application
LGPL
BioFabric is an experiment in the visualization of large scale graphs. It renders vertices as horizontal lines instead of as points, and renders edges as vertical lines connecting those horizontal lines.
BioTapestry[16] Possibly Possibly Java Application
LGPL
BioTapestry is a tool for modeling large and complex networks. The tool focuses on biological networks, but if it can reasonably adapted to FTs it might be useful for this project.
Gephi[17] No Possibly Java
Application
CDDL + GNU GPL 3
Gephi is a tool suite for making and analyzing data driven graphs. While it is good at making complex visualizations, it is not particularly suitable for letting users draw a graph manually.
Graph-tool[18] No No Python module GNU GPL 3
Graph-tool is a python module for graph analysis that has some features for graphical exporting, but no features for graphical creation of graphs.
GraphStream[1 9]
No No Java
Application
CeCILL-C and LGPL v3
Graphstream is a library that focuses on dynamic graphs. It works by modeling graphs as a stream of graph events (adding, removing, or changing elements).
JUNG[20] Possibly Possibly Java
Framework
BSD
JUNG (fully: Java Universal Network/Graph Framework) is a general purpose graph modeling, analysis, and visualization library.
Microsoft Automatic Graph Layout[21]
No No .NET Library MIT
4.1.3. Miscelaneous
Framework Suitable for
drawing FTs Suitable for displaying results
Type License
Framework description
CINCO[22] Yes No Eclipse plugin Eclipse Public
License v1.0 CINCO (fully: CINCO SCCE Meta Tooling Framework) is a modified version of the Eclipse IDE, aimed at creating graphical interfaces for Domain Specific Languages. CINCO is discussed in more detail below.
CmapTools[23] No No Java
Application
Proprietary
CmapTools is a closed source tool for creating and sharing concept maps.
Graphviz[24] No No Software Suite Eclipse Public
License Graphviz is a language for defining graphs, and a set of tools for rendering graphs written in that language to a variety of graphical formats.
NodeXL[25] No No Microsoft Excel
plugin
Microsoft Public License NodeXL is a plugin for creating graphs from Excel sheets.
PGF/TikZ[26] No No TeX Package GPL
PGF and TikZ are a pair of languages for specifying vector graphics in TeX. The languages are not limited to defining graphs, but are well suited for that.
Rigi[27] No No C program confidential4
Rigi is a program for graphical analysis of source code. It can take C or Cobol code and produce a graph that shows its program flow.
Science of Science Tool (Sci2)[28]
No No Eclipse plugin Apache 2.0
Sci2 is a toolset for graphical data-driven analysis of a number of scientific datasets. Among its functionalities is the ability to create network graphs from data.
Tulip[29] No No C++
Framework LGPL
Tulip is a framework for the visualization of relational (database) data.
4 Rigi comes with a custom license with ambiguous confidentiality clauses that may cover the license itself.
Framework Suitable for
drawing FTs Suitable for displaying results
Type License
Framework description
Visone[30] No No Java
Application
“free for academic and research purposes”5
Visione is a tool for the analysis of social networks.
4.2. Highlights
After our initial assessment we arrived at three main candidates: CINCO, Cytoscape.js, and yFiles; which we examined in greater detail. This section describes the relative advantages and disadvantages of those frameworks, and why we ultimately opted to use Cytoscape.js.
4.2.1. CINCO
CINCO is a modified version of the Eclipse IDE, aimed at creating graphical interfaces for Domain Specific Languages. The main advantage of CINCO is that it works in conjunction with the Eclipse Modeling Framework. This should make it easy to turn its output into input for the existing tools, using the existing FT metamodel. What CINCO does not support is relaying the output of those existing tools back to the user. On top of that CINCO currently lacks maturity: it is currently not capable of running as a standalone application, instead it requires two eclipse instances to run.
4.2.2. Cytoscape.js
Cytoscape.js is a JavaScript library for graph rendering. The main advantage of Cytoscape.js is that it is easy to update graphs to reflect the results of computations, the very thing CINCO (and most other frameworks) can't do. And as a JavaScript library it runs in all major browsers, allowing an installation-free cross-platform interface. The main downside of using Cytoscape.js is that it will take more effort to integrate with the existing tools, compared to CINCO.
There has already been a group at the UTwente that has done a very similar project: the webANIMO[31] project. This project focused on a different type of graphs (related to biological processes), but similarly uses a web interface to design graphs; uses those graphs as input models for simulation; and presents the results back in the original graph.
4.2.3. yFiles
yFiles is a proprietary format for storing graphs, with multiple suites of editing software. One of these suites, yFiles for web, seems similar to Cytoscape.js; and could probably serve as a mostly equivalent alternative. There is one area in which yFiles appears superior to Cytoscape.js: edge management; specifically yFiles offers functionality that neatly lays out edges automatically, something that is missing from Cytoscape.js. While this functionality would be nice to have, it was not deemed worth the license fees associated with the use of yFiles.
4.2.4. Conclusion
Ultimately we opted to use Cytoscape.js for the following reasons: 1. It meets our needs almost perfectly.
2. We have experience with the framework, and know that it will work. 3. It is free software, in both the free speech and free beer meanings.
5. Design Choices 2: Client-Server Balance
This chapter deals with the second major choice that is worth elaborating on: the balance of responsibilities between the client and the server. Because we are going with a web based solution -following the choice of graph drawing framework-; we will need a server to host the interface, as well as a client to render it. Besides these obvious fixed responsibilities, there are two important responsibilities that could be allocated to either the server or the client: storing the FTs, and analyzing the FTs. Deciding how to allocate these responsibilities has a significant impact on both the development process and the resulting product. The responsibilities could be allocated in basically any combination to the client and the server; it would even technically be possible to allocate the responsibilities to both the client and the server, and letting the user decide which combination to use. Adding responsibilities to both the client and the server would not add any fundamentally new advantages, it would merely allow choosing which distribution of responsibilities (with associated advantages and disadvantages) to use on a per case basis. Adding responsibilities to both the client and the server would however add a lot of complexity to the system, and would thus increase the needed development time significantly.
There are four possible ways to distribute the responsibilities amongst the client and the server. Of these four, one (storing the FTs on the server while doing the analysis on the client) is needlessly complicated with no redeeming qualities. The remaining three options are discussed in sections 5.1 through 5.3, followed by a conclusion in section 5.4.
5.1. Option 1: both on the client.
5.2. Option 2: both on the server.
In this option the FTs are stored and analyzed on the server. Besides not compromising on the scope of the project, this approach has two potential advantages: Firstly, it might enable the server to do clever things like deduplication and storing preprocessor results; which might boost performance. Secondly, if some form of collaborative editing is desired, it would make sense to run that through the server. The downsides of this approach are also twofold: Firstly, it basically necessitates some form of user accounts to keep track of who owns which FTs. Secondly, it restricts analysis to the options that the server offers (can legally offer).
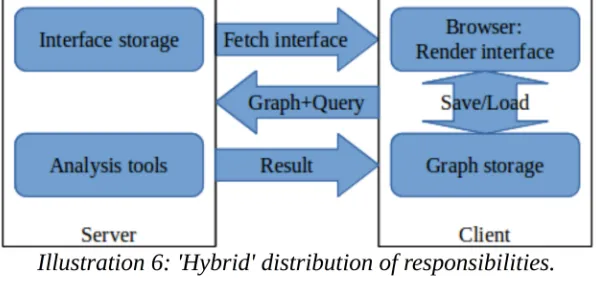
5.3. Option 3: hybrid solution.
In this option the FTs are stored on the client, but the server offers analysis capability. This approach eliminates the downsides of the second option, at the cost of making the upsides of the second option harder to attain: FTs are tracked at the client side so user accounts are no longer needed for that; if an analysis tool is not offered by the server, it can still be installed and used locally; and with caching technology the advantages could be recreated to some degree.
5.4. Conclusion
The table below ranks the advantages and disadvantages of the three options. Primary concerns are those that we feel directly affect how well the solution will meet the requirements. Secondary concerns are features that might be nice to have, but we feel do not directly affect how well the solution will meet the requirements; and given their size they realistically are not likely to get implemented in the scope of this research. As it scores a perfect score in the primary concerns, we choose option 3 for our solution.
Option Primary concerns Secondary concerns Ease of
use analysisOn-line analysisOff-line Collaboration Deduplication storageCloud
1/client -- -- ++ -- --
--2/server + ++ -- ++ ++ ++
[image:29.595.149.447.194.336.2]3/hybrid ++ ++ ++ 0 0 0
6. Design Context
Design does not happen in a vacuum. This chapter focuses on how the project is organized, and what is needed to use our solution. The first section deals with the target operating environment (i.e. the software needed to use our solution), including an explanation for why we split the server technology stack into two parts. The second section explains how our project is set up with its various subprojects and dependencies. The final section describes how to obtain access to our code.
6.1. Target operating environment
This section describes the operating environment for which we will be developing our solution. We have chosen to use a client-server setup (for reasons explained in chapter 5), as such there will be two target operating environments: the client, and the server. These operating environments are detailed in subsections 6.1.1 and 6.1.2 respectively. The server operating environment has partway through the project been expanded to include Java Servlet technology, the motivation for this can be found in subsection 6.1.3.
6.1.1. Client
For the client we expect a modern web browser: Our target browser is Mozilla Firefox, but we do not depend on any features specific to that browser, and the client has also been tested on Google Chrome. We recommend running the client on a system with a mouse, but have made accommodations for touch interfaces so it works on tablets. We have not made accommodations for small screens, so the interface is unlikely to provide a good user experience on smartphones. The choice not to accommodate small screens was made because: we feel that -by their nature- small screens are ill suited to complex creative work, like creating Fault Trees.
6.1.2. Server
The server actually targets two sub-environments: a front end that serves the webpage the client displays, and a back end that performs computations for the client.
For serving the front end, we targeted a common free solution: LAMP6. Specifically the
current Long Term Support version (v16.04) of the popular Ubuntu Linux distribution, with the Apache HTTP Server and PHP packages form the Ubuntu repository (we do not actually use MySQL, or any database system). Any other PHP capable webserver should also work, but this combination is popular, free, and easy to install.
6.1.3. PHP + Java Servlets
This subsection explains why we chose to use PHP for our server side scripting, and later chose to complement that with Java Servlets (a technology for serving content using Java).
The initial choice for PHP was based on its popularity, and the corresponding likelihood that webhosts and future developers will be familiar with it. This assumed familiarity should make the system easy to deploy and maintain. Other than this we were not aware of any reasons to pick one server side scripting solution over another; in particular, we did not anticipate any noticeable difference in performance.
During informal integration testing of a prototype, it was noticed that analysis of a tiny (three node) attack tree took a significant amount of time7. The affected analysis
function outputs the results directly to the interface (rather than to a file for download), which gives -the perceived time it takes to produce a response- a major impact on the overall usability. While we have no hard targets for response times, we do care about usability.
To find the cause of the slowness, we first tested the server in isolation: we used wget
to query the server, and time8 to measure the response time. Ten invocations yielded an
average response time of 9.7 seconds, the complete results can be found in the table below. Next we looked at what on the server could explain this slow response: The analysis for attack trees mostly consists of preexisting Java code, with a PHP script to invoke that Java code. Our suspicion was that having PHP invoke Java code was inefficient, and that a native Java server could be more efficient. Thus we encapsulated the Java code in Servlets, installed Apache Tomcat to host the Servlets, and measured the response times again. The Servlets had an average response time of 0.28 seconds, approximately 9.4 seconds shorter than PHP. Repeating the informal integration test also confirmed that the perceived response time was now at a level we consider acceptable.
Serving method Individual response times average
PHP 10.31 9.68 9.67 9.58 9.66 9.55 9.61 9.44 9.63 9.87 9.70 Servlet 0.42 0.38 0.30 0.26 0.26 0.25 0.21 0.26 0.26 0.24 0.28
Table 2: Analysis response times per serving method.
7 based on the perception of the tester, this test was not timed 8 /user/bin/time, not the bash built in command
6.2. Project setup
This section describes various subprojects that make up our project, as well as the external projects that our project depends on; and how they depend on each other. Our project consists of three subprojects, depends on two fully9 external projects, and one
mostly10 external project. An overview can be found in Illustration 7, and we elaborate
more below.
1. PHP subproject: This subproject houses the PHP content used to render the user interface. The PHP code does not directly depend on the Servlet subproject, but it does assume that the services provided by the Servlet subproject are available somewhere.
2. Cytoscape.js project: This project houses the graph drawing framework that we use to draw FTs.
3. Servlet subproject: This subproject houses our Java Servlet code. It allows our Java code to be efficiently queried over http. It has been put in a separate subproject because Servlets are JavaEE technology and this subproject is made with Eclipse for JavaEE; whereas the metamodel and initializer were made with Eclipse for modeling.
4. ADTool project: This is an external tool for making and analyzing Attack Trees, which we use for Attack Tree analysis.
5. Metamodel initializer subproject: This subproject houses code to create a metamodel instance from the saves our client produces. Because it is a one way transformation, we decided that it would be of no use outside the context of this project; and therefore we did not include it in the metamodel project.
6. Core metamodel project: This preexisting project houses the metamodel we use to transform FTs to various formats. Some contributions which we felt might benefit other users have been made to this project. Code specific to the interface project has been deliberately kept out of the metamodel project, to minimize interference with ongoing development of the metamodel.
6.3. Project hosting
This section describes where and how our project is available. An online version of iFat is currently hosted at:
http:// ctit-vm1.ewi.utwente.nl/ FT_analysis/
The code is shared through a git repository at:
https://vcs.utwente.nl/source/AFTinterface/ under the GNU Affero General Public License.
7. Interface Design
This chapter discusses the design of our user interface. An image of the interface can be found in Illustration 8. The chapter starts with a section that describes the main interface elements. Following that are two sections that describe menus warranting extra description (the File menu has been a part of GUI design since at least the 1983 Apple Lisa, and is presumed familiar).
7.1. Core interface elements
This section describes the four main areas that make up our interface. An image marking the areas can be found in Illustration 9.
1. Graph rendering area: The large area in the center of the interface is the graph rendering area. This is used to display and manipulate the tree structure.
2. Menu/tool bars: At the top of the interface is a row of menus to manipulate the tree as a whole. Below that is a row of buttons to facilitate manipulation of the
tree structure.
The menus are drop down menus that expand when the cursor hovers over them. To facilitate touch interfaces (which might not have a cursor), the menus can also be expanded by clicking on their labels, in which case they stay expanded until the label is clicked again. This dual behavior in the menus may not be obvious; to make communicate the behavior, we used a three pronged approach. Firstly, we added a graphic to the menu label that changes based on the state of the menu, these graphics can be found in Illustration 10. Secondly, we added a message to menus that are expanded by clicking, explaining how to revert to hover behavior. Finally, we made the Tree Type menu start expanded, so that this messages is visible when opening our interface; this menu with the message can be seen in Illustration 11.
36 iFat: an Interface for Fault/Attack Trees Bas Klein Essink
3. Data manipulation controls: To the left of the graph rendering area are the data manipulation controls. This is a sidebar with controls to manipulate the properties of selected nodes. The data manipulation controls can be hidden at will to leave more room for the graph rendering area, and are automatically hidden if nothing is selected.
4. Analysis controls: To the right of the graph rendering area are the analysis controls. This is a sidebar with controls to run on-line analysis on the tree (currently only ADTool analysis of the Attack cost). Like the data manipulation controls this bar can be hidden to leave more room for the graph rendering area.
7.2. Tree Type menu
This section describes the Tree Type menu, one of the noteworthy menus. The Tree Type menu lets users select which tree features and data domains to use. The menu consists of two parts: the actual Tree Type part, and the Domains part.
The Tree Type part lets users pick a type of tree they want to build, like Static Fault Tree in Illustration 11. Based on this selection the use of gate types and domains can be restricted, e.g. Static Fault Trees can not have Priority-AND-gates (amongst others) added to them, nor can they have the Attack Cost domain active. The default Tree Type is Anything Goes, which does not pose any restrictions on which gate types can be added or which domains can be active.
This menu was originally just the Domains section, the Tree Type section was added based on user feedback (see chapter 10 member VI). The Tree Type was merged into this menu because, from a user perspective, the two are closely related: both follow from the decision of what kind of tree one wishes to make. We chose to use Tree Type as the name for the new version of the menu, because we felt that it is the more generic term; and it is more intuitive to look for specific menus under a generic label, than it is to look for more generic menus under a specific label.
7.3. Style menu
The style menu allows users to change the style of nodes based on on the node’s properties. It is possible to change both the size and color of a node. The color interpolates over the Hue in the HSL11 color scheme, rather than interpolating directly
over RGB12 color values. This was done because interpolating over Hue gives a clearer
gradient, especially near the middle of the range. The difference can be seen in Illustration 13.
11 Hue, Saturation, Luminance 12 Red, Green, Blue
38 iFat: an Interface for Fault/Attack Trees Bas Klein Essink
Illustration 12: Size and color options.
Illustration 13: HSL vs RGB gradient: top: Hue 0-Hue 120;
8. Data flow design
This chapter describes the internal workings of iFat, focusing on the various components that communicate with each other. The chapter is split into two sections describing the server and the client respectively. An overview of the data flow can be found in Illustration 14.
8.1. Server
Our server is split into two parts. The first part is a PHP capable webserver (we used Apache httpd); it holds the resources that the browser uses to render the interface. The second part is a Java Servlet Container (we used Apache Tomcat); it handles the more computationally involved server tasks. The motivation for this split is elaborated on in section 6.1.3.
The Transformation Servlet handles requests from the client for model transformations. This is used when the user wants to export a fault tree to a format that can be used by other tools. It takes a serialized fault tree, initializes a metamodel instance of that, and then transforms it to the requested format. The Transformation Servlet can output any output format supported by the metamodel; though not to the XML format13 that
metamodel instances are natively stored in. To allow exporting to that format, a separate Model Initializer Servlet was made. This Model Initializer Servlet is essentially the same as the Transformation Servlet, except that it bundles and returns the metamodel XML files instead of transforming them; because of its high similarity, it was omitted from Illustration 14.
The Analysis Servlets (currently only ADTool) handle requests from the client for fault tree analysis. It takes a serialized fault tree, initializes a metamodel instance of that, then transforms it to the appropriate format, feeds that to the analysis tool, and then returns the result.
8.2. Client
The client is implemented as a webpage, compatible with any modern browser (we used Mozilla Firefox as primary browser, some testing was also done with Google Chrome). The core of the interface is the Cytoscape.js graph rendering library, with extensions to allow the manual creation of graphs.
The Cytoscape graph rendering context is used to view and manipulate the structure of the tree. The tree, stored in Cytoscape storage (a memory structure managed by Cytoscape.js), is then enriched with data entered in the data manipulation controls. The data (de)serializer can convert the tree to/from a format that can be stored, and from which the tree can later be restored. Alternatively, the serialized format can be sent to the server for further processing. The serialized tree can serve as input (but not as output) for the metamodel, allowing it to be exported to a number of formats that can be used by analysis tools. The export controls can save this exported format for off-line analysis. The analysis controls can instead use on-line analysis tools on the server. The results of analysis may be shown directly in the analysis control, or used to enrich the tree data. The ADTool analysis tool does both: it computes the attack cost of non-leaf nodes, which is used to enrich the tree; and it computes a list of cutsets, which is shown inside the analysis control. An example of this can be seen in Illustration 8.
9. Validation Plan
This chapter describes our validation plan. Our validation plan consists of two stages: Expert testing, aimed at improving the product; and (non-expert) user testing, aimed at quantifying the relative merit of iFat. The two stages are described in more detail in their respective sections below.
9.1. Expert testing
This section describes our expert testing stage. This stage was aimed at producing feedback to improve the product. As such it was a small scale experiment asking for broad feedback. Experts were selected from faculty members that were familiar with both fault trees and software development. They were given a prototype to try, and asked for their opinion on it and what they would like to see improved. Where possible the experts were also observed as they used the prototype. The feedback and observations from this were compiled into a list of actionable items, which can be found in chapter 10.
9.2. User testing
This section describes our user testing stage. This stage was aimed at determining how well our solution performs, in comparison to other academic tools. The results should tell us how well we have succeeded in our goal to make a more user friendly interface for fault tree analysis. To this end we have asked our test subjects to do a series of exercises with our solution and two existing tools, and grade the tools on the following criteria: ease of use, graphical appeal, and clarity of results. The complete survey can be found in Appendix C.
9.2.1. Test subject selection
To get meaningful results, it is important to have good test subjects. Our test subjects should be representative of people using fault trees, yet not be biased to any specific tool, and available in sufficient numbers to give significant results. For our test subjects we have chosen students in whose domain-of-study fault trees are relevant, but who have not yet had any courses involving fault trees. We specifically chose the following domains:
Business Administration
Fault and Attack Trees are often used to inspire business decisions, and are thus relevant to this domain.
Computer Science
Attack Trees often involve a significant software vulnerability angle; and security should be a relevant issue to all computer scientists.
Electrical & Mechanical Engineering
10. Expert Testing feedback and resulting
changes
This chapter describes the results of the expert testing validation stage. Because the purpose of the expert testing was to improve the product, the feedback and observations have been turned into a list of actionable items. This list is given below, with for each item how we addressed it (or why we didn’t address it).
I. Resizing buttons
The textual label for toolbar buttons was initially contained within the buttons itself. The label was normally hidden; and when the mouse hovered over a button, it would expand to reveal the label. This was criticized because: as a side effect, other buttons could be moved to make room for the expanding button; and it is generally undesirable to have interface elements move around.
We addressed the criticism by moving the label to a tooltip that would be shown outside the button. The difference can be seen in Illustration 15.
II. Claustrophobic menu bar
The menu bar has been described as “Claustrophobic”. The menu bar is the top left part of Illustration 16, where it says ‘File’, ‘Domains’, and ‘Style’.
We addressed this with a combination of measures. The most straightforward measure was doubling the height of the menu bar itself. Another measure was to add an image after each menu bar element. These images not only increase the spacing between the menu bar elements, but also more clearly mark them as drop down menus, and change to reflect the status of the menu (closed, open, forced open). The final measure was to add a big high-contrast (white on black) title bar above the menu bar. This more clearly delineates the border between browser menus and interface menus, and increases the visibility of the title. The result can be seen in Illustration 17.
Illustration 16: Menu and Tool bars, old situation.
Illustration 17: Menu and Tool bars, new situation.
III. No image and incorrect terminology for basic
events
The ‘Basic Event’ button did not have an image (when the other images were created, we skipped the Basic Event, because it was not needed for our vertices). Also we mislabeled ‘Basic Event’ as ‘Base Event’.
We addressed this by adding an image for Basic Events, and correcting the label. The difference can be seen between Illustration 16 and Illustration 17.
IV. Unclear button effects and stickiness
It has been reported that -for some toolbar buttons- the effects were not completely clear. Especially the fact that most buttons remain active (until replaced by a click on another button) was not clear; e.g. the ‘Basic Event’ button lets a user place a basic event on every click when active, instead of only on the first click.
We addressed this by expanding the tooltips introduced in feedback I, to include an explanation of the effects of the button. We decided not to change the activation behavior of the buttons; because we believe that the current behavior will be more efficient once users are used to it, on account of it allowing users to quickly place many elements in a row.
V. Error when processing large trees
Testers ran into size limitations when trying to upload trees to the server for processing. The problem has no hard limit in graph size where it appears (theoretically a single node could trigger it, if the node has a very long label); quick testing suggests that the problem reasonably starts manifesting somewhere between half a dozen and a dozen nodes. The problem is caused by the use of http GET requests (which have size limits) to query the server.
We addressed the problem by switching from http GET requests to http POST requests for sending trees; POST requests do not have the size limitations of GET requests, but are less convenient for development.
VI. It’s easy to create trees that cannot be analyzed,
and there is no pre-analysis validation
Tester commented that it is too easy to create trees that cannot be exported to certain formats, or cannot be analyzed by certain tools; and that it is not clearly communicated when and why tools and export options don’t work. They requested that a way be added to limit the interface to features supported by certain formats or tools; and to add validation to check compliance.
We addressed this by building a system that allows users to select a tree type; and block interface features based on that. The result can be seen in Illustration 11. The menu to select the tree type has been merged into the old ‘Domains’ menu, because the choice of what type of tree to make is closely related to the choice of what domains to use.
VII. The ‘Auto layout’ function does not always
produce good layouts
Illustration 18: 'good' auto-generated layout.
Illustration 19: 'bad' auto-generated layout, parent on same level as child.
Illustration 20: 'bad' auto-generated layout, parent below child.
While we agree that a better layout algorithm for fault trees could probably be written, we feel that it is beyond the scope of this project to do so, therefore we will not act on this issue.
11. Conclusion
This chapter describes the results of our work. The first section describes how well our solution satisfies the requirements. Unfortunately, user tests were not completed, so we will not be able to conclude how the usability of our solution compares to that of existing products.
11.1. Satisfaction of requirements
This section describes which of the requirements (specified in chapter 3) are met by our solution. The section starts with an overview table listing the requirements and whether we consider them to be met, followed by a motivation for which requirements we consider met.
Requirement Met Comment
I Creating of Fault/Attack Trees yes
II Graphical interface yes
III Integrated tool-chain yes
IV Clear and intuitive result visualization yes
V Core Features yes
VI Static FT yes
VII Dynamic FT yes
VIII Repairable FT no Not supported by metamodel
IX Attack tree yes
X Support existing metamodel yes
XI Support DFTCalc no
XII Support ADTool yes
XIII Mean Time To Failure no Dependent on DFTCalc
XIV Mean Time Between Failures no Dependent on DFTCalc
XV Reliability no Dependent on DFTCalc
XVI Availability no Dependent on DFTCalc
XVII Minimal Cut Sets partially Partially dependent on DFTCalc XVIII Minimal cost to induce system
failure
[image:47.595.83.513.262.647.2]yes
Our solution allows the creation of Fault and Attack Trees through a graphical user interface, thereby meeting requirements I and II. Our solution provides an integrated tool-chain for the analysis of Attack Trees using ADTool, thus it meets requirement III. We feel that the failure -to integrate Fault Tree specific tools into the tool-chain- does not prevent requirement III from being met, because adding more tools is relatively straightforward (provided that the tools work). The results of the analysis can be intuitively visualized using the color and size of nodes, thus requirement IV is met. Our solution supports all core tree features, as well as all features related to Static Fault Trees, Dynamic Fault Trees, and Attack Trees; and thus meets requirements V, VI, VII, and IX. The features for Repairable Fault Trees have not been included, so requirement VIII has not been met. Support for Repairable Fault Trees was scrapped because the current version of the metamodel does not support Repairable FT, and eventual support is likely to be more complex then what we envisioned when specifying our requirements.
Our solution supports the metamodel and ADTool, and thus meets requirements X and XII. Our solution does not support DFTCalc, for reasons explained in section 12.2, therefore we have not met requirement XI. Following the tool support, the query requirements related to Attack Trees (XVIII and XVII) have been met, while those related to Fault Trees (XIII, XIV, XV, XVI, and XVII) have not. Because Minimal Cut Sets (requirement XVII) apply to both Fault Trees and Attack Trees, and we only support querying them for Attack Trees; we consider requirement XVII to be partially met.
12. Discussion & Future work
This chapter discusses what we have done, both our successes and our failures; and discuss what future work we hope may come from our work.
12.1. Built a working product
The great success of this project is that we have made a working GUI for the creation of Fault/Attack Trees, that can be used to design trees for a range of analysis tools. The GUI integrates with ADTool, making Attack Tree analysis particularly easy. Although to be fair: ADTool has a decent GUI, so the gains for that tool are limited. iFat also makes the use of other, text based, tools easier and less intimidating for non-expert users; because they can now make the tree in a GUI, and then have the textual representation generated for them, ready to serve as input for their tool. Finally iFat makes comparative analysis of tools easier; because benchmark trees need only be designed once, and can then be exported to the input formats of the respective tools.
12.2. Failed to integrate DFTCalc
We have been unable to build a working version of DFTCalc, each attempt failing due to missing dependencies. We ultimately traced the problem to the proprietary CADP[32] library, which has been changed in a way that is not backwards compatible. Since licenses for older versions of CADP are no longer being issued, there is no way to install DFTCalc unless/until it is rewritten to use the new version of CADP (or to no longer use CADP at all). If such a rewrite is done we recommend a new attempt to integrate DFTCalc into iFat.
As an alternative to DFTCalc we attempted to use the Storm[33] model checker. Storm is a model checker that does not depend on CADP, and supports fault trees in the input format (Galileo) that DFTCalc uses. This attempt also failed due to compatibility problems: where we have chosen to use the latest Long Term Support version of Ubuntu (16.04) as development target; while Storm does not support Ubuntu versions prior to 16.10. Certain libraries in the Ubuntu 16.04 repository are too old for successful compilation of Storm; installing the explicitly mentioned dependencies from the Ubuntu 16.10 repository14 does not solve the problem. Storm is also distributed as a
virtual machine with precompiled binaries. Attempting to use these binaries (inside this virtual machine) resulted in segmentation faults.
12.3. Failed to complete user tests
We have been unable to find impartial volunteers willing to complete the user test survey. We approached potential candidates through E-mail, IRC, and in person. We found that people were generally willing to take a brief look at our product; but were unwilling to actually use our solution (and two existing products) for the estimated 30 to 45 minutes (total) that our survey takes. Adding a chance to win one of four €10 cinema coupons (paid from our own personal money) had no effect. The only people
willing to take our survey were acquaintances, willing to do it as a personal favor. We decided that -acquaintances doing the researcher a personal favor- could not reasonably be assumed to be unbiased, and to abandon the user tests. We recommend attempting the user tests again should an actual budget become available that allows for larger participation incentives.
12.4. Future updates to metamodel
The metamodel is still in active development. Features, like repairable Fault Trees, are still being added to it. We hope and expect that these features will be added to iFat as future work.
One development that we hope to see happen with the metamodel, is for it to become clearer what is and is not supported by which transformations. And that the TreeType feature gets expanded to use that information. The current TreeType system is very limited, and only the ADTool option is really based on a concrete tool.
It should be possible to create a metametamodel (a metamodel describing the
metamodel) to automate some of the simple work of keeping iFat up to date with the metamodel. Things like node types, export formats, and value domains could be largely automatically generated. This might be over-engineering though: a lot of the information iFat uses is not used in the metamodel (descriptions, icons, etc) and would have to be manually entered into the meatmetamodel solely to then be injected into iFat; adding it to iFat directly might be easier. So we do not recommend this last idea for future work, we merely felt that it was interesting enough to share.
12.5. Future additions to the interface
The development of iFat was focused on making the basic functionality work well. There are ideas that we had but didn’t implement due to time constraints. Hopefully the following features will be implemented in future work:
1. Support for more on-line analysis tools 2. Undo/redo
3. Copying/pasting of tree parts 4. Folding (hiding) of parts of the tree 5. Cloud storage support
6. Collaborative editing (multiple people working on the same tree at the same time)
We also had an idea for composite trees: where a tree could have subtrees defined in a different file. We even had a bachelor student looking into that idea, but he left abruptly and without giving a reason. He was also supposed to give the interface a graphical makeover; in anticipation of this makeover the style of iFat has been kept deliberately spartan.
13. Reflection
This chapter is devoted to my personal reflections on the role of design science in computer- and information science; as well as the lessons that I have learned from this project. This chapter is more personal and less formal than the other chapters of my thesis.
13.1. Design science
Design science distinguishes itself from ‘regular’ science by producing an artifact, rather than knowledge or understanding, as primary result. This raises questions about the scientific merit of design science; after all, is the point of science not the creating, testing, and sharing of knowledge and understanding? The question of scientific merit is one I struggled with when accepting this assignment (making an interface for fault attack trees) for my master thesis: I was confident that I could build a nice system, and that doing so would serve as a demonstration-of-technical-competence befitting of a master thesis; but does it further the state-of-the-art? Sure, I designed and implemented a complex multi-disciplinary software solution that interacts with several other pieces of software, but that is what I was trained for. While nothing quite like my solution exists (to the best of my knowledge), none of the technology I used is really new, so I’d be hard pressed to call it innovative. And while I did learn a few things during this project, none of that is any significant revelation that advances the state of the art; nor did I acquire enough reliable data to count as solid groundwork.
The crux of the matter is the following question: What makes design into design science? The first thing that comes to mind is the fact that I am writing this thesis about my work. Sharing what you did, and what can be learned from that, is a key part of science. But if that were enough, then -every software development project with a development blog- would be doing design science. That would cheapen the meaning of the word science more than I am willing to accept. And of course I am not just sharing my findings; but also my code, so that others may build upon my work. I feel that the FOSS spirit of sharing your work aligns well with the noble scientific ideals. But again that is not enough to make my work science. What I think does make my work science is my dedication to objectivity. In this case the dedication to objectivity manifests itself in not making conclusions about the usability of my product; because the user test failed to produce objective data to base such conclusions on. The failure of the user test was frustrating. I was tempted to conclude that iFat is probably still an improvement in usability, especially over DFTCalc; but I didn’t: I’d done my best to set up an objective test, and since that was inconclusive I do not get to make conclusions.