Supervisors:
Dr. L.J.M. Kroft, MD
Dr. J. Geleijns
Prof.Dr.Ir. C.H. Slump
Dr. M. Groenier
Technical and clinical analysis of
ULDCT
Master Thesis
Leiden, 2017 Author:
Technical analysis and potential added clinical value of
Ultra-Low Dose Computed Tomography compared to
chest X-ray
L.L. van der Velden
Acknowledgements
I would like to thank in particular my supervisors: radiologist dr. Lucia Kroft and medical physicist dr. Koos Geleijns, from the Leiden University Medical Center (LUMC) for mentoring me during my graduation year. I express gratitude to Lucia Kroft for always being available for guidance. The communication with you was gratifying, and progressed the study. You as supervisor were always there for me, even for my solicitations.
Koos Geleijns encouraged me to proceed the initial project and helped me to find solutions. He also helped me realize that it is important to balance and enjoy my life. Next time, I hope to see you at the next Christmas drinks in room K4-44.
I would also like to thank Prof.dr. Albert de Roos for his participation in this study by his evaluation of many CXR images and ULDCT images. His lessons, how to interpret the images more precisely, were valuable.
Further, Prof.dr. Slump and dr. Irene Hernandez gave me advice and inspiration for assessing the image quality. I am grateful for those lessons and it helped me understand the technical aspects of the CT-images.
I would like to also thank Irene Hernandez warmly for the support she gave me when the project was on the ‘brink to collapse’. She encouraged me to proceed the study and talk about the problems. The late night scanning days were companionable and I learned a lot of CT parameters and working with different phantoms.
I would like to say thanks to Marleen for guiding me during my internship.
Contents
Acknowledgements ... 2
Abstract ... 4
Master Project Outline ... 5
Paper ... 6
Appendix I: Background... 23
Appendix II: METC protocol... 33
Appendix III: Study protocol ... 34
Appendix IV: Score Forms ... 35
Abstract
PURPOSE: The goal of this study is to technically evaluate and to determine the added clinical value of Ultra-Low Dose Computed Tomography (ULDCT) for detecting chest pathology in clinical practise compared to routine Chest X-Ray (CXR).
MATERIALS AND METHODS: 50 patients underwent in addition to CXR an ULDCT (120-135 kV, 10 mA, pitch 1.388:1, 0.3-s rotation time). The CT scans were reconstructed with IR
reconstructions (Adaptive Dose Reduction 3D (AIDR3D) and Forward projected model-based Iterative Reconstruction SoluTion (FIRST), Toshiba Medical Systems, Otawara, Japan). All images were evaluated by two expert radiologists and scored with the use of scoring forms. For 10 patients quantitative parameters were measured to assess differences between the two reconstruction
techniques.
RESULTS: All ULDCT were qualified as being of diagnostic quality by the radiologists.
Significant differences were detected between the two modalities, with a higher sensitivity of 10% for the detection of pulmonary pathology for ULDCT compared with CXR. For eight (16%) patients the ULDCT had a clinical added value by changing their treatment policy. The effective dose of ULDCT (0.071±0.007 mSv) was only slightly higher compared to CXR (0.040±0.018 mSv, p<0.05). FIRST CT reconstructions showed noise reduction in the 5 mm slice reconstructions techniques, but did not have added clinical value compared to AIDR3D.
CONCLUSION: An ULDCT with comparable dose to CXR is more sensitive to detect chest pathology and may be used in clinical practise.
Abbreviations
CXR Chest X-Ray
LDCT Low Dose Computed Tomography ULDCT Ultra-Low Dose Computed Tomography SDCT Standard Dose Computed Tomography SNR Signal to Noise Ratio
NPS Noise Power Spectrum
MTF Modulation Transfer Function DLP Dose Length Product
AIDR3D Adaptive Dose Reduction 3D
Master Project Outline
The work presented in this thesis is part of a research project of Leiden University Medical Center (LUMC) in The Netherlands. It belongs to the field of diagnostic Radiology.
For this master project the thesis is organised as follows:
Paper
Appendix I: Background information
Appendix II: METC-protocol
Appendix III: Scan-protocol
Appendix IV: Scoring-forms
Paper
Technical analysis and potential of Ultra-Low Dose
Computed Tomography compared to chest X-ray
Introduction
In modern healthcare, medical imaging has become essential for patient diagnosis. Two-dimensional (2D) radiography is still used frequently, but there is a rapid increase of three-dimensional imaging (3D, volumetric) and even four-three-dimensional imaging (4D, with time as an additional dimension) with techniques like Computed Tomography (CT) and Magnetic Resonance Imaging (MRI). CT has become a widespread tool in daily clinical work-up, and clinical demand is increasing [7]. However, radiation doses for patients can be high, particularly in CT, and
accumulate when the scans are repeated for example during follow-up [1, 2]. Radiation absorbed dose is associated with increased probability of malignancies, especially for younger patients. For this reason, the society wants to limit the radiation exposure of patients following the ALARA principle, keeping dose “as low as reasonably achievable”.
Chest X-Ray (CXR) radiography is the first choice imaging modality for detecting pulmonary pathology, because of the low costs and low radiation dose compared with standard CT. However, CXR examination has an important diagnostic limitation by being a 2D projection technique, while CT provides 3D volumetric evaluation of the chest. CXR could lead to false negative and false positive results caused by over-projection of the ribs over potential lesions, for example, despite highly trained professional radiologists [3]. A standard CT scan with an effective dose of 6 mSv is more sensitive for detecting pulmonary pathology compared with CXR with a hundred times lower effective dose of 0.06 mSv [4, 5].
Currently, efforts are made to reduce radiation dose for CT by using techniques such as automatic exposure control. This may decrease the radiation dose up to 60%. In addition, lowering the tube current (particularly in iodine enhanced contrast studies, like CT angiography) and using iterative reconstruction techniques can decrease the radiation exposure up to 74% [6, 7]. Furthermore, several studies have shown that low dose CT and Ultra-Low Dose CT (ULDCT) of the chest is feasible for detecting and characterizing a variety of pulmonary diseases at a radiation dose below 1 mSv [2, 8-10]. It has also been shown that chest examinations performed using ULDCT at a dose level that is equivalent to CXR examination, allows detecting pulmonary nodules with similar sensitivity compared to previous standard or low dose CT techniques with filtered back projection [2, 11]. Based on these findings, it is hypothesized that ULDCT may improve the potential clinical value as compared to CXR, at a similar radiation dose as CXR.
The goal in this study is to technically evaluate and determine the added clinical value of ULDCT compared to CXR for detecting chest pathology by means of a patient study.
Materials and Methods
Study design
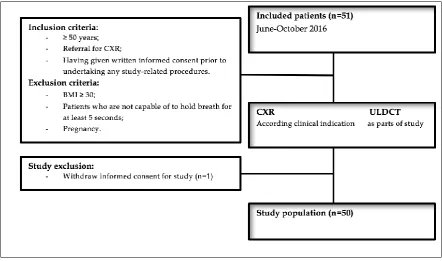
Fifty patients referred for CXR with suspected pulmonary pathology were included in this
Patients
Patients were selected based on the clinical indication for referral between June and October 2016. A total of 51 patients were included in the study, one patient withdrew the informed consent and was therefore excluded, the resulting study population was 50 patients (30male, 20 female; mean age ± 64 years). Inclusion and exclusion criteria for this study are listed in Figure 1.
Data acquisition
The CXR radiography was performed on clinical indication using a digital radiography system of DelftDI (Triathlon DR, Oldelft-Benelux, Delft, The Netherlands). Radiographs were made with a standard acquisition protocol (133 kV, 320 mA, automatic exposure control, 2.5 mm Al and 0.1mm Cu filters). Field size was adapted individually. The ULDCT examination was performed, using a volumetric 320-detector row CT scanner (Aquilion ONE, Toshiba Medical Systems, Otawara, Japan). To reduce the radiation dose the topogram was not performed. The scan range comprises the lung apex to the dorsal sinus. The CT acquisition was performed during inspiration breath-hold. The ULDCT scan was performed in helical mode with the following acquisition parameters: detector collimation 40 mm (80 active detector rows of 0.5 mm width), beam pitch 1.388, FOV 400.0 mm, 0.3-s rotation time. Tube voltage 120 kV - 135 kV, tube current 10 mA, without tube current modulation.
All CT image data (512512 pixels per image, 0.78 mm/pixel) were reconstructed using two reconstruction methods: Adaptive Dose Reduction 3D (AIDR3D) and Forward projected model-based Iterative Reconstruction SoluTion (FIRST). Images were reconstructed selecting 5 mm and 1 mm slice-thickness and 2.5 mm and 0.5 mm slice interval, respectively. In Table 1 the
[image:8.595.63.506.171.432.2]reconstruction kernels are listed. All images were sent to the picture archiving and communication system (PACS) and assigned to a radiologist for clinical evaluation.
Table 1. Thereconstruction kernels that were used in this study to reconstruct the CT images.
Reconstruction Kernel AIDR3D 5mm Soft tissue kernel (FC18) FIRST 5mm Soft tissue kernel (Body, standard)
AIDR3D 1mm Lung kernel (FC08) FIRST 1mm Lung kernel (Lung, standard)
CT data analysis
Effective dose
The effective radiation dose (E) for ULDCT and CXR was calculated. For ULDCT the Dose-Length Product (DLP) was multiplied by a conversion factor of 0.014 mSv/mGy⋅cm for the chest [12]. For CXR the Dose Area Product (DAP) was multiplied with conversion factors 0.22
mSv/Gy⋅cm2 (Posterior Anterior projection) and 0.14 mSv/Gy⋅cm2 (lateral projection) to calculate the effective dose [13].
Image noise
Image quality for CT was analyzed with the Signal to Noise Ratio (SNR), Noise Power Spectrum (NPS) and Modulation Transfer Function (MTF) using images of the Catphan phantom [14]. The SNR was calculated for 10 patients by dividing the CT density (measured in Hounsfield Units, HU) by image noise (HU) in a Region Of Interest (ROI) with a minimum area of 1.8 cm2. A total of eight different structures were measured with ImageJ; muscles, air in the trachea, bone, aorta,
heart, subcutaneous tissue, liver and air outside the patient. The NPS provides a description of the
noise as a function of frequency. The images were reconstructed with FBP as a reference and with AIDR3D and FIRST. A ROI (128×128 matrix in 50 slices) was defined on the central part of CT images of the uniformity module of the Catphan phantom. To avoid an offset in the Fourier transform, the mean pixel value of the ROI was subtracted from the matrix. The extracted matrix was then formed into a 512×512 matrix, by adding zeros to the matrix. The 2D NPS was then computed as:
𝑁𝑃𝑆2𝐷(𝑓𝑥, 𝑓𝑦) =∆𝑥∆𝑦 𝐿𝑥𝐿𝑦
1
𝑁𝑅𝑂𝐼 ∑ |𝐹𝑇2𝐷{𝑅𝑂𝐼𝑖(𝑥, 𝑦) − 𝑅𝑂𝐼̅̅̅̅̅𝑖}|
2 𝑁𝑅𝑂𝐼
𝑖=1
(1)
Here ∆x, ∆y are the pixel sizes in their dimension. Lx Ly are the ROI’s lengths (in pixel) and NROI is
the number of ROI’s used in the average operation and 𝑅𝑂𝐼̅̅̅̅̅𝑖 is the mean pixel value of the ROI. FT2D stands for the 2D Fourier Transform. Finally, to present the results as a 1D NPS, the NPS was
radially averaged. Calculations were done with Matlab (Matlab R2016a, MathWorks).
The MTF quantifies the degradation of the contrast across spatial-frequencies. Images of the Catphan phantom (CTP401 Module) were acquired with the study protocol (Appendix III) and the images were reconstructed with FBP as reference and with AIDR3D and FIRST (5mm slice
Qualitative analysis of images
Clinical reading and reporting was performed by two board-certified thoracic radiologists (reader 1, with >15 years and reader 2 with >25 years of experience in clinical thoracic radiology). The radiologist read and reported the CXR images before reading and reporting ULDCT images to avoid prior knowledge. Clinically available post-processing tools such as multiplanar
reconstruction, zoom factor, window-with and window-level were used for the evaluation.
The potential of ULDCT examinations for detection of chest pathology, as compared with CXR, was evaluated with the use of a clinical scoring system and secondly withascientific scoring system (Appendix IV).In the clinical scoring form pathology can be identified and will be scored with a degree of certainty. At last, regarding the clinical radiological diagnosis for the CXR and ULDCT examinations will be determined.
In the scientific scoring form, for both CXR and ULDCT investigations, the presence of pulmonary pathology such as atelectasis, pulmonary consolidations, ground glass opacities (GGO), pulmonary nodules and emphysema will be scored. Also, the images will be scored for the presence, extent, and location of enlarged lymph nodes, masses, effusion and pleural plaques. Additional pathology can be indicated on the scoring system.
Overall image quality will be scored on a modified 4-point Likert scale (1= not useful for diagnostic purposes, strong artifacts; 2= severe blurring with uncertain evaluation; 3= slight blurring with unrestricted diagnostic image assessment; 4= excellent image quality, no artifacts). Image quality 1 and 2 will be considered non-diagnostic. Image quality 3 and 4 will be considered as diagnostic. Next, the level of confidence regarding the clinical radiological diagnosis for the CXR and ULDCT examinations will be determined and specified with a modified 4-point Likert scale (1= not useful for detecting pulmonary pathology; 2=severe blurring with uncertain evaluation of pulmonary pathology; 3= slight blurring but diagnostic for pulmonary pathology; 4= excellent detectability of pulmonary pathology).
When comparing ULDCT with CXR, the AIDR3D reconstruction was used. To evaluate differences between the two reconstruction methods, the scientific scoring form was used comparing AIDR3D and FIRST (Appendix IV).
Cost-Benefit
The cost-benefit analysis was performed for CXR and ULDCT examinations by measuring parameters that can be associated to the costs, in particular in-room time, clinical reading and
reporting time. This was measured by a stop-watch and noted on the scoring system. In addition, the costs of ULDCT and CXR were taken as published by the Nederlandse Zorgautoriteit (NZa) [16].
Statistical analysis
Statistical analyses were performed using the McNemar test for paired proportions to determine variation between ULDCT and CXR with the use of the data derived from the clinical and scientific score form [17]. The studies were tested by the percentages of diagnostic or non-diagnostic
To test other study parameters, the McNemar test was used to determine the variation in detectability of pulmonary pathology for the reconstruction algorithm in ULDCT comparing AIDR3D versus FIRST. In addition, the effective radiation dose between ULDCT and CXR was compared with the paired two-tailed student’s t-test and 95% confidence interval (CI). Also, Cohen’s kappa (κ) statistics and 95% confidence intervals (95% CI) were used for inter/intra-observer variability assessment between ULDCT and CXR (0.00–0.20 poor agreement; 0.21–0.40 fair agreement; 0.41–0.60 moderate agreement; 0.61–0.80 good agreement; 0.81–1.00 excellent agreement).
All tests were processed with standard error of 5% and 95% CIs. P-values (2-sided tests) lower than 0.05 will be considered to indicate statistical significant differences. Statistical analysis was
performed using SPSS for Windows (SPSS, version 23.0, Chicago, IL, USA).
Results
[image:11.595.51.516.359.407.2]Computed tomography and data reconstructions with AIDR3D and FIRST were completed as planned for all patients, and were compared with CXR images. Images for a total of fifty patients were analysed. Table 2 shows the average effective dose for CXR and ULDCT in this study.
Table 2. Effective radiation dose (E, mSv) for CXR and ULDCT.
E, mean (mSv) N E, SD (mSv) p-value CXR 0.040 50 0.016 <0.05
ULDCT 0.071 50 0.007
*SD is the standard deviation
Effective radiation doses
Mean effective doses in ULDCT and CXR were 0.071±0.007 mSv and 0.040±0.018 mSv. A significant difference (p<0.05) was observed for the effective doses between ULDCT and CXR (Table 2), with effective doses 0.03 mSv higher for ULDCT compared to CXR. In Figure 2, a boxplot is shown with the results.
[image:11.595.152.446.522.750.2]Image Quality
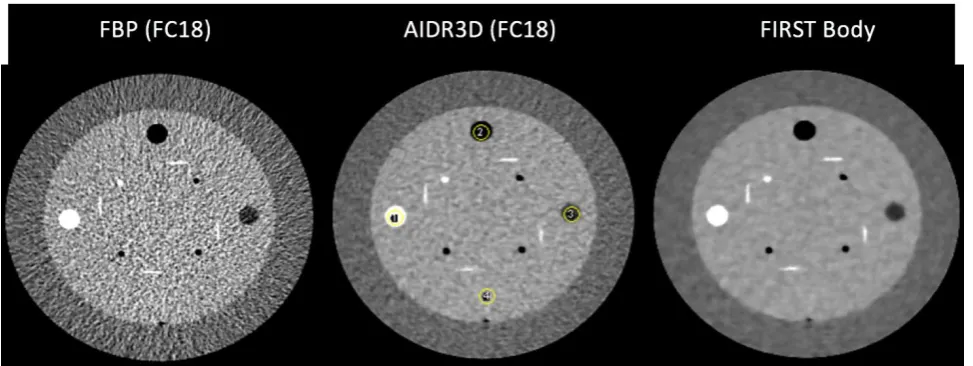
[image:12.595.76.523.214.646.2]Overall image quality was rated by two radiologists, with a Likert score of 4 corresponding to excellent image quality without artefacts. There was no significant difference (p>0.05) for images quality between ULDCT and CXR. The difference in images quality reconstructed with FBP, AIDR3D and FIRST can been seen in Figure 3. It has to be noted that the radiologists did not score patient images reconstructed with FBP in this study.
Figure 3. Zoomed images of the heart of one patient reconstructed with FBP, AIDR3D and FIRST. MPV is the Mean Pixel Value and σ is the noise and are measured in the yellow ROI.
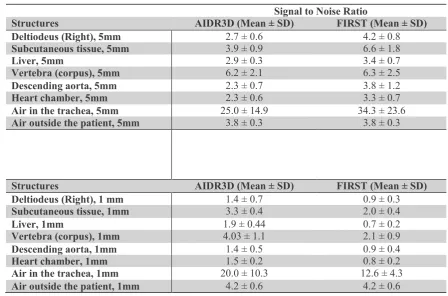
Table 3. SNR measurements in eight different structures. In the 5 mm, slice thickness FIRST body has an overall higher SNR value than AIDR3D and, in the 1 mm slices AIDR3D has an overall higher SNR value than FIRST Lung.
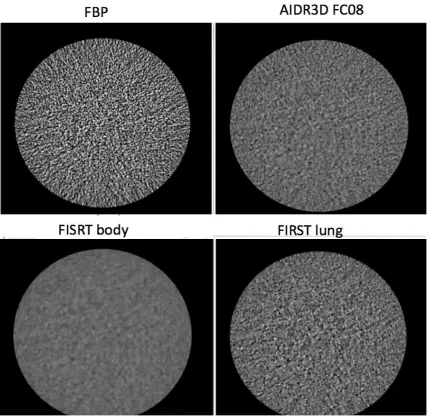
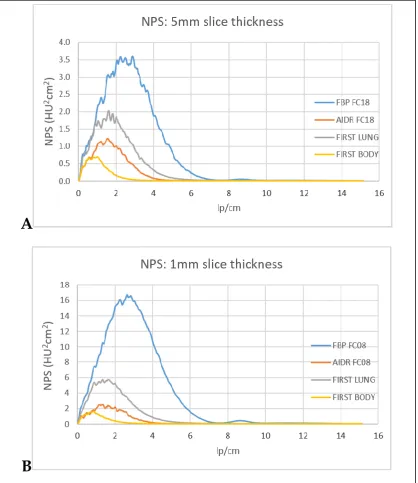
Results regarding the NPS measured for the different reconstruction methods FBP, AIDR3D (FC18 and FC08) and FIRST (Body and Lung) are shown in Figures 4 and 5. Differences were observed in the NPS profile. A higher noise level, measured over a central ROI on the uniform module of the Catphan phantom, (σ =74 HU) was found in the 5 mm slice thickness for the FBP reconstruction (Table 4). In contrast, FIRST body contained a lower noise level of σ=10 HU in the 5 mm slice thickness. However, the curves were shifted to the left towards lower frequencies with a plateau top of the curve. This can lead to a blur effect. Also, the top of the curve for the FIRST body raised exponentially fast at low frequencies and drops down already at 1 lp/cm. In Figure 4 it can be observed that this represents visually as blur, the radiologists describe it as a ‘plastic effect’. AIDR3D (σ=32 HU, 1 mm slice thickness) gave a lower noise level than FBP (σ=117 HU, 1mm slice thickness) and FIRST lung (46 HU, 1mm slice thickness), but did not result in the plastic visual effect compared to FIRST body in the images (Figure 4). Overall, the 5mm slice thickness reconstructions had a lower noise level compared with the 1 mm slice thickness, which was expected.
Table 4. The standard deviation (noise), measured on CT images of the uniformity module of the Catphan phantom, for different reconstruction techniques.
Standard deviation (σ, HU) FBP (FC18), 5mm slice thickness 74
FBP (FC08), 1mm slice thickness 117 AIDR3D (FC18), 5mm slice thickness 22 AIDR3D (FC08), 1mm slice thickness 32 FIRST (Body), 5 mm slice thickness 10 FIRST (Lung), 1 mm slice thickness 46
Signal to Noise Ratio
Structures AIDR3D (Mean ± SD) FIRST (Mean ± SD)
Deltiodeus (Right), 5mm 2.7 ± 0.6 4.2 ± 0.8
Subcutaneous tissue, 5mm 3.9 ± 0.9 6.6 ± 1.8
Liver, 5mm 2.9 ± 0.3 3.4 ± 0.7
Vertebra (corpus), 5mm 6.2 ± 2.1 6.3 ± 2.5
Descending aorta, 5mm 2.3 ± 0.7 3.8 ± 1.2
Heart chamber, 5mm 2.3 ± 0.6 3.3 ± 0.7
Air in the trachea, 5mm 25.0 ± 14.9 34.3 ± 23.6
Air outside the patient, 5mm 3.8 ± 0.3 3.8 ± 0.3
Structures AIDR3D (Mean ± SD) FIRST (Mean ± SD)
Deltiodeus (Right), 1 mm 1.4 ± 0.7 0.9 ± 0.3
Subcutaneous tissue, 1mm 3.3 ± 0.4 2.0 ± 0.4
Liver, 1mm 1.9 ± 0.44 0.7 ± 0.2
Vertebra (corpus), 1mm 4.03 ± 1.1 2.1 ± 0.9
Descending aorta, 1mm 1.4 ± 0.5 0.9 ± 0.4
Heart chamber, 1mm 1.5 ± 0.2 0.8 ± 0.2
Air in the trachea, 1mm 20.0 ± 10.3 12.6 ± 4.3
Figure 4. Catphan phantom images (1mm slices) of the three reconstruction techniques: FBP, AIDR3D and FIRST. FBP (σ=74 HU, 5mm slices) contains the highest noise level which can be recognized by the graininess. AIDR3D (σ=22 HU, 5mm slices) has less noise than FPB (σ=74 HU, 5mm slices) and the noise texture is different. FIRST lung (σ=46 HU), 1mm slices) contain more noise than AIDR3D (σ=32 HU, 1mm slices), because the graininess is
Figure 5. (A) is the NPS profile for 5 mm slice thickness and (B) is the NPS profile for 1 mm slice thickness. For both figures the FBP contains the highest level of noise. In contrast, FIRST has the lowest level of noise level of, however, the curves are shifted to the left with a plateau top. This means that the FIRST reconstruction is more sensitive for lower frequencies. Further, the 1mm slices thickness contains for all reconstructions more noise than for the 5 mm slices.
The pixel values (HU) of the materials present in the CTP401 Module (Figure 6) are shown in Table 5. The pixel values for FBP are presented as reference. For the other reconstruction methods AIDR3D and FIRST the HU values differs. However, the values are in the 10% order.
A
B
0.00 0.50 1.00 1.50 2.00 2.50 3.00 3.50 4.000 2 4 6 8 10 12 14 16
N PS (H U cm ^2) lp/cm
NPS: 5mm slice thickness
FBP AIDR FC18 FIRST LUNG 0 2 4 6 8 10 12 14 16 18
0 2 4 6 8 10 12 14 16
H
U
^2cm
^2
lp/cm
NPS: 1mm slice thickness
FBP
AIDR FC08
[image:15.595.58.477.87.571.2]Figure 6. Catphan reconstructed with FBP, AIDR3D and FIRST.Four ROI (yellow circles) were selected to compute the MTF. Number 1 consist is Teflon, number 2 is air, number 3 is low density polyethylene (LDPE) and number 4 is acrylic. However, number 4 was excluded, because the location could not be detected correctly due to the high noise in the images, as it is similar in composition to the material in which this particular module of the phantom is cast.
Table 5. The attenuation value (HU) and standard deviation (std) measured in a ROI of the materials: Teflon, Air and Low-Density polyethylene (LDPE) in images reconstructed with different reconstruction techniques (5mm slice thickness).
FBP FC18 AIDR3D FC18 FIRST Body Manufacter
CT value *
HU std HU std HU std HU
Teflon 954.6 3.0 927.7 3.5 933.3 7.1 990
Air -1006.4 8.4 -980.7 8.8 -983.1 8.8 -1000
LDPE -85.3 7.3 -80.4 5.5 -80.3 5.3 -100
* CT value according to the Catphan phantom specifications [14].
Results regarding the MTF (in terms of f50 and f20) measured for the different reconstruction
methods FBP, AIDR3D (FC18) and FIRST (Body) are shown in Table 6. The quantitative analysis showed similar performance between reconstruction techniques. However, a small decrease in spatial resolution was found with AIDR3D and FIRST in air. Next, in Teflon a small decrease in spatial resolution was found with AIDR3D. And, in LDPE only for FBP (f20) a small decrease was found for the spatial resolution.
Table 6. Spatial resolution results based on MTF measurements and given in terms of f50 and f20 (spatial frequencies at
which MTF=50% and MTF=20%, respectably) for three materials in the Catphan phantom (air, Teflon, LDPE) for different reconstructions and 5 mm thick slices.
f50 (lp/mm) f20 (lp/mm)
FBP AIDR3D FIRST body FBP AIDR3D FIRST body
Air 0.433 0.383 0.383 0.614 0.554 0.554
Teflon 0.352 0.332 0.352 0.493 0.483 0.504
Diagnostic clinical value
To evaluate the diagnostic clinical value of the images, the scoring forms were analysed. For all fifty patients the CXR, as well as, the ULDCT images, were rated as ‘diagnostic %’ by the radiologists which can be seen in Figure 7A.
Figure 7B depicts the detectability of pathology in both modalities. Pulmonary pathology was detected in 29 patients (58% of the patients) with CXR and in 42 patients (84% of the patients) with ULDCT. However, both modalities had a mean Likert-score of ± 4 for the detectability of
pulmonary pathology and when comparing the Likert-scores with the student t-test, no differences were found (p>0.05). This means that while reading the images, these are regarded by the
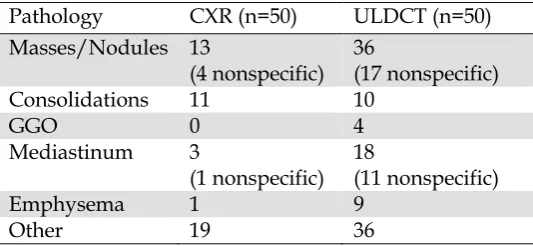
radiologist as sufficient quality for diagnosing certain pathology while taking into account the intrinsic limitation for that method. However, the sensitivity for ULDCT was higher than for CXR for the detection of pulmonary pathology. This can be seen in Table 7. It should be realised that 19 out of 36 of detected nodules were unspecific and 11 out of 18 pathologies observed in the
mediastinum was due to the detection of calcified scleroses (9 out of 11) in the arteries, which is common at an age of 50 and higher. ULDCT detected 5 enlarged lymph nodes whereby CXR only 2.
[image:17.595.64.524.169.395.2]Figure 7. (A) The diagnostic value of the ULDCT images to use in clinical practice for two modalities: ULDCT and CXR. (B) The detectability of pulmonary pathology. From the whole study group 58% pulmonary pathology was seen with CXR and 84% with ULDCT. Difference of 26 % in detectability was found between the two modalities.
Table 7. The detection frequency for nodules, Ground Glass Opacities (GGO), pathology in the mediastinum, emphysema and other pathologies.
Pathology CXR (n=50) ULDCT (n=50)
Masses/Nodules 13
(4 nonspecific) 36
(17 nonspecific)
Consolidations 11 10
GGO 0 4
Mediastinum 3
(1 nonspecific) 18 (11 nonspecific)
Emphysema 1 9
Other 19 36
0% 20% 40% 60% 80% 100% D iag n o sti c val u e (% )
A) Diagnostic value: CXR and
ULDCT, n=50
CXR ULDCT 20 25 30 35 40 45 N u m b e r o f p atien ts, d e te cte d wi th p ath o lo gyB) The detectability of
pulmonary pathology n=50
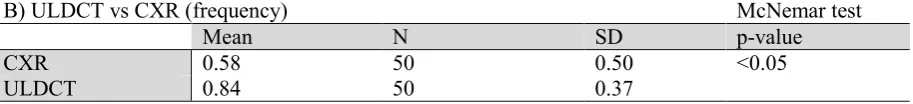
[image:17.595.182.449.486.609.2]When analysing the images to determine if any pathology could be detected (Tables 8 and 9), using the McNemar test, significant differences were found in the two modalities (p<0.05). With the ULDCT thirteen times more pathology was detected by radiologists compared with CXR.
Table 8. Conclusion of the images: ULDCT VS CXR. On the ULDCT the frequency of pathology found was higher, where on CXR patient images were more often scored as normal.
A) ULDCT vs CXR
CXR Conclusion
ULDCT Conclusion Normal Pathology
Normal 8 13
Pathology 0 29
Table 9. McNemar test: ULDCT VS CXR. A significance difference of p<0.05 was found.
B) ULDCT vs CXR (frequency) McNemar test
Mean N SD p-value
CXR 0.58 50 0.50 <0.05
ULDCT 0.84 50 0.37
[image:18.595.51.532.446.621.2]*SD is the standard deviation
Table 10 shows the results of the findings in the CXR and ULDCT images, classified in normal, pathology not relevant, pathology relevant and pathology relevant and not relevant.
Table 10. The results of the findings in the images are divided into normal, pathology not relevant, pathology relevant and pathology relevant plus not relevant.
Image conclusion, n=50 CXR Total
Normal Pathology not relevant
Pathology relevant
Pathology relevant and not relevant
ULDCT Normal 8 0 0 0 8
Pathology not relevant
7 6 0 0 13
Pathology
relevant 5 0 12 0 17
Pathology relevant and not relevant
1 2 6 3 12
Total 21 8 18 3 50
In Table 10, 29 out of 50 patients (58%), an equal result was found for CXR and ULDCT.
[image:19.595.66.532.353.598.2]However, only in eight out of the 50 patients (16%), the radiologist concluded a normal image with both modalities. In 29 out of the 50 patients (42%) with the same results showed in Table 10, additional findings were detected in both modalities. Serendipity occurred, because in 11 out of these 29 patients (37.9%) other valuable information for the patient was detected with the use of ULDCT after analysing the pathology that was noted by the radiologist on the scoring forms. Possibly, 6 out of the 50 patients (12%) were interpreted wrong on the CXR.
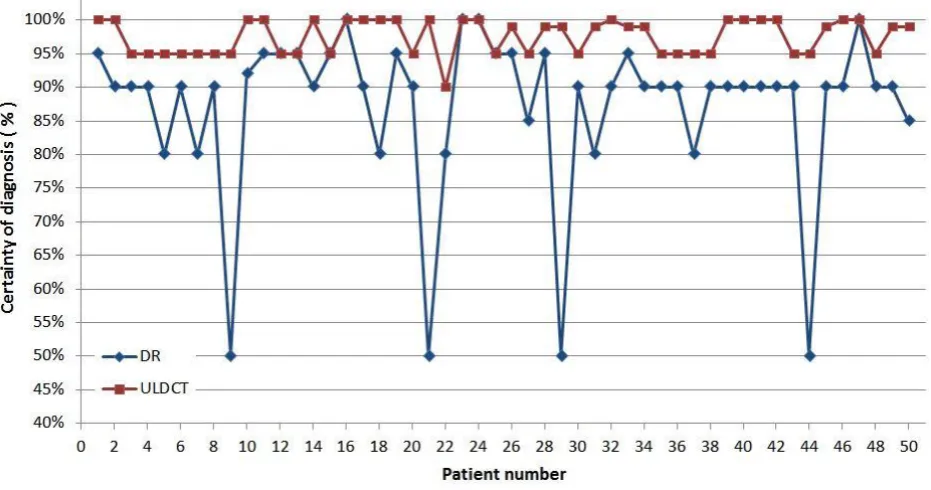
Figure 8 shows the certainty of diagnosis (%) of both modalities, CXT and ULDCT per patient. Results showed a certainty of diagnosis of 87% for CXR and 97% for ULDCT. Overall, ULDCT had an average 10% higher in certainty of diagnosis compared with the CXR (Figure 8). The ULDCT has a significant higher level of certainty compared with CXR (p<0.05). Further, no differences were founded for the detection of pathology between the reconstructions techniques AIDR3D and FIRST (p>0.05). All pathologies that were detected with the AIDR3D were also detectable with the FIRST reconstruction. However, it was noted, by radiologists, that the nodules in the FIRST reconstructions were more conspicuous, because of the high contrast appearance. In one case the soft tissue structures, inside the mediastinum, were separated slightly better compared with the AIDR3D reconstruction.
Cost Benefit analysis
The costs, scan time and reading time of an image were evaluated and compared with the benefits of replacing CXR by ULDCT in the clinic and are shown in Figure 9. According to the NZa, a CXR image costs €41,12 and a CT of the thorax €144,52 [16]. Further, the results show an average scan time for a CXR image of 1:44 (min:sec) and a slightly higher average scan time for the
ULDCT image of 3:46 (min:sec). And, the average CXR reading time was 2:27 (min:sec) compared with a higher average reading time for the ULDCT of 6:16 (min:sec). An overview of costs and benefits are enumerated in Table 11.
[image:20.595.60.539.217.417.2]Figure 9. (A) Boxplot of the scan time and (B) boxplot of the reading time for radiologist of the two modalities.
Table 11. An overview of the costs and benefit when CXR is replaced by ULDCT.
Cost Benefit
2:03 (min:sec) extra scan time for ULDCT 10% more certainty of diagnosis with the ULDCT
3:49 (min:sec) extra reading time by radiologist for ULDCT
14 times different results between CXR and ULDCT
€103.40 extra costs for making an ULDCT
images
Policy changed for 8 times after a ULDCT (16%)
Intra/Inter-observer variability
The K-statistic (0.00–0.20 poor agreement; 0.21–0.40 fair agreement; 0.41–0.60 moderate agreement; 0.61–0.80 good agreement; 0.81–1.00 excellent agreement) showed a moderate agreement inter-observer variability value of ϰ = 0.52 for the ULDCT and CXR. Further, a good intra-observer variability agreement was showed for both readers with an inter-observer value for reader 1 of ϰ =0.71 and an inter-observer value for reader 2 of ϰ =0.84.
[image:20.595.67.530.470.570.2]Discussion
This study has investigated the potential clinical value of ULDCT compared to CXR, with a similar effective radiation dose. The main findings were that all images, both for ULDCT and CXR, were qualified as diagnostic and useful in clinical practice. Dependability of ULDCT seemed to be 10% higher compared with CXR. And, the sensitivity for detection of chest pathology with ULDCT is higher compared with CXR (p<0.05). Further, the image quality measured as the SNR for fifty patients was in favor for the 5mm FIRST body reconstructions and 1mm AIDR3D reconstructions.
The results showed a significant difference between the two modalities, ULDCT and CXR, in the detection of chest pathology. Some pathology that seemed to be relevant on the ULDCT may appear irrelevant pathology after further investigations. Drageset et al. showed that in this case, patients cope than with emotions such as anxiety and uncertainty, which can have an impact on the quality of life of the patient [18].
The pathology of the present study was rated as normal (no pathology), pathology relevant,
pathology not relevant and pathology relevant and not relevant. Serendipity occurred in 11 out of 29 patients when additional findings were found in both modalities. In this study the radiologists were convinced that ULDCT was the ground truth compared with CXR. This is in compliance with recent literature suggesting acceptable detection of specific pulmonary pathology with low-dose CT [10, 19, 20]. Also, for 6 out of the 50 (12%) patients pathology differ between the two modalities and were possible false positive on the CXR according to the radiologists. However, standard dose CT (SDCT) has to be made as reference standard to conform that ULDCT has also an acceptable detection of pulmonary pathology as well.
The image quality measured as the SNR over fifty patients was in contrast with the opinion of the radiologists, who preferred AIDR3D images for both the 5 mm slices and 1 mm slices. This could be because radiologists are familiar to AIDR3D and not to FIRST noise texture. In addition, some noise is inherent to CT, use of 100% IR may not be immediately appealing to most radiologists, because of unusually smoothed appearance [21]. In our study the results showed almost constant SNR values for all tissues, except for the air in the trachea and vertebra. The SNR value of the vertebra can be explained by the change of the bone due to age and gender. A high SNR value 20 was observed for air in the trachea. In contrast, the SNR of air outside the patient was a factor 5 lower compared with the air inside the patient. No explanation was found for this high SNR, but the result were comparable with findings published by Yamada et al. [22].
Parameters for measuring the image quality on IR algorithms are difficult, due to the non-linear, not shift variant and non-stationary properties of these algorithms compared with the linear FBP
reconstructions. Multiple methods are tested to acquire optimal results [24]. One method is the MTFTask which is used in this article. However, the resolution depends on contrast, reconstruction kernel as well as radiation dose level and biases in the measurement could occur. In our results the Differences between the reconstruction kernels were very small. A bias in the post-processing could be the reason or the high noise value in FBP. Differences between AIRD3D/FBP and FIRST could be due to differences in kernels.
A standard dose CT has an average effective radiation dose of 5.7 mSv which can be reduced with a regular low-dose CT protocol to 0.5-0.7 mSv in clinical practise. In our study, the ULDCT radiation dose was similar to the dose level reported in some phantom studies [11, 25] and in one patient study [11]. A ULDCT dose level is similar to a CXR radiation dose. With a patient group of 50, the ULDCT had an mean effective radiation dose of 0.071 (±0.007) mSv which is in the same range of CXR (𝐸𝑒𝑓𝑓 = 0.040 ± 0.016 𝑚𝑆𝑣 ). ULDCT results in a dose reduction factor of 10-100
compared with LDCT and SDCT respectively. Correct narrow positioning of the laser at the lung apex, as well as, fast manually abort reaction at the end of the dorsal sinus were measured to reduce the dose of the patient. However, variation of the effective dose for ULDCT in our study depended on scan-technical factors and could be avoided with high experienced technicians.
A pattern for which patient group has an added value with ULDCT was not found so far. A reason could be, that the question from the referring doctor was too short and the risk factor was not known. Several studies showed an added value with the use of low dose CT protocol, particularly for screening for lung cancer and metastasis [26-29].
The costs have to be weighed against the following benefits: 10% more certainty of the diagnoses with ULDCT, 28% of the ULDCT results differ from the CXR image with an added value for patients of 16%, because the policy was changed. The costs for an ULDCT was higher compared with CXR. For a correct costs-benefit evaluation other factors such as maintenance costs of the devices and software costs have to take into account.
Finally, the present study has some limitations. Although the current study group consisted of 50 patients, a patient group of 200 patients is required, based on sample-size calculation. Scientifically the ideal comparison to determine the patient groups, which has the most benefit for ULDCT, the study can be divided into multiple subgroups. In addition, the quantitative measurements could have a bias, because the size of the ROI was not the same in all tissues and were for some areas rather small. The measurements were made in only one slice instead of multiple slices. And, the SNR was measured in an inhomogeneous area, and are patient depended. It is possible that the values are more consistent with multiple slices with a large ROI and measured in a homogeneous area. Finally, different materials inside the patient can influence the Hounsfield unit values and image noise. It is unknown how the iterative handles this situation.
Recommendations
It is recommended to investigate the patient group who had a positive result with CT more specific. Patients need to be followed over time and further investigations or recommendations of the general practitioner of physician need to be administered. In addition, a separate study can be designed to investigate the clinical value of this CT-protocol for the screening of lung cancer. Our study showed a higher detection of pulmonary nodules compared with CXR. Other studies already showed
positive results with low-dose CT protocols. However, the effective dose was still more than doubled compared with our study protocol and the effective dose of CXR [27, 28, 30].
Also, the CT-protocol can be individualized to decrease the average doses for ULDCT. For example, reducing the kilo-voltage from 120 kV to 100 kV or mAs for patients with a low BMI, could decrease the average radiation and preserved image quality and might still have a diagnostic value.
Next, the MTF and NPS are limited for the quantification of image quality due to the nonlinear behaviour of the reconstruction algorithms. Other methods could be used instead of the MTF and NPS. For example task based management methods according to Vaishnav et al. [24]. Also, other options like model observers can be investigated.
Appendix I: Background
2.1 History
In 1894 Wilhelm Röntgen has discovered X-ray radiation at the university of Würzburg, it was soon followed by the implementation of radiation for medical radiography. Nowadays, X-ray
radiography provides the first ‘screening’ modality in hospitals. For these images, an X-ray source is directed towards a patient. X-rays that are transmitted through the patient are registered on a digital detector (Figure 1).
In 1967 the first computed tomography (CT) scanner was developed by Godfrey N. Hounsfield. CT scanners reconstruct three dimensional volumic images of patients instead of two dimensional, superimposed images by 2-dimensional projection X-ray radiography. The X-ray source and CT detector rotate around the patient while the patient travels through the CT scanner (Figure 1). The group of Godfrey N. Hounsfield performed the first clinical CT in London in 1971 [31].
[image:24.595.62.531.443.591.2]Already in the nineteenth century it was realized that radiation could have detrimental side effects. Patients and radiation workers in hospitals suffered from skin damage and also radiation induced leukaemia was reported for the first time. Therefore, recommendations for radiation protection were introduced;currentlyknown as the International Commission on Radiological Protection (ICRP) guidelines. This has contributed to the prevention of deterministic effects, such as fibrosis, erythema or necrosis [32].
Figure 1. Computed tomography, the x-ray source and detector rotate around the patient while the patient travels through the CT scanner [33].
2.2 X-ray planar radiography
2.3 Computed Tomography
The technique of CT aims at measuring the transmission of X-rays under different angles through a patient and computing from these measurements the spatial distribution of a physical quantity, the linear attenuation coefficient. In 1940 a patent was granted for the basic idea of today’s computed tomography. A drawing of the equipment to create sinograms and different optical backprojection techniques were included in this patent. Earlier in 1917, J. Radon proved that an object can be reconstructed by infinite amount of lines when the integral values along these lines are known (Equation 1). The English engineer G.N. Hounsfield successfully implemented the theory of Allan M. Cormack. He accomplished the first CT scan of a patient with a large cyst in 1971. From 1971 until now improvements were made, both in hardware as in software resulting in better
performance. For example, the resolution of the first images was poor, several millimetres up to one centimeter and the time to scan one slice was around 300 seconds. Nowadays, a whole CT scan with up to 320 slices may take only a fraction of a second in combination with submillimeter resolution [31, 35].
a) 𝐼 = ∫ 𝐼0(𝐸) × 𝑒− ∫ 𝜇(𝐸)𝑑𝑠
𝑑
0 𝑑𝐸
𝐸𝑚𝑎𝑥 0
(1)
b) 𝑝𝜃(𝑟) = − ln 𝐼𝜃(𝑟)
𝐼𝑜 = ∫𝐼𝑟,𝜃𝜇(𝑟 cos 𝜃 − 𝑠 sin 𝜃 , 𝑟 sin 𝜃 + 𝑠 cos 𝜃)𝑑𝑠
c) 𝑝(𝑟, 𝜃) = ∫−∞∞ 𝑓(𝑟 cos 𝜃 − 𝑠 sin 𝜃 , 𝑟 sin 𝜃 + 𝑠 cos 𝜃)𝑑𝑠
The intensity of radiation in an inhomogeneous object can be calculated with Equation 1a, (b) conversion from intensity into attenuation projection or profile, (c) parallel projection of f(x,y) for angle θ, also called the Radon transform of f(x,y).
2.4 Anatomy of the thorax
The thorax of a human can be defined as the body part between neck and abdomen. The term chest is commonly used as a synonym. The shape of the thorax can be described as a truncated cone, which is narrow superior and broader inferior to the diaphragm. The thorax includes the primary organs of the respiratory and cardiovascular systems and are protected by the thoracic cage.
TH O R A X W A L L
TH O R A X O R G A N S
Inside the thorax cage lie primary organs such as the lungs and the heart. The lungs are
attached/stuck to the rib cage through two membranes also called the pleura visceralis and pleura parientalis, together they are called the pleura pulmonalis. Between the pleura pulmonalis is a really small amount of liquid to overcome friction by respiration and to attach the two membranes. At the left side of the thorax lies the heart and the left lung divided in the superior and inferior lobe. On the right side of the thorax is the right lung divided into 3 segments, the superior right lobe, the middle right lobe and the inferior right lobe. The segments are separated by fissures (Figure 2). The lobes are also divided in tertiary segments to describe the tracheobronchial tree (Table 1). When air is inhaled, it travels from the nose or mouth through larynx, pharynx and trachea into the bronchia, bronchioles and finally in the pulmonary alveolus where gas can be exchanged, because the alveoli do not consist cartilage and are characterized by scattered, thin-walled outpocketings (alveoli).
[image:26.595.183.401.416.696.2]
Table 1. Tracheobronchial tree and bronchopulmonary segments.
Right lung Left lung
Superior lobe Apical Posterior Anterior Superior lobe Apical Posterior Anterior Superior lingular Inferior lingular Middle lobe Lateral Medial Inferior lobe Superior Anterior basal Medial basal Lateral basal Posterior basal Inferior Lobe Superior Anterior basal
Medial basal
Lateral basal
Figure 2. Overview of the lung segments and fissures in a CXR.
PA T H O L O G Y O F T H E T H O R A X
Many different chest pathologies exist that can be detected by imaging. For this study pathologies such as nodules, consolidations, Ground Glass Opacities (GGO), and emphysema were
investigated. A nodule is a space occupying lesion and this could be either solitary or multiple. Nodules are classified according to size, morphology and distribution. Regarding size, nodules can be classified as military nodules: <2mm, micro nodule: 2-7 mm, nodule: 7-30 mm and mass: > 30mm. Regarding morphology, pulmonary nodules can be classified as ground glass, part-solid, solid, or calcified. At last, the nodules can be detected regarding to distribution within the lung: perilymphatic, perifissural, centrilobular or random. With these classifications, the differential diagnosis can be set up (Fleischner Society guidelines) [36].
When the air inside the alveoli is replaced by fluid, blood, mucus or pus, the pathology can be described as a consolidation. Synonyms are air-space consolidation, alveolar consolidation and parenchymal consolidation. Signs of air-space consolidation can be: homogeneous opacity
obscuring vessels, air bronchograms, Ill-definded or fluffy opacities and patchy opacities. When the content is transudate, the differential diagnosis is heart failure, acute respiratory distress syndrome (ARDS), low albumin and renal failure. When the content is septic matter, the most common diagnosis is pneumonia. For blood, the differential diagnosis could be a damage caused by trauma, auto-immune disease (Goodpasture, systemic Lupus Erythematodes) or Henoch Schonlein
vasculitis. Further categorisation is by pattern; lobar or segmental consolidation, diffuse
Table 2. Overview of differential diagnoses coherent to the pattern of the consolidation [37].
Lobar Diffuse Multi-focal
Streptococcus pneumonia Heart failure Staph Aureus pneumonia Klebsiella pneumonia Volume overload Legionella pneumonia Tuberculosis (viral/fungal) ARDS Streptococcus Pneumonia
Sarcoidosis Low albumin Tuberculosis
Contusion Renal failure Aspiration
Metastases
Pulmonary emphysema can be described as the ‘‘abnormal permanent enlargement of the airspace distal to the terminal bronchioles accompanied by destruction of the alveolar wall and without obvious fibrosis’’. Pulmonary emphysema is classified into three main subtypes, based on the anatomical location:
I. Centrilobular emphysema; II. Panlobular emphysema; III. Paraseptal emphysema.
An increased lung volume and lung destruction are radiographic findings. CXR gives a detection sensitivity and specificity of 80% and 97.0% when the lung volume increases and lung destruction appears. When only lung destruction appears, the sensitivity drops to 40%. In contrast, the
sensitivity and specificity for detecting lung nodules with a low-dose CT is 88.9% and 92.6%[38].
The mediastinum can be divided into four divisions for CXR images: anterior, middle, posterior and superior division. However, according to the classification of Felson the superior division is
assigned to the anterior division, because the superior division cannot be distincted from the anterior. Locating pathology within these mediastinal divisions does help with diagnosing specific pathology and diagnosis, as pathology may be specific for location. A limitation for these divisions is that they are no actual anatomic structures. In CT images these divisions are not used, because the location can be described more specific due to 3D visualisation. Different pathologies can be
detected inside the mediastinum such as enlarged lymph, dilation of vessels, sclerotic vessels, masses and pleural plaques.
2.5 Reconstruction technique
CT images can be represented in a 2D plane by a function f(x,y). The images f(x,y) are
reconstructed, from the x-ray attenuation profiles (or projection data p(r,θ)) that are acquired under as many as 900 different angles relative to the patient. Generally this is achieved with the Filtered Backprojection (Equation 2 and Figure 3A).
a) 𝑆𝜃(𝜔) = ∫ 𝑝𝜃(𝑟)𝑒−𝑗2𝜋𝜔𝑟𝑑𝑟 = ∬ 𝑓(𝑟, 𝑠)𝑑𝑠 𝑒−𝑗2𝜋𝜔𝑟𝑑𝑟 ∞
−∞ ∞
−∞
(2)
Here the Fourier slice theorem is shown. (A) The Fourier transform transfers data from the spatial domain to the frequency domain. (B) inverse Fourier transform.
All the attenuation profiles together can be represented in the sinogram, also called the CT raw data (Figure 3b). Then the sinogram is used as an input for the image reconstruction to convert the projection profiles p(r,θ) into the images f(x,y).
Figure 3. (A) 𝑷𝜽 is the Radon transform of f(x,y) in a certain angle θ, (B) projections in multiple angles, 0 ≤ θ ≤ , will
result in a sinogram.
Intuitively one might think that a reconstruction can be made by applying a simple back projection. However, the resulting image will be blurred considerably and can be seen in Figure 4B.
[image:29.595.69.520.229.491.2]Figure 4. Differences in reconstruction methods. (A) original image, (B) Sinogram, (C) unfiltered reconstruction and (D) filtered reconstruction.
2.6 Iterative reconstruction algorithms
FBP has been traditionally used in clinical practise to reconstruct CT images. However, CT images reconstructed with FBP do not always produce diagnostic images for clinical practise at low doses if the tube current is reduced considerably. In FBP, the increased image noise is inherent to the reduced CT radiation dose and makes the images non-diagnostic for clinical application. New reconstruction algorithms, known as iterative reconstructions, resulted in improving the image quality of chest CT by reduction of the noise in the images [39]. Iterative reconstruction algorithms, like adaptive statistical iterative reconstruction (ASIR) or iterative reconstruction in image space (IRIS) algorithm, have been investigated for the detection of nodules with ultra-low dose
acquisition protocols and resulted in an improved diagnostic performance when using them in clinical practise [40]. Another next generation of iterative algorithms, such as model based iterative reconstruction (MBIR), includes modelling of the entire imaging chain and also takes into account the modelling of the noise characteristics of the system [8]. Whereas the implementation of FBP was very similar for all manufacturers, nowadays each company develops their own unique iterative reconstruction algorithms, a short table is listed below (Table 3). Adaptive Iterative Dose
Table 3. Overview of a few manufactors with different iterative reconstruction techniques.
Manufactor Iterative reconstruction
technique
Statical IR/ MBIR Source
GE Healthcare ASiR Statical IR [41],[42]
GE Healthcare Veo MBIR [43]
Siemens Healthcare
IRIS Statical IR [44], [45]
Siemens Healthcare
Safire MBIR [46],[47]
Philips Healthcare iDose Statical IR [48],[49]
Philips Healthcare IMR MBIR [50]
Toshiba Medical Systems
AIDR/ AIDR3D Statical IR/ MBIR
(integrated) [51] Toshiba Medical
Systems
FIRST Statical IR/ MBIR
(integrated)
-
2.7 CT protocols
Various parameters have to be optimised when setting up a CT protocol. The American Association of Physicist in Medicine (AAMP) has investigated low dose CT protocols for lung cancer. The parameters that were investigated in this study were: tube voltage (kV), tube current (mA), exposure time, rotation time, pitch, filters and reconstruction methods. When the radiation dose is reduced in protocols, adjustment and optimisation of the different parameters is performed. The impact on image quality must be taken into account. Some trade-offs are:
- Reduction in mAs results in reducing the radiation dose, but also increases image noise according the relationship: 𝑛𝑜𝑖𝑠𝑒 ∝ 1
√𝑚𝐴𝑠
- Increase of the pitch results in reducing the radiation dose, but may increase the slice thickness.
- Reduction in kVp results in reducing the radiation dose, increase of signal contrast of for example bone, calcium and iodine, decrease of signal-to-noise ratio for soft tissues and can cause beam hardening artefacts.
- Further, with thinner slices or sharp (bone) filters, the noise level can increase.
Trade-offs have to be considered between radiation dose and image quality for each protocol. This is also depending on the specific clinical problem, or what the radiologist wants to detect [26, 52].
2.8 Image quality
The central issue is how accurately the object images are reproduced by the system. Parameters can influence this process (Equation 3) [35, 53].
𝐼(𝑥, 𝑦,′𝑧′) = 𝐾 × 𝑂(𝑥, 𝑦, 𝑧) ∗ 𝑃𝑆𝐹(𝑥, 𝑦,′𝑧′) + 𝑛𝑜𝑖𝑠𝑒 + 𝑎𝑟𝑡𝑖𝑓𝑎𝑐𝑡𝑠
(3)
Here the image (I) depends on energy-dependent contrast factor (K), blurring which is described by the point spread function (PSF), noise and the possible presence of artefacts.
Measurements are performed to determine image quality. The most important parameters and measurements are listed below.
NO I S E/S I G N A L T O N O I S E R A T I O/N O I S E P O W E R S P E C T R U M
Noise is a graininess in an image and is for example caused by fluctuations in the number of x-ray quanta registered by the detector in a Poisson’s distribution (quantum noise). Other types of noise are electrical noise and anatomical noise. For CT and CXR the quantum noise is the most important parameter for image quality. The quantum noise is related to the tube charge (mAs), kV and for CT in slice thickness. From the measurement of noise, the signal to noise ratio (SNR) can be calculated (Equation 4). In contrast, in CXR images the anatomical noise influences the detectability of pathology more than in CT since superposition does not appear in CT.
𝑆𝑁𝑅 = ⟨𝑔⟩ 𝜎𝑔
(4)
Here 𝜎𝑔 is the standard deviation of a variable and ⟨𝑔⟩ is the mean value.
The standard deviation is a simple metric to describe the noise in an image. However, it does not describe the noise texture. Images can have the same noise, but can differ in texture (Figure 5). For this, the Noise Power Spectrum (NPS) can be calculated. This quantity characterizes frequency dependence of the noise (Equation 5) [53].
[image:32.595.141.414.581.746.2]AIDR3D 5mm FIRST 5mm
𝑁𝑃𝑆(𝑓𝑥, 𝑓𝑦) = |∬[𝐼(𝑥, 𝑦) − 𝐼̅]𝑒−2𝜋𝑖(𝑥𝑓𝑥+𝑦𝑓𝑦)𝑑𝑥 𝑑𝑦|
2
(5)
Here 𝒇𝒙 𝒂𝒏𝒅 𝒇𝒚 are the frequencies corresponding to their dimensions, 𝑰̅ is the mean of image I(x,y).
RE S O L U T I O N/PO I N T SP R E A D FU N C T I O N/ MO D U L A T I O N TR A N S F E R FU N C T I O N
Spatial resolution describes the degree in which small details in the image can be detected by the system. The most common method to determine the spatial resolution is by measuring the point spread function (PSF), Line Spread Function (LSF) and modulation transfer function (MTF). The PSF and LSF measures the blurring factor of an object in the spatial domain and can also be described as the response of the image system when measuring a point or line input. To determine the spatial resolution of a linear and shift-invariant imaging system, the MTF can be used with the use of PSF or LSF. However, for nonlinear IR reconstructions the MTF with the use of PSF or LSF is of limited utility in assessing the quality of images. Therefore, the Edge Spread Function (ESF) or other task-based assessments methods are used more often [24]. The ESF gives the response of the device to an edge of a selected ROI. With the ESF the LSF can be calculated by:
𝐿𝑆𝐹(𝑥) = ∂ESF(χ)
∂χ
(6)
With the LSF, which is calculated with the use of the ESF, the normalized MTF can be calculated by taking the modulus of the Fourier transformation of the LSF (Equation 7) [53].
𝑀𝑇𝐹(𝑓) = |∫ 𝐿𝑆𝐹(𝑥)𝑒
−2𝜋𝑖𝑓𝑥𝑑𝑥 ∞
𝑥=−∞
∫𝑥=−∞∞ 𝐿𝑆𝐹(𝑥)𝑑𝑥 |
Appendix II: METC protocol
Appendix III: Study protocol
Aquillion One, Toshiba Ultra-Low Dose CT (ULDCT)
Scan type Helical
Rotations time (s) 0.3
Detector configuration 80*0.5 mm
Pitch Fast (1.388)
Kv 120-135
mA 10
FOV 400.0
Reconstruction AIDR3D/FIRST (body standard and Lung standard)
Slice thickness 5 mm /1mm
Slice interval 2.5 mm/0.5mm
References
1. McCollough, C.H., et al., Achieving routine submillisievert CT scanning: report from the summit on management of radiation dose in CT. Radiology, 2012. 264(2): p. 567-80.
2. Kim, H.J., et al., Ultra-Low-Dose Chest CT in Patients with Neutropenic Fever and Hematologic
Malignancy: Image Quality and Its Diagnostic Performance. Cancer Res Treat, 2014. 46(4): p. 393-402.
3. Kubo, T., et al., Radiation dose reduction in chest CT: a review. AJR Am J Roentgenol, 2008. 190(2): p. 335-43.
4. Schmidt, B., et al., Assessment of patient dose from CT localizer radiographs. Med Phys, 2013. 40(8): p. 084301.
5. Veldkamp, W.J.H., et al., Contrast-detail evaluation and dose assessment of eight digital chest radiography systems in clinical practice. European Radiology, 2005. 16(2): p. 333-341.
6. Kalra, M.K., et al., Strategies for CT Radiation Dose Optimization. Radiology, 2004. 230(3): p. 619-628. 7. Noel, P.B., et al., Does iterative reconstruction lower CT radiation dose: evaluation of 15,000 examinations.
PLoS One, 2013. 8(11): p. e81141.
8. Neroladaki, A., et al., Computed tomography of the chest with model-based iterative reconstruction using a radiation exposure similar to chest X-ray examination: preliminary observations. Eur Radiol, 2013. 23(2): p. 360-6.
9. Khawaja, R.D., et al., Ultra low-dose chest CT using filtered back projection: comparison of 80-, 100- and 120 kVp protocols in a prospective randomized study. Eur J Radiol, 2014. 83(10): p. 1934-44.
10. Christe, A., et al., Accuracy of low-dose computed tomography (CT) for detecting and characterizing the most common CT-patterns of pulmonary disease. Eur J Radiol, 2013. 82(3): p. e142-50.
11. Gordic, S., et al., Ultralow-dose chest computed tomography for pulmonary nodule detection: first
performance evaluation of single energy scanning with spectral shaping. Invest Radiol, 2014. 49(7): p. 465-73.
12. Deak, P.D., Y. Smal, and W.A. Kalender, Multisection CT protocols: sex- and age-specific conversion factors used to determine effective dose from dose-length product. Radiology, 2010. 257(1): p. 158-66. 13. Hart, D., D.G. Jones, and B.F. Wall, Estimation of effective dose in diagnostic radiology from entrance
surface dose and Dose-Area Product Measurements. 1994: Londen, HMSO.
14. Goodenough, D.J. Catphan 500 and 600 Manual. 2006 [cited 2016 10th of December]; Available from:
http://www.uio.no/studier/emner/matnat/fys/FYS4760/h07/Catphan500-600manual.pdf. 15. Richard, S., et al., Towards task-based assessment of CT performance: system and object MTF across different
reconstruction algorithms. Med Phys, 2012. 39(7): p. 4115-22.
16. DBC zorgproducten tariefapplicatie. 2016 09-02-2016 [cited 2016 9th of February]; Available from:
http://dbc-zorgproducten-tarieven.nza.nl/nzaZpTarief/ZoekfunctieDot.aspx.
17. Doré, C.J., Statistical methods for the analysis of biomedical data. Robert F. Woolson, Wiley, Chichester, 1987. No. of pages: 513. Price: £45. Statistics in Medicine, 1989. 8(10): p. 1309-1310.
18. Drageset, S. and T.C. Lindstrøm, Coping with a possible breast cancer diagnosis: demographic factors and
social support. Journal of Advanced Nursing, 2005. 51(3): p. 217-226.
19. Weng, M.J., et al., The feasibility of low-dose CT for pulmonary metastasis in patients with primary gynecologic malignancy. Clin Imaging, 2004. 28(6): p. 408-14.
20. Gergely, I., et al., Lung nodule detection with ultra-low-dose CT in routine follow-up of cancer patients. Rofo, 2005. 177(8): p. 1077-83.
21. Hara, A.K., et al., Iterative reconstruction technique for reducing body radiation dose at CT: feasibility study. AJR Am J Roentgenol, 2009. 193(3): p. 764-71.
22. Yamada, Y., et al., Dose reduction in chest CT: comparison of the adaptive iterative dose reduction 3D, adaptive iterative dose reduction, and filtered back projection reconstruction techniques. Eur J Radiol, 2012. 81(12): p. 4185-95.
23. Pontana, F., et al., Chest computed tomography using iterative reconstruction vs filtered back projection (Part 2): image quality of low-dose CT examinations in 80 patients. European Radiology, 2011. 21(3): p. 636-643.
25. Huber, A., et al., Performance of ultralow-dose CT with iterative reconstruction in lung cancer screening: limiting radiation exposure to the equivalent of conventional chest X-ray imaging. Eur Radiol, 2016. 26(10): p. 3643-52.
26. Lung Cancer screening CT Protocols. [cited 2016 08-08-2016]; Available from:
http://www.aapm.org/pubs/CTProtocols/documents/LungCancerScreeningCT.pdf.
27. Aberle, D.R., et al., Reduced lung-cancer mortality with low-dose computed tomographic screening. N Engl J Med, 2011. 365(5): p. 395-409.
28. Church, T.R., et al., Results of initial low-dose computed tomographic screening for lung cancer. N Engl J Med, 2013. 368(21): p. 1980-91.
29. Horeweg, N., et al., Lung cancer probability in patients with CT-detected pulmonary nodules: a prespecified analysis of data from the NELSON trial of low-dose CT screening. Lancet Oncol, 2014. 15(12): p. 1332-41. 30. Messerli, M., et al., Computer-aided detection (CAD) of solid pulmonary nodules in chest x-ray equivalent
ultralow dose chest CT - first in-vivo results at dose levels of 0.13 mSv. European Journal of Radiology, 2016. 85(12): p. 2217-2224.
31. Hsieh, J., Computed Tomography Principles, Design, Artifacts, and Recent Advances. Second Edition. 2009: Wiley.
32. Hall, E.J., Lessons we have learned from our children: cancer risks from diagnostic radiology. Pediatric Radiology, 2002. 32(10): p. 700-706.
33. Toshiba, Toshiba America Medical Systems. [cited 2016 10-12-2016]; Available from:
http://www.medical.thoshiba.com/products/computed-tomograpy/aquilion-one-family/.
34. Smith, N.B. and A. Webb, Introduction to Medical Imaging: Physics. Engineering and Clinical Applications 2011, United States of America: Cambridge university press.
35. Kalender, W.A., Computed Tomography, Fundamentals, System Technology, Image Quality, Applications. Second ed. 2005, Erlangen: Publicis Corporate Publishing. 1-304.
36. Callister, M.E., et al., British Thoracic Society guidelines for the investigation and management of pulmonary nodules. Thorax, 2015. 70 Suppl 2: p. ii1-ii54.
37. Webb, W.R. and C.B. Higgings, Thoracic Imaging: Pulmonary and Cardiovascular Radiology. 2nd ed. 2011, Philadelphia: Lippincott Williams & Wilkins.
38. Toyoda, Y., et al., Sensitivity and specificity of lung cancer screening using chest low-dose computed tomography. Br J Cancer, 2008. 98(10): p. 1602-7.
39. Yoon, H.J., et al., Adaptive Statistical Iterative Reconstruction-Applied Ultra-Low-Dose CT with Radiography-Comparable Radiation Dose: Usefulness for Lung Nodule Detection. Korean J Radiol, 2015. 16(5): p. 1132-41.
40. Ebner, L., et al., Lung Nodule Detection by Microdose CT Versus Chest Radiography (Standard and
Dual-Energy Subtracted). American Journal of Roentgenology, 2015. 204(4): p. 727-735.
41. Marin, D., et al., Low-tube-voltage, high-tube-current multidetector abdominal CT: improved image quality and decreased radiation dose with adaptive statistical iterative reconstruction algorithm--initial clinical experience. Radiology, 2010. 254(1): p. 145-53.
42. Singh, S., et al., Abdominal CT: comparison of adaptive statistical iterative and filtered back projection reconstruction techniques. Radiology, 2010. 257(2): p. 373-83.
43. Li, K., et al., Statistical model based iterative reconstruction (MBIR) in clinical CT systems. Part II. Experimental assessment of spatial resolution performance. Med Phys, 2014. 41(7): p. 071911.
44. Bittencourt, M.S., et al., Iterative reconstruction in image space (IRIS) in cardiac computed tomography: initial experience. Int J Cardiovasc Imaging, 2011. 27(7): p. 1081-7.
45. Schindera, S.T., et al., Iterative reconstruction algorithm for abdominal multidetector CT at different tube voltages: assessment of diagnostic accuracy, image quality, and radiation dose in a phantom study. Radiology, 2011. 260(2): p. 454-62.
46. Winklehner, A., et al., Raw data-based iterative reconstruction in body CTA: evaluation of radiation dose saving potential. Eur Radiol, 2011. 21(12): p. 2521-6.
47. Moscariello, A., et al., Coronary CT angiography: image quality, diagnostic accuracy, and potential for radiation dose reduction using a novel iterative image reconstruction technique-comparison with traditional filtered back projection. Eur Radiol, 2011. 21(10): p. 2130-8.
48. Funama, Y., et al., Combination of a low-tube-voltage technique with hybrid iterative reconstruction (iDose)
algorithm at coronary computed tomographic angiography. J Comput Assist Tomogr, 2011. 35(4): p. 480-5.
50. Laqmani, A., et al., Comparison of image quality and visibility of normal and abnormal findings at
submillisievert chest CT using filtered back projection, iterative model reconstruction (IMR) and iDose4. Eur J Radiol, 2016. 85(11): p. 1971-1979.
51. Gervaise, A., et al., CT image quality improvement using Adaptive Iterative Dose Reduction with wide-volume acquisition on 320-detector CT. Eur Radiol, 2012. 22(2): p. 295-301.
52. The Alliance for quality computed tomography. [cited 2016 08-08-2016]; Available from:
http://www.aapm.org/pubs/CTProtocols/.