A Thesis Submitted for the Degree of PhD at the University of Warwick
http://go.warwick.ac.uk/wrap/1935
This thesis is made available online and is protected by original copyright.
Please scroll down to view the document itself.
From triangles to a concept: a phenomenographic study of
A-level students’ development of the concept of
trigonometry.
By Michele Challenger
Submitted for the degree of PhD
University of Warwick
Department of Education
This study is dedicated to the late Jim Pattison, an exemplary
mathematics teacher universally respected by both his
Contents
List of Tables...
List of Figures...
Acknowledgements...
Declaration...
Abstract...
Chapter 1: Overview of The Study…………...
Chapter 2: The Development of A-level Mathematics...
2.1 Introduction……… 2.2 A-level Mathematics………....
2.2.1 The 1950’s, 1960’s and 1970’s ... 2.2.2. The 1980’s... 2.2.2.1 Changes to pre-16 secondary education... 2.2.2.2 Changes to A-level mathematics... 2.2.3 The 1990’s...
2.3 Problems for Higher Education ………... 2.4 Grade Inflation ………. 2.5 Decline in the Student Uptake of A-level Mathematics; the Crisis in
2.15 Change of Teacher Profile ……….. 2.16 University Entrance Tests ……….. 2.17 Trigonometry at AS/A2 Level ……….
2.17.1 Trigonometric content in the A-level syllabus from 2005...
2.18 Summary ……….
Chapter 3: Research Literature...
3.1 Introduction………
3.1.1 Constructivism... 3.1.2 Understanding Understanding... 3.1.3 Schemas... 3.1.4 Reification... 3.1.5 A Theory of Encapsulation... 3.1.6 Procepts... 3.1.7 Network Theories...
3.2. 1 Visual representations………...
3.2.2 Visualisation Theory... 3.2.3 The Role of Visualisation... 3.2.4 Types of Imagery... 3.2.5 Concept Image... 3.2.6 Imagery in Trigonometry...
3.3.1 Research in Trigonometry……….
3.3.2 Trigonometry and the Pedagogic use of Computer Graphics... 3.3.3 The Promotion of Trigonometric Functions as Procepts... 3.3.4 The Role of Visual Images... 3.3.5 What You Get Is What You Teach...
3.4 The Importance of Cultural Perceptions………..
3.4.1 The Role of Teachers In The Understanding of Function... 3.4.2 The Change of Focus and Delivery at Advanced Mathematics...
3.5 Summary……….
Chapter 4: Research Design and Methods………..
4.1 Introduction……… 4.2 Research Questions……… 4.3 The Phenomenographic Approach……….
4.3.1 Referential and Structural Components of a Phenomenon...
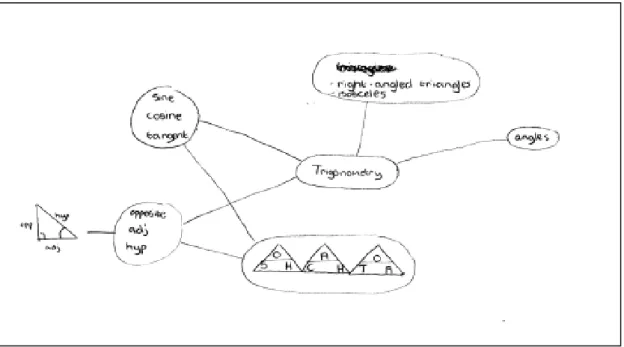
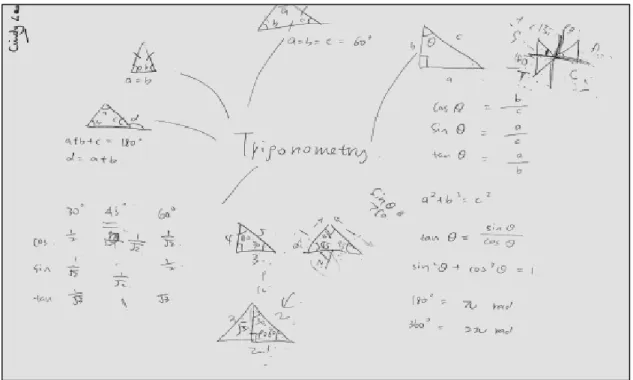
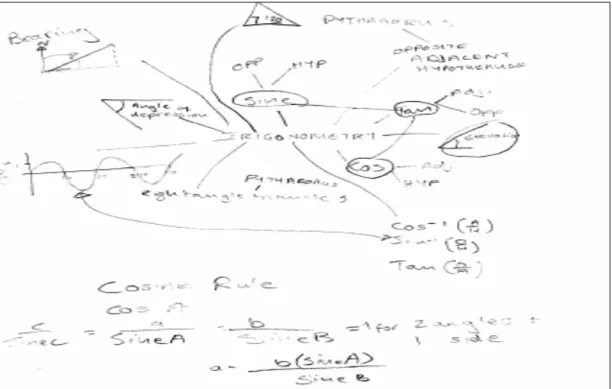
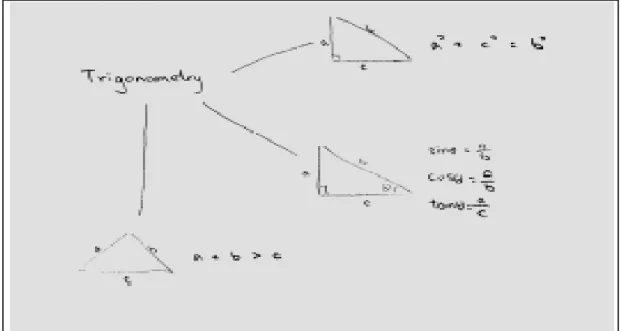
4.5.1 Teacher expectations of student performance and lesson structure... 4.5.2 The Concept Maps... 4.5.3 Interviews... 4.5.4 Classroom Observation... 4.5.5 Analysis of student reinforcement/consolidation material... 4.5.6 Informal teacher interview...
4.6 Data Analysis……… 4.7 Issues of Reliability in Phenomenographic Research………... 4.8 Validity………. 4.9 Ethics………... 4.10 The Research Schedule………... 4.11 Limitations of Study……….. 4.12 Conclusion………...
Chapter 5: Pilot Study……….………..
5.1 Introduction……… 5.2 Research Instruments……….
5.2.1 Concept Maps... 5.2.2 Lesson Observations... 5.2.3 Task Questions...
5.3 Pilot Study: Sample Details………...
5.3.1 Administrative Issues... 5.3.2 The School... 5.3.3 The Students... 5.3.4 The Teacher... 5.3.5 Lesson Format...
5.4 Outcomes of Pilot Study………
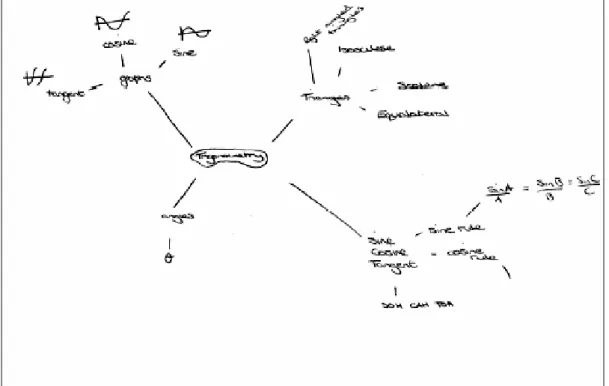
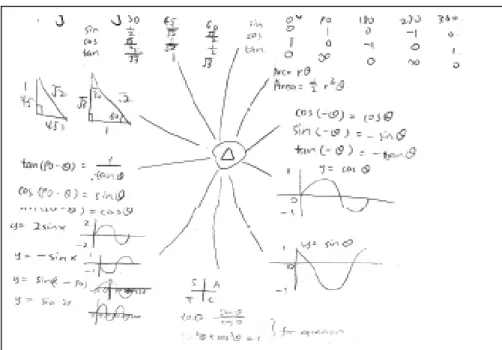
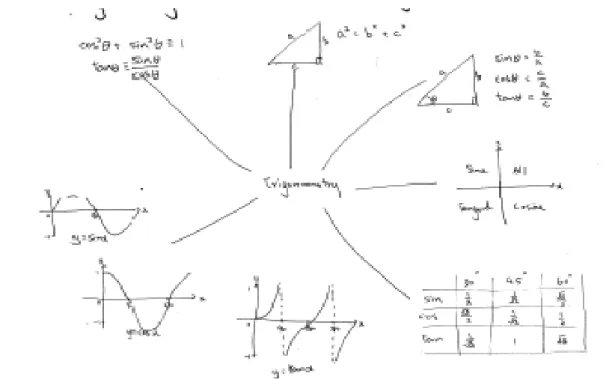
5.4.1 Initial Concept Maps...
5.5 Lesson Content and Delivery……… 5.6 Teacher Emphasis in Delivery………..
5.6.1 Teaching Objective... 5.6.2 Clarifications Leads to Confusion... 5.6.3 Issues with Language... 5.6.4 Teacher’s Emphasis on Remembering...
5.7 The Students Development of Trigonometry………
5.7.1 Task Questions...
5.9 Assessment at the End of the Component……… 5.10 Conclusions and Refinements………
Chapter 6: Main Study: Students Initial Knowledge……….
6.1 Introductory Remarks……… 6.2.1 The Initial Concept Maps………
6.2.2 Summary...
6.3 Students’ Ability to Handle Pre-requisite Skills……….. 6.4 Students’ Interpretations of the Representations………...
6.4.1 Interpretation of Sin, Cos and Tan... 6.4.2 Interpretation of Spatial Images...
6.5 Investigation of Ideas of Function………...
6.5.1 Interpretation of Inverse Function... 6.5.2 Function Links...
6.6 Students Knowledge and Skills as a Foundation for the AS/A2 Course in Trigonometry……….
Chapter 7: Teacher Delivery of Content and Instructional Outcomes……
7.1 Introduction……… 7.2 The Teacher……… 7.3 The Course………. 7.4 Lesson Format……….. 7.5 Teaching Style Introduction………..
7.5.1 Connections Between the Representations... 7.5.2 Utilising the Power of Visual Representations... 7.5.2.1 Encouraging Student’s Visual Thinking... 7.5.3 The Infinite Nature of the Sin, Cos and Tan Functions are Emphasised... 7.5.4 Operational Processes are Subsumed within Conceptual Connections... 7.5.5 The Precise use of Language... 7.5.6 Using Tasks to Encourage Students’ Flexibility of Thinking...
7.6 Summary of Section……… 7.7 Instructional Outcomes After C2………
7.7.1 Students Skill with Radians... 7.7.2 Students Knowledge of the Special Angle Triangles... 7.7.3 Students ability to Connect Graphical Images to Different Algebraic
7.7.6 The Second Concept Maps... 7.7.7 Feedback on Concept Map Issues...
7.8 AS Results and S4 Drops Out………... 7.9 Responses to Integrated Questions………...…
7.9.1 Students Understanding of Composite Trigonometric Functions and Use of Visual Imagery... 7.9.2 Qualitative Differences in Students’ Solution Process... 7.9.3 Students’ Ability to Think Flexibly...
7.10 Third Concept Maps………..
7.10.1 Observations of Third Concept Maps... 7.10.2 Evidence of Concept Images...
7.11 A-level Mathematics Results……….. 7.12 Summary………
Chapter 8: Students Perceptions of Their Learning………
8.1 Introduction……… 8.2 Student Perception of the Difference Between GCSE Trigonometry and A-level Trigonometry………..
8.2.1 The Shift of Focus from Triangles... 8.2.2 The Perception That it is More Difficult...
8.3 Student Comments on Learning for Assessment
8.3.1 The Influence of the Syllabus on Learning... 8.3.2 The Impact of Regular Assessments... 8.3.3 Different Teaching Styles Identified... 8.3.4 Different Learning Styles Identified...
8.4 Summary……….
Chapter 9: Analysis………
9.1 Introduction……… 9.2 What Opportunities were Presented for Students to Interiorise and
Personally Condense Sub-Concepts?
9.2.1 Emphasis of Sub-Concepts... 9.2.2 Links... 9.2.3 Operational versus Conceptual Thinking... 9.2.4 Direct Equivalence... 9.2.5 Accuracy of Answers... 9.2.6 Encouragement of Creative Thinking...
9.3.2 Structure...
9.4 Is There Any Evidence that Students are Linking Together Different Sub-Concepts?... 9.5 Is there any Evidence of Students Being Able to Curtail a Procedure or Change from One Representation to Another? ……… 9.6 Is There any Evidence that Students Can De-Encapsulate Concept Images? 9.7 To What Extent do Students Think Their own Perceptions of Trigonometry have Changed Since the Start of the Course?... 9.8 What are Students Own Perceptions of Their Learning Experience?... 9.9 Reflections on the Theoretical Frameworks………
9.9.1 The APOS Framework as a Description of Development in Trigonometry... 9.9.2 Sfard’s 3-step Framework as a Description of Development in Trigonometry... 9.9.3 Network Theory as a Description of Development in Trigonometry...
Page
Figure 3.1: Complementary Representations of Sine θ……….43
Figure 5.1: P1’s Concept Map 1………... 82
Figure 5.2: Diagram of Triangle to Identify Sin of an Angle ……….………. …..83
Figure 5.3: P2’s Concept Map 1……….……...84
Figure 5.4: P3’s Concept Map 1………85
Figure 5.5: P3’s Triangle to Demonstrate Sin θ………..86
Figure 5.6: P4’s Concept Map 1………87
Figure 5.7: P5’s Concept Map 1……….…...88
Figure 5.8: P6’s First Concept Map………...89
Figure 5.9: Table of Tan φ (the acute angle) in the 4 Quadrants……….98
Figure 5.10: Summary of the Nature of Sin, Cos and Tan in the 4 Quadrants……….98
Figure 5.11: Diagram for Mnemonic ASTC………98
Figure 5.12: Question 1………...101
Figure 5.13: Question 2 ………..………102
Figure 5.14: P1’s Concept Map 2...……...104
Figure 5.15: P2’s Second Concept Map ……….………...105
Figure 5.16: P4’s Second Concept Map………...107
Figure 5.17: P3’s Second Concept Map………...107
Figure 5.18: P5’s Second Concept Map………...109
Figure 6.1: S1’s Concept Map 1 ……… 117
Figure 6.2: S2’s Concept Map 1 …….………...118
Figure 6.3: S3’s Concept Map 1 ………… ………119
Figure 6.4: S4’s Concept Map 1 ……….……….. ….120
Figure 6.5: Question 1...122
Figure 6.6 Question 2 ………..122
Figure 7.1: Spatial Representation of Tan θ=sin θ/Cos………...138
Figure 7.2: Diagram Indicating when Sin, Cos & Tan are Positive or Negative………..138
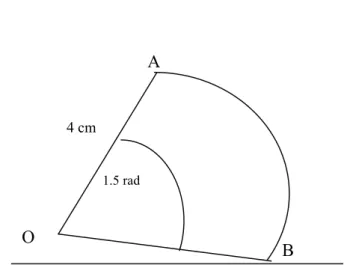
Figure 7.3: Diagram of Circle Sector………..144
Figure 7.4: Diagrams of the Special Angle Triangles………...145
Figure 7.5: S1’s Concept Map 2………..149
Figure 7.6: S2’s Concept Map 2………..150
Figure 7.9: Spatial Imagery Used by S1……….157
Figure 7.10: S1’s Concept Map 3………..163
Figure 7.11 S2’s Concept Map 3………..…164
Figure 7.12: S3’s Concept Map 3………..164
Figure 7.13: S6’s Concept Map 1………..167
Figure 7.14: S6’s Third Concept Map………...167
Figure 7.15: S7’s First Concept Map……….168
Figure 7.16: S7’s Third Concept Map………...169
Figure 7.17: S8’s First Concept Map……….170
Figure 7.18: S8’s Third Concept Map………...170
Figure 9.1: S3’s Second Concept Map Drawn After C2………..193
Figure 9.2: S1’s Answer to Finding the Co-ordinates of the y-intercept for the Given Function……….196
Figure 9.3: S2’s Third Concept Map ………...197
Figure 9.4: S3’s Third Concept Map ………...…...197
Figure 9.5: P1’s Second Map ………..……197
Figure 9.6: Representations of Schema Development ………...208
List of Tables
Page
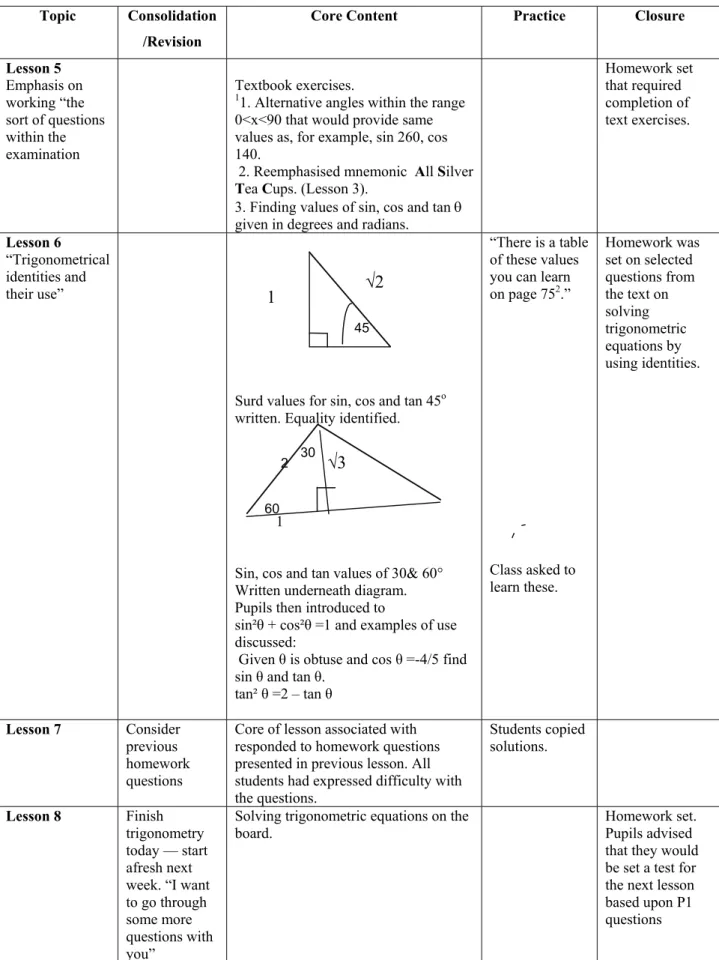
Table 5.1: Individual Lessons of the Y12 Trigonometry Course……… 91/92
Table 5.2: Pilots Group’s AS Mathematics Results ………...112
Table 6.1: Items of Content in First Concept Map………. 117
Table 7.1: Lesson Timetable for AS and A2 Trigonometry Course ……... ..137
Table 7.3: S2’s Concept Map Content ……….………152
Table 7.4: S3’s Concept Map Content……… ……….153
Table 7.5: S4’s Concept Map Content ……….…153
Table 7.6: AS Results ……… 155
Table 7.8: S2’s Concept Map Content ……… …165
Table 7.9: S3’s Concept Map Content ……….166
During the completion of this thesis I received enormous support and help from many people. My first thanks go to Dr. Eddie Gray, an excellent supervisor, for his guidance, encouragement, patience and friendship throughout my PhD study. His intellectual input and rigour provided both the stimulus to undertake the study and the motivation to complete it. I have nothing but the highest regard for him as a supervisor and as a person.
I am grateful to the mathematics department at the school were this study was undertaken, and in particular for the cooperation from the teachers during the data collection process. Both teachers were tremendously accommodating through out the three years that these observations took place. Tragically the main study teacher Jim Pattison, an excellent teacher and lovely man, died during the summer holidays that followed these observations and thus he never saw the result of his generous, good natured cooperation into a piece of research that was of great interest to him. His death is a sad loss to the school and its students. This study is dedicated to him. Thanks also to the students who voluntarily agreed to take part in the research. Their honesty, generosity with their time and patience during the interviews and supervised questions is greatly appreciated.
I, the author, declare that this thesis is my own work and has not been submitted for
a degree at any other institution.
This thesis describes an investigation of the trigonometry schemas developed by a group of 16-18 year old English students during their study of A-level mathematics. It is concerned with identifying differences in the schemas of students who are successful with solving trigonometric problems to those who are less successful.
The study is guided by the theoretical frameworks of mathematical schema development proposed by Sfard (1991) and Dubinsky’s (1991) APOS theory that describe how operational knowledge of one or more procedures develops into an understanding that is conceptual. The benefits of a conceptual understanding are greater flexibility in problem solving and greater cognitive economy. The study of trigonometry prior to starting the A-level course is predominantly concerned with problems relating to triangles either right-angled or scalene and it is during the A-level course that trigonometry broadens into the study of the properties of function. Experience as a mathematics tutor suggests however that not all students finish the A-level course with a conceptual understanding of trigonometric functions that is a coherent entity. Some students have little more than a collection of arbitrary facts and procedures that they struggle to use cohesively. Traditionally trigonometry is taught by mediating the core ideas through a mixture of spatial-visual images and algebraic identities that together provide the basis for function properties and behaviour. This study examines student perceptions of these mediating representations through a phenomenological investigation based on concept maps, interviews, classroom observations and observed problem-solving by selected students.
Chapter 1 Overview of the Study
This thesis is focused on the trigonometric schemas that a group of English students in years 12 and 13 developed during their study of AS/A2 mathematics. This study seeks to discover how the understanding of trigonometry is transformed into a concept of trigonometric functions by a group of students studying A-level mathematics. The perspective taken is that knowledge is an individual’s construction and thus the focus of the study is the cognitive organisation of new information by students into a coherent structure of links, axioms and procedures that together form an abstract concept of trigonometric function.
The study is concerned with the qualitative nature of these students’ individual schemas and with identifying differences in their understanding of the syllabus material and the consequential effects of these differences, if any, in assessments. [§1.2]
The development of A-level mathematics since its inception has seen a change in purpose, content, format and assessment procedure. Initially its purpose was to provide a route to the study of mathematics-based courses at university. The syllabus was determined by Higher Education Institutions and the examinations were set and assessed under their control. The grades awarded to students reflected their achievement in comparison to that of the other students, in that year’s cohort.
the changes that a variety of studies and reports have recommended that this study seeks to consider student understanding and perception of one part of the syllabus, trigonometry, in the context of the quality of their learning and the students’ perception of what it is they should focus upon.
Of central importance in this context is Curriculum 2000 [§2.9] which partitioned the A-level into two one-year courses: the first year was now classified as the AS course and the second year the A2 course [§2.10].
Trigonometry is usually introduced to year 9 students and then returned to in years 10 and 11. It involves learning the ratios of sin, cos and tan and a complex coordination between diagrams of right angled triangles and algebraic manipulation of the ratios in order to find required lengths or angles. For those doing the Higher papers at GCSE the subject is broadened to include the sine rule and cosine rule and the values of sin, cos and tan for angles in the range 0 to 360 degrees. Skemp [§3.1.2] theorised that there are two types of mathematical understanding: instrumental which is knowledge of a procedure or a set of procedures; and relational understanding which is knowledge of why instrumental procedures are appropriate, their limitations and alternatives. The sine rule and cosine rule are formulae that are used instrumentally to find required lengths or angles of scalene triangles. The graphs, which, to an expert, describe the nature of the sin, cos and tan function between 0 and 360 degrees and by extension from negative infinity to positive infinity, are in my experience frequently conceived by students as an instrumental means to a solution rather than a representation of the function. This experience leads me to surmise that at the end of the GCSE course the majority of the students who have studied trigonometry under the National Curriculum have a predominantly instrumental understanding of trigonometry. The development of students’ understanding of trigonometry from a set of procedures to an entity that has a multiplicity of representations both algebraic (as in the identities) and spatial therefore takes place (if at all) during the study of the A-level course. This study set out to observe this transformation in the light of two theoretical frameworks for mathematical development proposed by Sfard (1991) and Dubinsky (1991) respectively.
properties, algebraic and spatial representations simultaneously) through interiorisation, condensation and reification. A process or representation is interiorised by an individual then condensed mentally. Reification is a cognitive reorganisation that enables the individual to link the process to other facts and processes creating an object conception. This static object helps inform decisions on suitable procedures for subsequent problem solving and is itself informed by new processes and representations thus a duality of understanding is constructed with the operational feeding the reified object which in turn feeds operational know how. Sfard states that reification is not an automatic development and some students never move from an operational understanding to the mental object construction but when it does happen the result is greater cognitive flexibility and efficiency.
The APOS theory [§3.1.5] first proposed by Dubinsky (1991) is an acronym for the words Action-Process-Object-Schema. An Action is a physical action that includes application of a procedure or use of a known fact to facilitate an answer. A Process
denotes recognition of an Action as having a beginning and an end and the individual is in conscious control of each step able to reverse the procedure if required or an use alternative procedure or known fact. An Object conception the result of the encapsulation of a process and is recognisable by the individual’s use of one process upon another. For example once the graph of sin x is encapsulated transformations such as stretches and translations may be applied to it. A Schema is the sum of all the encapsulated objects that link together.
trigonometry are numerous and include the terms sine, cosine and tangent. In order to determine the nature of a students’ trigonometry schema therefore it is necessary to understand the meaning given by the student to the terms and sub-concepts in common discourse. The main ideas of trigonometry are mediated through a mixture of algebraic representations such as ratios and formulae, and geometric representations such as triangles, circles and graphs. The use of imagery is ubiquitous by students and teachers however spatial images have been found to have a qualitative dimension (Gray, Pinto, Pitta & Tall, 1999) which requires investigation. The research literature that documents the extent to which spatial visual imagery increases mental flexibility by providing a complementary representation is described and the observations of other documented research on the study of trigonometry are also noted.
The focus of this study was the observation of students' development in understanding trigonometry and whether there is empirical evidence to support the theoretical frameworks. In particular it was designed to investigate changes in students perceptions of trigonometry, the development (or not) of a flexible schema [§3.1.3] the means by which this was promoted and whether key stages of development can be identified. The ultimate aim is for a more informed and beneficial teaching strategy.
Students who study mathematics at AS/A-level have to have done well at the higher GCSE paper, usually getting at least an A grade, and like the subject enough to want to choose to study it further. So it is reasonable to assume that at the beginning of the course all the students are not only good at mathematics but also optimistic about their future prospects.
"I find it easy to remember it"
"I usually do well at it in exams"
"I find it easier than the other subjects; you just have to learn it"
However, as the A-level course progresses many of these students are completely at a loss with trigonometry in particular. Their confusion leads to a diffidence that further incapacitates them as evidenced by comments such as:
"Are we talking about triangle trigonometry or circle trigonometry here?"
"I used to understand it when it was just triangles but now I don't know where to start".
Such comments contrast starkly with comments from other students such as:
"In the beginning I hated trigonometry but now I really like it"
"It was weird at first having to label opposite, adjacent and hypotenuse on all the triangles but at A-level you spend a lot of time on it and it starts
to make sense - I love solving trig equations now".
This observed phenomenon led me to enquire about the experiences of other teachers of A-level trigonometry. Here are some of their comments:
“Students find trigonometry one of the hardest subjects on the A-level. They have difficulty with it as it becomes more abstract”
“Trigonometry at A-level is the topic that sorts the sheep from the goats. It is a good indicator of true mathematical ability and if they can master it then it indicates that they have the potential to become a real mathematician.”
students (and some teachers) struggle with is one that is acknowledged by others in the teaching profession.
This then is an exploratory study with two central themes:
How do A-level students develop their understanding of trigonometry? What distinguishes the thinking of more able students from the less able?
Can we as educators gain any insight into the sorts of cognitive constructions that are more beneficial?
To gain an insight into the meaning of trigonometry to students and any change in meaning over time it was decided to frame this study on phenomological principles [§4.3]. The aim of the study was to investigate differences in the perception of trigonometry between students in the group and longitudinally between the start and the end of the course for a set of selected students. The means for the investigation was primarily students’ concept maps [§4.5.2] drawn freely without teacher or observer intervention or suggestion at the start of the course and at the end of each session of lessons on a trigonometry component of the syllabus. The analysis of the concept maps was supported by informal student interviews [§4.5.3], lesson observations [§4.5.4], observations of students as they attempted routine and later, integrated questions [§7.9.2] and assessment results [§7.11].
was asked to indicate students that he thought were at the top, middle and bottom end of the ability range within the group. 4 students were then chosen from his selection one from the top, one from the bottom and two randomly selected from the middle range. The teaching style of the pilot study teacher and the main study teacher differed considerably. The pilot study teacher focussed strongly on the forthcoming assessment and frequently urged the students to remember significant images or results [§5.6]. He confessed a preference for algebraic processes over geometric ones. The main study teacher stated that he considered trigonometry to be essentially a geometric subject and frequently linked algebraic representations to spatial representations during the course of his exposition [§7.5]. This difference had a significant impact on the resultant schemas of their students. The four students selected at the start of the main study were closely observed and asked to answer integrated questions talking through their thinking as they did so [§7.9]. The student identified as coming from the bottom of the ability range dropped mathematics after one year and there is a section on his reflections of the course [§7.8]. The research found evidence to support the theoretical frameworks of a difference in meaning assigned to terms such as sine, cosine and tangent as described by Gray and Tall (1994). It also found evidence that one group of students remained focused on processes whilst another was starting to build a cognitive construct of related images, formulae and procedures which gave them greater mental flexibility when problem solving [§7.9.3]. In addition there was evidence that those students who always used algebraic representations of sub-concept were at a disadvantage to those who could switch easily between algebraic and geometric representations. The research found that there was a qualitative difference in students own spatial visual representations and the quality of the spatial visual imagery [§7.9.1] provided good indications of differences in schema between the students [§7.9.2]. The indications of these differences of schema were provided by the concept maps [§7.10] and supported by the students’ attempts at the integrated questions and their assessment results [§7.11].
that the pattern of the course required two types of learning: one for assessment and one for depth. The more successful students identified the teacher’s pedagogic style as the most significant factor in their understanding and problem solving capabilities [§8.3.3].
Chapter 9 analyses the differences in students’ schemas and the specific influences of the teacher in their development. Different trends of schema development are identified and these appear to have an influence on problem-solving and assessment results. Those students whose schema alternated flexibly between algebraic and geometric representations had an advantage over those who focused exclusively on algebraic representations and processes. Students who focused predominantly on geometric representations also had an advantage over those who focused on algebraic processes. The key features of the teacher’s pedagogic delivery and the effect this has on his students’ understanding is shown. This study found that students were dependent on the teacher for the opportunity to interiorise sub-concepts and hence network them into a cohesive structural Object construction. They were also dependent on the teacher for clarity of meaning for the vocabulary commonly used in classroom discourse and for experience of problems that tested their understanding and problem solving techniques with respect to economy.
Chapter 2
The Development of A-level Mathematics
2.1 Introduction
This chapter starts with a brief outline of the history of A-level mathematics in England and attempts to describe the changes that have taken place in both its content and its format, [§2.2]. During the 1980’s Education reform became one of the key areas on the political agenda of the Conservative government and radical reforms of the secondary education system for both pre-16 students [§ 2.2.2.1] and 16-18 year olds [§ 2.2.2.2] within England and Wales were introduced. During the 1990’s the pace of change quickened [§2.2.3] but reports from the mathematics community expressing deep concern about the ill preparation of A-level students for degree courses [§2.3] and the perception that standards of assessment were declining [§2.4]. In addition the poor take up of mathematics and science courses by students and the decline in the number of specialist mathematics teachers was regarded as very serious [§2.5]. As the situation continued there was open acknowledgement of a ‘Crisis in Mathematics’ and the first of a series of independent consultations under Sir Ron Dearing was held to review the A-level curriculum [§2.6]. In 1997 the Labour party were elected into government with the pledge that education reform would be their first priority. In the decade between 1997 and 2007 there were 11 new Education Acts passed through government which cumulatively transformed the structure of education in general and A-level mathematics in particular. The most radical of these was Curriculum 2000 [§2.9] which partitioned the A-level into two one-year courses: the first year was now classified as the AS course and the second year the A2 course [§2.10].
2.2 A- level Mathematics.
The content and format of the A-level underwent little change during the 1960’s and 1970’s although the change that did take place was to have significant ramifications for Institutions of Higher Education.
2.2.1 The 1950’s, 1960’s and 1970’s.
added for the top performers called Distinction. In 1963, due to pressure from higher education institutions who claimed that grades were too broad, a norm- referenced grading system was introduced for grades A to E. This meant that the assignment of a particular grade for assessment was not awarded on the student having attained a specified mark but on how he or she compared with the other students of that years cohort. So the top 10% were credited a grade A, the next 15% a grade B etc regardless of the marks obtained.
The A-level syllabus, set by the universities and used by them as an entrance exam, was tailored to their needs [Savage, Kitchen, Sutherland & Porkiss, (2007), Gordon (2005) Sutherland & Pozzi (1995) etc]. The syllabus consisted of mainly Pure Mathematics and Mechanics. Its assessment consisted of two 3-hour examination papers taken at the end of a 2 year course. In the mid 1970’s Statistics became an alternative option of study to Mechanics: Statistics and Mechanics, henceforth termed the ‘Applied component of A-level’ were allocated approximately 50% study time. Kitchen et al (2007) say that Universities were able to cope with the variation in students Applied background because:
“Pure Mathematics remained solid and students continued to be generally well prepared with regard to study skills, problem solving skills and basic mathematical capabilities” (p2)
However because students with A-level mathematics applying to study mathematics at university did not necessarily have mechanics, some universities (Warwick, Newcastle etc) introduced additional support in mechanics and diagnostic testing.
2.2.2 The 1980’s
2.2.2.1 Changes to Pre-16 Secondary Education.
The National Curriculum was introduced into English schools in 1988 for students up to the age of 16 years and the General Certificate of Education (GCE) Ordinary level (O-level), originally designed for Grammar school students, was combined with the less academic Certificate of School Education (CSE) course and was henceforth to be called the GCSE. The assessment was designed to take into account all abilities by having 9 grades of achievement awarded (A* to G) instead of the previous 6 (A-E or 1-6 according to the awarding university body) for the O-level and 6 for the CSE. Candidates would study the mathematics GCSE at one of three levels: Higher, Intermediate or Foundation according to ability. The Higher papers provided for grades A*, A, B, C or U (Ungraded). The Intermediate papers provided for grades B, C, D, E and U and the Foundation papers provided for grades D, E, F and G. This meant that unlike other subjects those students studying GCSE at Foundation level had no possibility of gaining a C grade, which became widely regarded as a pass in the workplace and the outside world [§2.14] making it difficult for teachers to motivate the students taking this tier.
Traditionally O-level Additional Mathematics had been viewed by schools as a necessary preparation for most students intending to study the General Certificate of Education at Advanced level (A-level) mathematics. In the new National Curriculum Additional Mathematics, which had included the study of calculus from first principles, logarithm theory, the factor theorem and other algebraic techniques and trigonometry for angles in radians, was abolished. The knowledge and skills necessary to be awarded the new A and A* (“A star”, the maximum grade available) grades were now regarded as sufficient preparation for post-16 A-level study. Many teachers contested this claim and Sutherland and Pozzi (1995) compared the syllabuses of 1993 mathematics GCSE with those of 1983 O-level courses. They found that there had been an overall reduction in content in the move from O-level to GCSE and that this was particularly marked in the areas of trigonometry and algebra.
2.2.2.2 Changes to A-level Mathematics.
enable higher education and employers to have an idea of the scope and content of Advanced level studies [Easingwood, 1997]
In 1984, the Secondary Examinations Council advised that grade boundaries should be based on the partition of the mark scale rather than on proportions of candidates, in a move towards a criterion-referenced system. This meant that whereas previously the top 10% of students were awarded a grade A regardless of their actual examination mark the new system would award all students who achieved above a specified percentage an A grade. Examiner judgment was to be the basis for the award of grades B and E, with the remaining grades determined by dividing the mark range between these two points into equal intervals. This system was introduced in 1987 and remained in force until the introduction of the new curriculum in 2000 [§2.9].
From the mid 1980’s there were increasing concerns about the steady decline in the number of students choosing to take A-level mathematics [§2.5] and the root problem was thought to be the A-level’s traditional aim to be the foundation of Higher Education study of mathematics or mathematics-based courses such as engineering, computer studies or the sciences. The problem that resulted from this aim was that the content of the syllabus was considered too narrowly defined and was thus unappealing to students who might otherwise have chosen to study mathematics at A-level. In response to this the A-level was re-focused to be the final, and most advanced part, of the study of mathematics in school as well as an entrance examination for the universities. The main thrust of this argument as indicated by Reid (1991) was that policies on access for 16+ year olds should not be dictated by the ideals of Higher Education Institutions and England and Wales but must follow other countries in treating this stage of education as an integral part of the system as a whole and apply rules for transfer to university which are in the interests of all parties and not just teachers in Higher Education [§ 2.13].
New modular syllabuses were designed and trialled. In 1989 the Advanced Subsidiary (AS) level GCE was first examined. It was designed to have restricted content i.e. not all the A-level topics would be included but this content would be studied to the same depth as those studying the full A-level, a vertical structure. This gave the Higher Education Institutions a problem determining how much the new AS was worth. Clearly it was worth more than a GCSE and less than a full A-level but its true value was unclear. The new AS also gave schools and colleges a problem in that separate classes, in addition to the A-level mathematics classes, had to be run to accommodate it. This put extra pressure on teaching resources and classroom accommodation.
2.2.3 The 1990’s.
In 1993 the mathematics core was rewritten to accommodate the new AS. The syllabuses based on this reconfigured core were examined for the first time in 1996. However reports and research studies started to be published that signalled two particular problems. The first was the increasing perception from Higher Education tutors that students with A-level mathematics, even those with the best grades, had unsatisfactory knowledge or understanding of the subject. The second was the worrying decline in the uptake of A-level mathematics; a phenomenon which became known as ‘The Crisis in Maths’.
2.3 Problems for Higher Education
At the same time, the report states, the proportion of the A-level cohort who had opted for mathematics, science and engineering over the past decade was in decline and Higher Education departments were having difficulty recruiting sufficient numbers of students to fill the increase in spaces created by the expansion of the Higher Education sector. [§ 2.5 and §2.8]
The same year Sutherland & Pozzi (1995) published The Changing Mathematical Background of Engineers which stated that students were now being accepted on engineering degree courses with relatively low mathematics qualifications in comparison with ten years previously and, they also claimed
,
too many graduate engineers were perceived to be deficient in mathematical concepts and fluency. The report also highlighted the many pressures to reduce and simplify the mathematical content.In 1996 Reynolds & Farrell published the book Worlds apart which was a review of international surveys of educational achievement involving England in which they described a crisis in maths under English State Education. Also that year The Standing Conference on School Science and technology, Society of Education Officers & the Engineering council published Mathematics matters (1996) which reported that Higher Education lecturers perceived that students were having difficulty forming mathematical models for engineering problems. UCAS (1996) published a report stating that only one third of students with A-level mathematics now went on to read mathematics, science or engineering and only 40% of engineering students had any A-level mathematics.
and concluded that the school curriculum did not adequately prepare students for a mathematics degree or for the mathematical components of other higher degree courses. The study pointed out that many universities are dealing with this by a variety of measures that included diagnostic testing, setting course entrance examinations such as Advanced Extension Awards (AEA) or Sixth Term Examination paper (STEP), redesigning first year mathematics courses, providing remedial centres of help, drop in work-shops and computer based mathematics learning centres. However, they noted that the effectiveness of diagnostic testing and computer based learning had not been systematically evaluated. [§2.16] Gordon, (2005) suggested that students seem weak in the fundamental concepts such as algebra manipulation.
2.4 Grade Inflation
A further cause for concern was the increase year on year since 1982 in the number of students gaining passes at A-level and in particular gaining the high grades that Higher Education Institutions sought. Studies associated with identifying the calibre of the students entering into university are frequently associated with evidence drawn from The A-level Information System (ALIS). This began in 1983 as a system for helping schools compare progress between their students and the students of other schools. Currently 1400 schools and colleges participate in the project which processes about half of the A-levels taken in the UK. An optional part of the scheme is the Test for Developmental Ability (TDA) which is offered free of charge to participants of ALIS.
A report for the Sunday Times by Tymms, Coe and Merrell (2005) found that grades had improved but there had been a decline in the TDA scores of the candidates between 1988 and 2001 which was most noticeable for Mathematics.
From 1988 until 2004 the achievement levels have risen by about 1½ grades across all subjects on average. Exceptionally, from 1988 the rise appears to be about 3 grades for Mathematics. This could be due to this severely graded subject being brought more into line with other subjects.
(Tymms, Coe & Merrell. pp14-15)
it has meant that the very top levels of attainment have been removed from A-level. [§ 2.14]
The topics most frequently cited by universities as showing a decline in understanding and process are algebra and geometric subjects such as trigonometry.
2.5 Decline in the Student Uptake of A-level Mathematics; the Crisis in
Mathematics
Since 1985 there has been an overall increase in the number of students studying A-levels. In 1985 20% were studying A-levels, in 1994 35% (Bell, Bramley & Raikes, 1997) and in the 3rd quarter of 2005, the Labour Force Survey of the Department of
Trade and Industry (DTI), reported that 73% of 16 to 18 year olds were in full time education, most studying A-levels. There has not been the corresponding increase in the number of students studying A-level mathematics however, which has declined significantly. The pattern of decline is evidenced by the statistics: In 1989, 84,744 studied mathematics at A-level, in 1995 there were 62,188 candidates and in 2004 there were 52,788
.
(Gordon, 2005). The percentage of A-level applicants who opt to do mathematics has fallen from approximately 9% during the years 1993-2000 to 6.9% in 2004/5. Of these, up to 40% go on to take non-mathematics based subjects at university so the low number of students entering Higher Education to study mathematics-based subjects is causing great concern. Many mathematics departments have suffered a drop in funding to the extent that they have had to merge their mathematics departments with other associated disciplines; for example Nottingham Trent combined mathematics with computing and Bangor combined mathematics with engineering to form the new subject of ‘informatics’. Some have had to consider a severe reduction or, as in the case of the Universities of Hull and Essex, a complete deletion of their mathematics departments. A survey undertaken by the London Mathematical Society in 1995 led by James Smith stated that 25% of mathematics departments were under threat. A further survey by Middleton in 2001 indicated similar findings with departments reporting the loss of service teaching, the cessation of single honours mathematics and down sizing or embedding into larger groupings.A postnote to a paper by the Parliamentary Office of Science and Technology called
closed and many of the remaining 46 were under pressure. This means that not only is there a significant reduction in the number of people taking mathematics degrees, but there is a decline in the quantity of service teaching which mathematics departments offer to other disciplines. A further consequence is that it leads to fewer mathematics graduates and hence fewer mathematics graduates becoming teachers which has serious implications for the quality of learning for future A- level candidates.
In addition, many universities had introduced mathematics entrance examinations [§2.3 and § 2.16]. The growing concerns about standards at A-level and the decline in its attractiveness to candidates led to a review of 16-19 education by the School Curriculum and Assessment Authority (SCAA) and The Office of Standards in Education (OFSTED), headed by Ron Dearing in 1996.
2.6 The Dearing Review
The Dearing review in 1996 acknowledged the AS was not as successful as had been hoped. Take up was low and was further declining especially in mathematics. Because it studied topics to the full depth of A-level, it had been found to be relatively too demanding for many learners and the judgement was that it was failing to achieve its main purpose of increasing breadth of study in post-16 education. The report suggested a reformulated AS. Instead of covering half the A-level syllabus to full depth the new AS would cover the syllabus breadth and content appropriate to one years study post GCSE; a horizontal structure. The AS and A-level could hence be co-teachable. The AS assessment should be graded on an A - E scale like the A-level and, for the purposes of Higher Education recruiters, the AS component should be weighted as 40% of the total marks of the A-level. The A-level should be reviewed again to ensure progression from AS to A-level and the content of the new core should be specified in greater detail to give more guidance to examining boards of what has to be included in their syllabuses and to give Higher Education tutors a clear indication of the work covered by all students. It also recommended a continuing move from linear to modular examinations.
2.7 An Interim Response to the Dearing Report
In February 1997 a new core was agreed by the Secretary of State and examination boards were asked to submit first drafts of syllabuses and specimen examination papers by early June as an interim response to the Dearing report. The AS was changed to 50% of the total content whilst a The Pure mathematics component was to be 50% of the AS and A-level. At least 25% of the total assessment had to be without the aid of a calculator. This was a response to the charge that students were over-dependent on calculators but led to fears that this would result in less satisfactory examination questions in topics such as trigonometry and numerical methods. There was more Pure material than previously. Sections on proof (for AS and A-level) and Vectors (for A-level only) were included and the Mathematics of Uncertainty was removed as it did not fit easily with the other pure components and overlapped with material in the statistics modules. For the first time a list of required background knowledge was specified to candidates.
There followed a series of consultations with teachers, lecturers and the mathematics community called Qualifying for Success which were held over the 2 years following the Dearing report. However, pressure continued to mount over a perception of grade inflation in A-level mathematics and the continued decline in standards.
2.8 Further Reports on the Crisis in Mathematics
In contrast a report Teaching and Learning Algebra pre-19 published by the Royal Society and the Joint Mathematics Council of the United Kingdom (1997) concluded that the vast majority of non-mathematics pre-university students in Germany and France are expected to be competent with manipulative algebraic skills equivalent to those experienced by students studying a single A-level mathematics within England and Wales. They also concluded that what had been algebraic content within an O-level course was now being taught at A-O-level and consequently they recommended a bridging course between GCSE and A-level mathematics. Although they recognised the difficulty in comparing A-level papers with those of the past due to the variation in question papers from different boards, they noted that whilst universities had adjusted their courses to use the first year as a levelling course to take account of the differing backgrounds of their students, many had initiated four year degrees.
In July 1998 the Royal Society published Mathematics Education pre 19 which noted the difficulty of recruitment to teacher training courses in mathematics and science and the lack of highly qualified specialists entering the profession. It recommended the matter be tackled with utmost urgency at a national level. It also recommended increasing the focus on key mathematical concepts by reducing the breadth of content in A-level syllabus specifications for mechanics and statistics. The report concluded by noting that any revision of the syllabuses should involve Higher Education bodies since they are the major users of A-level mathematics students.
In 1998 the new interim syllabuses agreed after the Dearing report was introduced by schools and colleges for assessment in the summer of 2000.
In 1999 The Engineering Council together with the Learning and Teaching Support Network (LTSN), The Institute of Mathematics and its Applications, and The London Mathematical Society published Measuring the Mathematics Problem, which reported on the serious decline in students’ mastery of basic mathematical skills. The first two recommendations of the report were that students embarking on mathematics-based degree courses should have a diagnostic test on entry and that prompt and effective support should be available to students whose mathematical background is found wanting by the tests.
[
§ 2.16].2.9 Curriculum 2000
One of the conclusions of the Qualifying for Success consultations was that the post-16 curriculum in England was too narrow and inflexible and that it had to be adapted to enable 16 and 17 year olds to compete with their peers in other European countries. It was concerned that most of our European competitors offered their young people broader programmes with a much more demanding schedule. The reforms introduced in September 2000 were intended to encourage young people to study more subjects over two years than had been the case previously, while also helping them to combine academic and vocational study [QCA 1999]. The traditional 2 year course would now be split into AS for the first year and A2 for the second year. Units would be designated as AS modules or A2 modules Students were henceforth to study 4 AS levels in the first year of the sixth form and in the second year they should continue 3 of their chosen subjects on to A2 and possibly study a further AS level course.
2.10 Changes in the Structure of Assessment
The reforms included plans to provide world class tests to stretch the most able students and give a clearer indication of their abilities. In addition, it was intended that students should develop their competence in the key skills of communication, application of number and information technology (IT) which could accrue UCAS points, and Problem Solving, Working with Others and Improving Own Learning and Performance which could not. Major structural changes to the curriculum in England and Wales were implemented which introduced assessments of key skills at levels 1, 2 and 3. In the new national qualifications framework a GCSE grade of D, E, F or G would indicate level 1 key skills. A GCSE grade or A*, A, B or C would show level 2 key skills. Mathematics beyond GCSE, but pre-university level, was classified as a level 3 qualification.
simple (i.e. non graphic, and non-programmable) scientific calculator only [Abramsky (2001)]
Within England there were 5 approved syllabus specifications for AS/A-level, and 2 additional ones for Wales and Northern Ireland. The assessment, by standard examination, was designed to be 8-9 hours for the A-level and 4-4.5 hours for the AS.
2.11 Curriculum 2000 Results.
After Curriculum 2000 reports from schools and colleges were negative. Phrases such as “sweat shop sixth forms” were commonly used and teachers complained that they were moving away from meaningful education under pressure of continual assessment. In addition the 2001 results for the new AS qualification were deeply disappointing when it was revealed that almost one third of students had failed the new examination. The perception of students that mathematics is harder than other subjects was reinforced and the take up rate amongst candidates fell further the following year. Curriculum 2000 was heavily criticised by teaching professionals who claimed that the work load for the AS was too demanding and the overall effect had been to damage mathematics post-16 (Hodgson, & Spours, ,2002;Porkiss,2005;Gordon 2005).
The first A2 results under Curriculum 2000 were released in August 2002. The number of students finishing the full A-level had fallen by 12,000 and university applications had fallen by 10%. QCA were immediately asked to revise the syllabus and in October 2002 new syllabuses were published to be taught from September 2004.
2.12 QCA 2004 Syllabus.
from 1
/2:
1/2
to 2/3:
1/3
with no increase in the amount of Pure content. The use ofcalculators was further reduced.
2.13 Assessment Objectives.
Curriculum 2000 had specified key skills that would be incorporated throughout the study of core mathematics for students. These included developing understanding, coherence and mathematical progression; developing abilities to reason logically, and recognise incorrect reasoning and to take increasing responsibility for their own learning and the evaluation of their own mathematical development.
These were retained in the new syllabus [QCA 2004] with the addition of a specified percentage assigned to each skill for the purpose of the assessment.
The new 2004 syllabus started being taught for AS assessment in 2005 and A2 in 2006 with the approval of teachers who thought that covering the work would be more realistic in the available time frame (Porkiss, 2005).
During this research the pilot study was carried out according to the 2000 syllabus whilst the main study was carried out during the introduction and implementation of the 2004 syllabus.
2.14 The Tomlinson Report and the Smith Report.
Since 2004 further changes have been implemented. In September 2002 another independent inquiry was commissioned by the government chaired by Mike Tomlinson to consider the effects of Curriculum 2000 and make recommendations for
reforms. This was published in 2004 under the title 14-19 Curriculum and
Qualifications Reform and recommendeda radical overhaul of the 14 -19 curriculum and assessment structure and the introduction of diplomas to incorporate A-levels and vocational qualifications. It further recommended that material be included in the course and assessment to stretch students and two further grades of achievement A* and A** should be available for the most able.
current curriculum, assessment and qualifications framework to meet the needs of students or to satisfy the expectations of employers and Higher Education Institutions, and the lack of resources to support mathematics teachers. It attributed the possible factors of the decline in student uptake to be: the perceived poor quality of the teaching and learning experience, the perceived relative difficulty of the subject, and the failure of the curriculum to excite interest and provide motivation. The report recommended a two tier GCSE rather than the current three tier one so that all students have the possibility of attaining a C grade [§2.2.2.1]. In addition extra courses should be provided for the best mathematical talent at GCSE and A-level. With respect to A-level the report stated that Curriculum 2000 has been a disaster for post-16 study and the AS/A2 split has not worked. Students could not cope with the material within the laid down timetable and the pass rate had dropped from 90% to under 70% which has had a detrimental effect on the image of mathematics and further decline in the uptake. It also expressed concern about the nature and frequency of assessment for AS/A2. It recommended that a post be established within the Department for Education and Science (DFES)
for
special responsibility for mathematics. It further recommended that the assessment of 6 units introduced by Curriculum 2000 be reduced to 4 larger units to reduce the assessment burden,and the
costs and timetabling difficulties. In order to address the falling numbers of mathematics students at A-level and university, the report recommended financial incentives for students and teachers. [Smith, 2004].In 2005 the government published a white paper implementing the recommendations of the Smith report and appointed of Professor Hoyles as ‘Maths Tsar’. The syllabus has been revised again and in 2008 the new A-level syllabus with 4 assessment units will begin to be taught in schools and colleges. It will include a new grade, A*, and material in the A2 examination to ‘stretch and challenge’ the best students
.
[AQA, 2007].classrooms. This flux in the course style and content as problems were identified and addressed was the background to the research sample students’ study of A-level mathematics. The quality of students’ understanding of the subject was an important issue in the public debate. This research provided and opportunity to hear the students’ voice and this lead to the research objective to investigate students own perceptions of their learning experience. [§4.2]
2.15 Change of Teacher Profile.
The shortage of graduate mathematics teachers has led to an increase in the number of students in mathematics A-level classrooms. Research documented by Hirst (1991, 1996) showed that the class size for A-level mathematics, pre-1986, had a mean of around 10 and a maximum of about 15. By 1996, class sizes had significantly increased with a mean between 15 and 18 students. In 2003 the average class size was 17 [Ofsted, 2003]. With the increased use of technology the teacher was no longer the only medium of delivery of content or understanding. Computer Assisted Learning (CAL) became universally used in A-level classrooms. Though there remains debate about the extent to which this is productive in the long term, research by Kadijev and Haapasalo in 2001 provided evidence that it can provide a link between the procedural knowledge and conceptual knowledge [See Chapter 3] that defines mathematical education.
Gordon (2005) points out that another change in the classroom is associated with the teacher profile. In 1996 only 15% of teachers were under the age of 30 and 63% over 40 [Porkiss (2000)]. Despite financial incentives to attract mathematics and science graduates, including paying off student loans and a bonus of £4000 initially (currently £6000) on starting teaching, recruitment is still well short of its targets. Where this has attracted new mathematics teachers, many are qualified in other disciplines and have undertaken a retraining course in mathematics to gain Qualified Teacher Status (QTS) [Smith, 2004].
2.16 University Entrance Tests.
consider when assessing the merit of applicants for their courses. In September
2004 the Schwartz report, Fair Admissions to Higher Education: recommendations
for good practice, was published. It recommended that where possible, a test should be devised that universities and colleges should use to predict undergraduate potential that is not reflected in level 3 (A-level) results. The report called for an evaluation of the tests currently set by Institutions of Higher Education and trials for a National Entrance test.
In September 2005 the National Foundation for Educational Research began a 5-year trial of university entrance tests called the Scholastic Assessment Tests (SATS) to investigate if they were a better predictor of able students than A-level results. Students take the test as they study AS courses and the results will be compared to A-level results and to eventual degree outcomes. The introduction of nationwide SATs indicates a deepening disconnection between A-level study and entrance to Higher Education Institutions.
2.17 Trigonometry at AS/A2 Level.
In my experience tutoring A-level mathematics, trigonometry has frequently been the topic that has been most problematic to students. Tutors see students from different schools that have been exposed to different teaching styles although the material they study is set by the syllabus. Indications of the confusions that students have are evidenced by comments such as:
"Are we talking about triangle trigonometry or circle trigonometry here?"
(Yr 13 student)
and:
"I used to understand it when it was just triangles but now I don't know where to start" (Yr 13 student)
Sometimes students appear to be confused by the multiplicity of representations and how they are interconnected as evidenced by these comments:
“I don’t understand radians – I can only do trigonometry in degrees”
“What is sine exactly? I thought I knew but now it is so confusing.”
(Yr 12 student) “I hate trigonometry. There is just so much to remember: all the diagrams and formulas.
I never know which one to use.”
(Yr 13 student)
This personal experience of students’ specific problems with the study of trigonometry at A-level over and above other topics on the syllabus was the reason for this piece of research.
Trigonometry has been part of the A-level since its inception. As a set of functions of angle it is important when studying triangles and modeling periodic phenomena. The topic is developed through ratios of two sides of a right triangle containing the angle, to, more generally, ratios of coordinates of points on the unit circle, to, more generally still, infinite series, or equally generally, solutions of certain differential equations. The next section lists briefly the trigonometry component in each of the AS/A2 modules.
2.17.1 Trigonometric Content in the A-level Syllabus from 2005.
The full specification of the trigonometric content of A-level is provided in the Appendix. However over the four core units of A-level it is worth noticing that there is no trigonometric content within C1. Within C2 to C4 the content ranges from an exploration of the defined aspects of sine cosine and tangent (later in C3 secant, cosecant and cotangent and of arcsin, arccos and arctan) in surd form and radian equivalents, this is presented through a unit that include angle and radians. Though initially developing as the notion of a function of an angle by C4 notion of differentiation of a function is considered.
C1: There is no trigonometry in this unit
and 60 or radian equivalent and the triangles that can be used to determine each of them via Pythagoras theorem. It then considers the nature of various transformations of the graphs and the identity for tan x and sin2 x+cos2 x =1 and combines all this
knowledge to derive the solutions to simple trigonometrical equations, including those with a quadratic format, within a given interval.
C3: The course moves on to ‘knowledge of the relationships between sine cosine and tangent, understanding of their graphs and appropriate restricted domains. Knowledge and use of the sec2 and cosec2 identities. Knowledge and use of the
double angle formulae for sin (A ±B), Cos (A ± B) and tan (A ± B) and for a cos x +b sin x in the equivalent forms of r cos (x+a) or r sin (x+a). Candidates should be able to prove simple identities such as cos x cos 2x + sin x sin 2x = cos x’.
In the development of calculus section we have the differentiation and integration of sin x, cos x and tan x, differentiation of cosec x, cot x and sec x. Skill is expected in the differentiation of functions generated from standard forms using products, quotients and composition such as 2x4 sin x, cos x2 and tan2 2x.
C4: The integration of standard trigonometric functions is covered: 'such as sin 3x,
sec 2 2x, tan x and candidates are expected to be able to use trigonometric identities to integrate, for example, sin2x, tan2x cos23x. There is also differentiation of simple
functions given parametrically or implicitly.
The full specification for the course post 2004 studied by the students in this research study is under Appendix 1.
2.18 Summary.
The development of A-level mathematics since its inception has seen a change in purpose, content, format and assessment procedure.
students reflected their achievement in comparison to that of the other students, in that year’s cohort.
During the 1970’s the traditional format of Pure and mechanics components was expanded to include statistics. The number of syllabuses available increased and the lack of uniformity in their content led to the re-introduction of a core curriculum in 1983. In 1984 the first Qualification-awarding body was established to oversee course content and assessment. The A-level was re-focused to be the final, and most advanced part, of the study of mathematics in school as well as an entrance examination for the universities. In 1989 modular assessment was trialled and AS mathematics was examined for the first time and in 1993 the core curriculum was rewritten to include the study of AS maths.
From the mid 1990’s published research indicated that:
Students considered maths and science subjects to be more difficult than other subjects despite mathematics grades being inflated to reflect levels of achievement comparable with other subjects (Fitzgibbon & Vincent,1994: Tymms Coe & Merrill,2005).
The proportion of the A-level cohort opting for maths- based subjects was in decline and the proportion of these going on to study maths- based subjects in Higher Education was decreasing. [London Mathematical Society (LMS) & the Institute of Mathematics (IM) (1995), UCAS (1996), Gordon (2005)]
Students lacked essential mathematical faculty (LMS&IM, 1995; Sutherland and Pozzi,1995: Standing Conference on Schools Science and Technology
(SCSST),1996]
Higher Education Institutions were having to change their courses and had introduced entrance exams to respond to this phenomenon (Kahn & Hoyles 1997; Sutherland & Dewhurst,1999)
These concerns led to a review of 16-19 Education by Ofsted & SCAA the results of which were published in 1996. It recommended a reformulated AS course, a more detailed specification of the new core curriculum, a move to modular assessment and recognised maths as more difficult than other subjects. It suggested other subjects be levelled up. The result of the review led to the introduction of Curriculum 2000 which introduced the separation of A-level maths into AS and A2 courses. Each course would entail the study of three modules, two pure and one applied, which would be separately assessed. The initial results of Curriculum 2000 were disappointing showing a high drop out rate from the A-level course and applications to study mathematics- based subjects in Higher Education dropping by 10%. The response by QCA was to revise the Pure content of the AS/A2 level renaming it Core maths. In 2004 the Shwartz report recommended that the proliferation of Higher Education entrance examinations be standardised into a single test.
The aim of modular AS and A-Level mathematics is to provide greater flexibility and to ease the burden of pressure that was a criticism of the traditional model that had a single assessment via two written papers at the conclusion of the two year course. By examining twice yearly it allows for one or two units to be studied and then assessed prior to moving on to the next unit.
In the first year two core components and one applied component must be studied and these are at AS level leading to an award of AS mathematics. In the second year two further units of core mathematics, which are dependent on knowledge of the AS core modules, and another applied unit are studied. These are at a higher level of mathematical knowledge and reasoning known as A2 level. Modules may be retaken without restriction and the best mark contributes towards the final grade. The final grade at A- Level is the sum of the best marks for the six modules. Synoptic assessment is expressly included to address the degree of drawing together that candidates have in knowledge, understanding and skills learned in different parts of the course. Trigonometry is studied at units C2, C3, C4 and in M1. Functions are defined at C3 though the word is used from the outset of C1.
mathematics currently and moreover to what extent have the stated core skills of developing understanding, coherence and mathematical progression been achieved. These were issues that were fundamental to the planning of this research of a group of students as they study of trigonometry.
This study was undertaken in the years 2004-2006. The pilot study group studied the Pure modules and the main study group studied the new Core modules. The trigonometry component in Pure 1 and Pure 2 studied by the pilot study group was covered in Core 2 and Core 3 in the revised syllabus. Ultimately the trigonometry component of the Pure course was covered in modules C2, C3 and C4.