Studying the Inter-Relationship amongst Barriers to
Adoption of Big Data Analytics in SMEs in Developing
Countries
Lakshay Aggarwal
SociobuddyTechnologies Private Limited,
Delhi, India
Remica Aggarwal
School of Business, University of Petroleum & Energy Studies,
Dehradun, India
Veena Aggarwal
Recventures Education Services Private Limited
Delhi, India
ABSTRACT
Big data analytics or BDA is a buzzword today. Almost every multinational e-commerce giant or management consulting organization wants to be associated in some way or other to the BDA processes. However the implementation of big data analytics is not that exciting with respect to small medium enterprises or SMEs due to various impediments. Present research focuses on identifying the various barriers to implementation of big data analytics in small medium enterprises in developing countries. It further studies the inter- relationships amongst them using ISM methodology.
Keywords
Small Medium Enterprises (SMEs); Big Data Analytics (BDA); Information Technology; Developing countries
1.
INTRODUCTION
‘‘Big Data” is recently becoming popular due to its capability of handling huge amount of data ranging in exabytes and beyond thereby extending the technological capability to handle data in a more efficient way [1]. It has four dimensions often addressed as VVVC which stands for high-volume (V) data, created with high velocity (V) in great variety (V) and of high complexity (C). As per the study by [2] big data analytics has greatly stimulated the demand of specialists in information technology and management leaving aside no excuse as to why it is becoming the first choice amongst the IT giants such as AG, Oracle, IBM, Microsoft, SAP, EMC, HP and Dell who have spent more than $15 billion on data analytics and processing since its inception in the form of an article introduction from ACM digital library . On the other hand , “big data analytics” or BDA refers to the processes of exploring , examining and analysing large amounts of data with variable types to study the uncover hidden patterns, unknown correlations and relationships ( if any ) amongst them . This ability of BDA makes its possible for its operating organization to increase business benefits and improve operational efficiency thereby capturing larger potential market share[3]. BDA allow users to analyse large volumes of data obtained from different databases , internet websites, mobile-phone records and locations as well as sensor-captured information with the help of open source software frameworks which are able to support the analysis of large amounts of data sets across clustered systems [4].
Big data analytics would be incomplete without mentioning its tools and techniques . These includes business intelligence tools such as Oracle ‘s big data appliance and Cloudera’s Hadoop distribution which are widely used in marketing analytics for fraud detection and financial risk assessment [5]. Apart from these, Gridgain is used for processing large amounts of real-time data, HPCC (High Performance Computing Cluster) for real-time calculations, Storm for
dealing with huge data sets with distributed real-time computation capabilities and Talend for providing a number of business intelligence (BI) service [6]. Microsoft, a popular name in IT field, provides Power BI for office 365 and Microsoft Azure which uses a complete platform technique to integrate models and analyse and visualize to uncover the pattern from huge data sets. Similarly, IBM another popular IT giant provides SPSS Modeler, an extensive predictive analytics platform technique which is widely used in forecasting and related decisions [7,8]. This is usually achieved using a set of advanced algorithms, entity analytics, decision management and optimization.
BDA and its acceptance : Although since its inception , BDA is warmly and whole heartedly accepted by developed countries , its world-wide acceptance is still a challenge particularly amongst developing countries despite its popularity amongst them . The reasons of course are numerous . Indeed, SMEs are often characterized with limited resources such as lack of expertise in big data analytics concepts and techniques , implementation of BDA and also financial resources. Thus, SMEs are inclined not to adopt in new technology , software or innovation unless they are assured of the generated competitive advantage [9]. However, though SMEs are restricted in term of resources, [10] suggests that SMEs should not ignore their significance and should try to embrace new technologies in their businesses. [11] have also identified that the strictness and narrow mindedness and often ignorance on part of big data analytics serve as barriers thereby inhibiting its implementation.
Present research explores and identifies various barriers to SME uptake of big data analytics and recognises their complex challenge to all stakeholders, including national and international policy makers, IT, business management and data science communities. Some of the common barriers have been described in section 2 which are further take up in section 3 to obtain a hierarchical relationship amongst them using Interpretive Structural Modelling Methodology (ISM ) .
2.
LITERATURE REVIEW
2.1
Literature review on applications of
big data analytics in various sectors
Big data is big and the aspirations from it is also big. Today almost every multinational company wants to be associated with the big data analytics tools and techniques . Not only are they making significant advances in their customer relations thereby improving their CRM but also improving profitability through appropriate product selection and development. Big data analytics is implemented in companies with the intention to achieve the ‘‘right data, for the right user, at the right time”. It is been used by different e-commerce and management consulting companies to provide a rich set of services to their consumers or client firms so that they can improve their performance sustainably . For example , McKinsey & Company, uses BDA to help banks to analyse consumer behaviours to implement digital innovation and upgrading services [12] . Many banks are using big data to rate the credit worthiness and predict the solvency of clients . On the other hand , Amazon uses BDA to analyse consumer behaviour for the timely delivery of the consumer goods . Intel recently adopts BDA to accelerate development and deployment of wearable applications with data-driven intelligence by integrating various tools and algorithms from Intel along with cloud-based data management system [13]. A recent study by KPMG1 sees the insurance industry as the leader in the usage of advanced data analytics and big data strategy.
The level of adoption and refinement of data analytics varies considerably over industrial sectors. For example , supermarkets used big data to determine what products people bought together, to identify fluctuations in sales of items in certain days, weeks or months, and to understand the sort of offers or advertising to which people react positively. Financial market participants use big data analytics in high-frequency trading (HFT) algorithms to make automatic transaction decisions [14]. A high level of refinement of data analytics is also present in the energy and retail sectors particularly when talked about supply chain in the automotive industry.
2.2
Literature review on barriers to
adoption of big data analytics in SME s
Small and medium enterprises (SMEs) have proved themselves to be slow adopters of the new technology of big data analytics and are in danger of being left behind even in developed countries such as Europe and UK where the adoption rate of BDA among SMEs was only 0.2%, compared with 25% for businesses with over 1000 employees2 . Delayed innovation and incapacity to adopt new technologies in the SME sector are critical for the European economy because of the large representation of the SME sector. The e-skills UK study expects that the demand for big data specialists will increase from 2013 until 2018 by 243%. Inability to adjust or adapt to BDA could be because of many reasons. For example , in a survey among Austrian SMEs, the lack of in-house data analytic expertise was identified as a major barrier against the take-up of big data projects. In a survey by [15], it is predicted that United States alone faces a shortage of 140, 000 to 190, 000 people with analytical expertise and 1.5 million managers and analysts with the skills to understand and make decisions based on the analysis of big data in the year 2018 . This section therefore focuses on exploring various barriers to adoption of BDA in developing countries . The literature is reviewed using the keywords such as barriers to big data analytics , big data analytics and SME , SME s in
[image:2.595.315.561.148.794.2]India , adoption of big data in India , big data and SMEs , data analytics and SMEs etc. Table 2.2 below compiles the various barriers to adoption of big data analytics in SME s in developing countries .
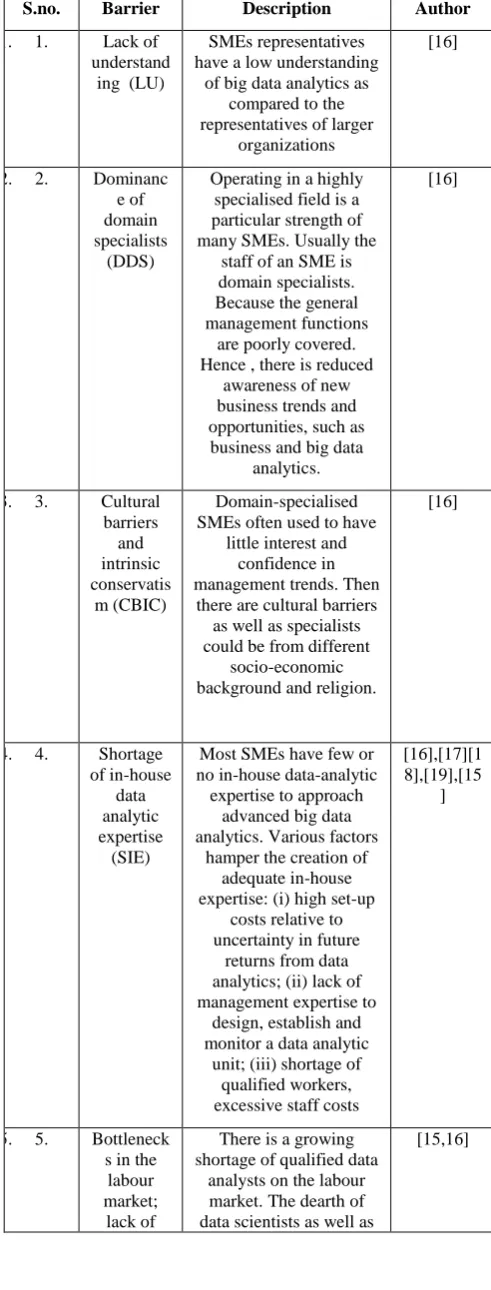
Table 1. Compilation of various barriers to adoption of big data analytics in SMEs
S.no. Barrier Description Author
1. 1. Lack of understand
ing (LU)
SMEs representatives have a low understanding
of big data analytics as compared to the representatives of larger
organizations
[16]
2. 2. Dominanc e of domain specialists
(DDS)
Operating in a highly specialised field is a particular strength of many SMEs. Usually the
staff of an SME is domain specialists. Because the general management functions
are poorly covered. Hence , there is reduced
awareness of new business trends and opportunities, such as business and big data
analytics.
[16]
3. 3. Cultural barriers
and intrinsic conservatis
m (CBIC)
Domain-specialised SMEs often used to have
little interest and confidence in management trends. Then
there are cultural barriers as well as specialists could be from different
socio-economic background and religion.
[16]
4. 4. Shortage of in-house
data analytic expertise
(SIE)
Most SMEs have few or no in-house data-analytic
expertise to approach advanced big data analytics. Various factors
hamper the creation of adequate in-house expertise: (i) high set-up
costs relative to uncertainty in future
returns from data analytics; (ii) lack of management expertise to
design, establish and monitor a data analytic
unit; (iii) shortage of qualified workers, excessive staff costs
[16],[17][1 8],[19],[15
]
5. 5. Bottleneck s in the
labour market;
lack of
There is a growing shortage of qualified data
analysts on the labour market. The dearth of data scientists as well as
resources in IT knowledge and experts (LOE)
IT experts is hindering the further development
of predictive analytics services in European as
well as non-European markets . Salaries have been increasing to levels that are not accessible for
most SMEs.
6. 6. Lack of business cases (LBC)
The availability of exemplary case studies and success stories is an
important factor for the successful propagation of
innovation in business and industry. Big data SMEs usage is lacking .
[16]
7. 7. Lack of business analytics services (LBAS)
Shortage of useful and affordable consulting and
business analytics services
[15],[16]
8. 8. Beliefs and perception s of higher manageme nt towards BDA ( BP)
Adoption of BDA often is a decision taken by top
management and owner of the organisation . It is quite obvious that these decisions are influenced
by the risk taking capacity , owners’ and higher management’ own
beliefs and perceptions about BDA
[15],[20]
9. 9. Lack of intuitive software (LIS)
The present market offer in business and big data analytics is split into two extreme parts: potentially
useful but highly complex solutions requiring the expertise of
knowledgeable data scientists and some simple but less-effective implementations. Market
analysts emphasise the need for predictive analytics software with intuitive user interfaces and a shorter learning
curve.
[16]
10. 10. Lack of manageme
nt and organisatio nal models
(LMOM)
To make business analytics an economic success, a company needs
an appropriate management concept and organisational structure . For instance, issues like leadership, allocation to departments, horizontal and vertical relationships
and centralised versus distributed functions have
little or no relevance for
[16],[21],[ 22]
SMEs.
11. 11. Concerns on data security
and privacy
(CDS)
The data security issue is more serious for SMEs
than for larger companies. In general, the conditions of and the
expertise in IT security are at a lower level in
SMEs than in bigger companies. An important
security gap at SMEs is the use of outdated and unsupported database management systems.
[16],[23],[ 24],[25],[2
6]
12. 12. Different venture concept (DVC)
The business model for SMEs is often built around specific market
opportunities or the existence of differentiating skills and
strategic resources that make them competitive in the local or global
market.
[16]
13. 13. Financial barriers/ lack on investment in sophisticat ed software and solutions (FB)
SMEs have less access to debt finance than larger
companies. Limited financial resources cause SMEs to be very cautious about new investments
beyond their specific business scope.
[17],[27],[ 28],[29],[3 0],[31],[32 ],[33]
14. Lack of IT knowledge (LOK)
This includes slower adoption towards new
technology due to unfamiliarity with ICT ,
lack of IT knowledge , lack of availability and
affordability of technology in the country
.
[32],[33],[ 30],[31],[1
0]
3.
INTERPRETIVE STRUCTURAL
MODELLING METHODOLOGY
Suggested by [35] , the technique has been used widely to develop a map of the relationships between the many elements in the form of a hierarchy graph. Group’s judgement decides whether and how the items are related.
further used to develop an initial reachability matrix which has all values in binary form. Rule of transitivity is usually checked at this stage. After removing the transitivity, final reachability matrix will form. Afterwards, the reachability set and antecedent set for each criterion and for each element can be obtained from the final reachability matrix . After that a level partition matrix can be obtained based on establishing the precedence relationships and arranging the elements in a topological order. Thereafter a Mic-Mac analysis can be performed which categorise the variables as per the driving and dependence power in to autonomous, dependent, driver and linkage category before constructing a final diagraph.
4.
DEVELOPMENT OF ISM MODEL
This section, ISM model is developed for studying the interrelationships amongst the various barriers to adoption of Big data analytics in SME s in developing countries . 15 important criteria are considered viz. Lack of understanding (LU), Dominance of domain specialists (DDS), Cultural barriers and intrinsic conservatism (CBIC), Shortage of in-house data analytic expertise (SIE), Bottlenecks in the labour market; lack of resources in IT knowledge and experts (LOE), Lack of business cases (LBC), Lack of business analytics
services (LBAS), Beliefs and perceptions of higher management towards BDA ( BP), Lack of intuitive software (LIS), Lack of management and organisational models (LMOM), Concerns on data security and privacy (CDS), Different venture concept (DVC), Financial barriers/ lack on investment in sophisticated software and solutions (FB), Lack of IT knowledge (LOK), Lack of appropriate infrastructure (LAI)
4.1
Construction of Structural Self
-Interaction Matrix (SSIM)
This matrix gives the pair-wise relationship between two variables i.e. i and j based on VAXO. SSIM has been presented below in Fig 1.
4.2
Construction of Initial Reachability
Matrix
and final reachability matrix
[image:4.595.52.547.322.770.2]
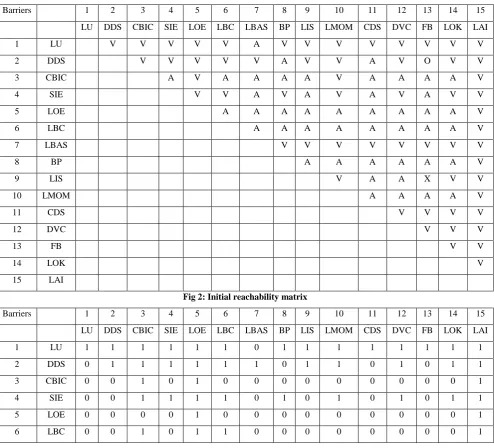
The SSIM has been converted in to a binary matrix called the initial reachability matrix shown in fig. 2 by substituting V, A, X, O by 1 or 0 as per the case. After incorporating the transitivity, the final reachability matrix is shown below in the Fig3.
Fig 1: SSIM matrix for pair wise relationship amongst barriers
Barriers 1 2 3 4 5 6 7 8 9 10 11 12 13 14 15
LU DDS CBIC SIE LOE LBC LBAS BP LIS LMOM CDS DVC FB LOK LAI
1 LU V V V V V A V V V V V V V V
2 DDS V V V V V A V V A V O V V
3 CBIC A V A A A A V A A A A V
4 SIE V V A V A V A V A V V
5 LOE A A A A A A A A A V
6 LBC A A A A A A A A V
7 LBAS V V V V V V V V
8 BP A A A A A A V
9 LIS V A A X V V
10 LMOM A A A A V
11 CDS V V V V
12 DVC V V V
13 FB V V
14 LOK V
15 LAI
Fig 2: Initial reachability matrix
Barriers 1 2 3 4 5 6 7 8 9 10 11 12 13 14 15
LU DDS CBIC SIE LOE LBC LBAS BP LIS LMOM CDS DVC FB LOK LAI
1 LU 1 1 1 1 1 1 0 1 1 1 1 1 1 1 1
2 DDS 0 1 1 1 1 1 1 0 1 1 0 1 0 1 1
3 CBIC 0 0 1 0 1 0 0 0 0 0 0 0 0 0 1
4 SIE 0 0 1 1 1 1 0 1 0 1 0 1 0 1 1
5 LOE 0 0 0 0 1 0 0 0 0 0 0 0 0 0 1
7 LBAS 1 0 1 1 1 1 1 1 1 1 1 1 1 1 1
8 BP 0 1 1 0 1 1 0 1 0 0 0 0 1 1 1
9 LIS 0 0 1 1 1 1 0 1 1 1 0 0 1 1 1
10 LMOM 0 0 0 0 1 1 0 1 0 1 0 0 0 1 1
11 CDS 0 1 1 1 1 1 0 1 1 1 1 1 1 1 1
12 DVC 0 0 1 0 1 1 0 1 1 1 0 1 1 1 1
13 FB 0 0 1 1 1 1 0 1 1 1 0 0 1 1 1
14 LOK 0 0 1 0 1 1 0 1 0 1 0 0 0 1 0
15 LAI 0 0 0 0 0 0 0 0 0 0 0 0 0 0 1
Fig 3 : Final reachability matrix
Barrier s
1 2 3 4 5 6 7 8 9 10 11 12 13 14 15 D.
P
L U
DD S
CBI C
SI E
LO E
LB C
LBA S
B P
LI S
LMO M
CD S
DV C
F B
LO K
LA I
1 LU 1 1 1 1 1 1 1 1 1 1 1 1 1 1 1 15
2 DDS 0 1 1 1 1 1 1 1 1 1 1 1 1 1 1 14
3 CBIC 0 0 1 0 1 0 0 0 0 1 0 0 0 0 1 4
4 SIE 0 1 1 1 1 0 1 0 1 0 1 1 1 1 11
5 LOE 0 0 0 0 1 0 0 0 0 0 0 0 0 0 1 2
6 LBC 0 0 1 0 1 1 0 0 0 0 0 0 0 0 1 4
7 LBAS 1 1 1 1 1 1 1 1 1 1 1 1 1 1 1 15
8 BP 0 1 1 1 1 1 0 1 1 1 0 0 1 1 1 11
9 LIS 0 0 1 1 1 1 0 1 1 1 0 1 1 1 1 11
10 LMO
M
0 1 1 0 1 1 0 1 0 1 0 0 1 1 1 9
11 CDS 0 1 1 1 1 1 0 1 1 1 1 1 1 1 1 13
12 DVC 0 0 1 0 1 1 0 1 1 1 0 1 1 1 1 10
13 FB 0 0 1 1 1 1 0 1 1 1 0 1 1 1 1 11
14 LOK 0 0 1 0 1 1 0 1 0 1 0 0 0 1 1 7
15 LAI 0 0 0 0 0 0 0 0 0 0 0 0 0 0 1 1
D.P : Driving power ; De.P : dependence power
4.3
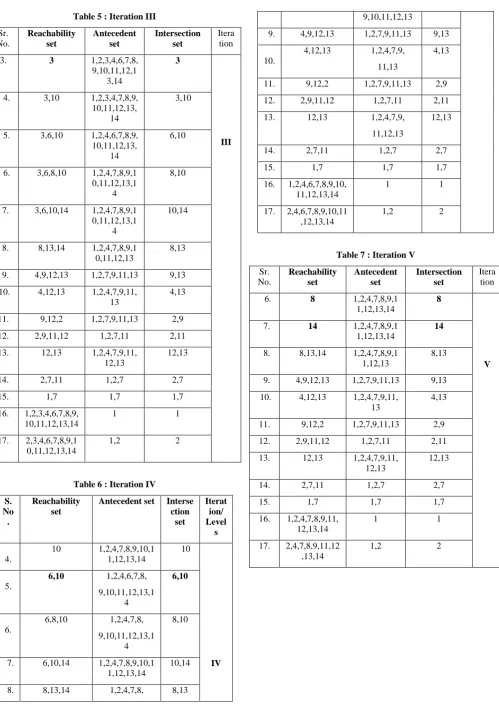
Level Partition
From the final reachability matrix, reachability and final antecedent set for each factor are found . The element for which the reachability and intersection sets are same are the top-level
Table 3 : Iteration I
S. No .
Reachabilit y
set
Antecedent set
Intersectio n set
Iteratio n/ Levels 1. 15 1,2,3,4,5,6,
7,8,9,10,11, 12,13,14,15
15
I
2. 5,15 1,2,3,4,5,6, 7,8,9,10,11, 12,13,14
5
3. 5,3,15 1,2,3,4,6, 7,8,9,10,11, 12,13,14
3
4. 3,5,10,15 1,2,3,4,7,8, 9,10,11,12, 13,14
3,10
5. 3,5,6,10,15 1,2,4,6,7,8, 9,10,11,12, 13,14
6,10
6. 3,5,6,8,10, 15
1,2,4,7,8,9, 10,11,12,13, 14
8,10
7. 3,5,6,10,14, 15
1,2,4,7,8,9,10, 11,12,13,14
10,14
8. 8,13,14 1,2,4,7,8,9,10, 11,12,13
8,13
9. 4,9,12,13 1,2,7,9,11,13 9,13 10. 4,12,13 1,2,4,7,9,11,13 4,13 11. 9,12,2 1,2,7,9,11,13 2,9 12. 2,9,11,12 1,2,7,11 2,11 13. 12,13 1,2,4,7,9,11,12
,13
12,13
14. 2,7,11 1,2,7 2,7
15. 1,7 1,7 1,7
16 1,2,3,4,5,6, 7,8,9,10,11, 12, 13,14,15
1 1
17. 2,3,4,5,6,7,8, 9,10,11,12,1 3,14,151
1,2 2
element in the ISM hierarchy. After its identification, it is separated out from the other elements and the process continues for next level of elements. Iterations have been shown from table 3 – table 13 below
Table 4 : Iteration II
S.No .
Reachability set
Antecedent set
Intersection set
Itera tion
2. 5 1,2,3,4,5,6,7,
8,9,10,11,12, 13,14
5
II
3. 5,3 1,2,3,4,6,7,8,
9,10,11,12,1 3,14
3
4. 3,5,10 1,2,3,4,7,8,9, 10,11,12,13,
14
3,10
5. 3,5,6,10 1,2,4,6,7,8,9, 10,11,12,13,
14
6,10
6. 3,5,6,8,10 1,2,4,7,8,9,1 0,11,12,13,1
4
8,10
7. 3,5,6,10,14 1,2,4,7,8,9,1 0,11,12,13,1
4
10,14
8. 8,13,14 1,2,4,7,8,9,1 0,11,12,13
8,13
9. 4,9,12,13 1,2,7,9,11,13 9,13
10. 4,12,13 1,2,4,7,9,11, 13
4,13
11. 9,12,2 1,2,7,9,11,13 2,9
12. 2,9,11,12 1,2,7,11 2,11
13. 12,13 1,2,4,7,9,11, 12,13
12,13
14. 2,7,11 1,2,7 2,7
15. 1,7 1,7 1,7
16. 1,2,3,4,5,6,7,
8,9,10,11,12,
13,14
1 1
17. 2,3,4,5,6,7,8,9, 10,11,12,13,14
Table 5 : Iteration III
Sr. No.
Reachability set
Antecedent set
Intersection set
Itera tion
3. 3 1,2,3,4,6,7,8,
9,10,11,12,1 3,14
3
III
4. 3,10 1,2,3,4,7,8,9, 10,11,12,13,
14
3,10
5. 3,6,10 1,2,4,6,7,8,9, 10,11,12,13,
14
6,10
6. 3,6,8,10 1,2,4,7,8,9,1 0,11,12,13,1
4
8,10
7. 3,6,10,14 1,2,4,7,8,9,1 0,11,12,13,1
4
10,14
8. 8,13,14 1,2,4,7,8,9,1 0,11,12,13
8,13
9. 4,9,12,13 1,2,7,9,11,13 9,13
10. 4,12,13 1,2,4,7,9,11, 13
4,13
11. 9,12,2 1,2,7,9,11,13 2,9
12. 2,9,11,12 1,2,7,11 2,11
13. 12,13 1,2,4,7,9,11, 12,13
12,13
14. 2,7,11 1,2,7 2,7
15. 1,7 1,7 1,7
16. 1,2,3,4,6,7,8,9, 10,11,12,13,14
1 1
17. 2,3,4,6,7,8,9,1 0,11,12,13,14
1,2 2
Table 6 : Iteration IV
S. No .
Reachability set
Antecedent set Interse
ction set
Iterat ion/ Level s
4.
10 1,2,4,7,8,9,10,1 1,12,13,14
10
IV
5.
6,10 1,2,4,6,7,8,
9,10,11,12,13,1 4
6,10
6.
6,8,10 1,2,4,7,8,
9,10,11,12,13,1 4
8,10
7. 6,10,14 1,2,4,7,8,9,10,1 1,12,13,14
10,14
8. 8,13,14 1,2,4,7,8, 8,13
9,10,11,12,13
9. 4,9,12,13 1,2,7,9,11,13 9,13
10.
4,12,13 1,2,4,7,9,
11,13
4,13
11. 9,12,2 1,2,7,9,11,13 2,9
12. 2,9,11,12 1,2,7,11 2,11
13. 12,13 1,2,4,7,9,
11,12,13
12,13
14. 2,7,11 1,2,7 2,7
15. 1,7 1,7 1,7
16. 1,2,4,6,7,8,9,10, 11,12,13,14
1 1
17. 2,4,6,7,8,9,10,11 ,12,13,14
1,2 2
Table 7 : Iteration V
Sr. No.
Reachability set
Antecedent set
Intersection set
Itera tion
6. 8 1,2,4,7,8,9,1
1,12,13,14
8
V
7. 14 1,2,4,7,8,9,1
1,12,13,14
14
8. 8,13,14 1,2,4,7,8,9,1 1,12,13
8,13
9. 4,9,12,13 1,2,7,9,11,13 9,13
10. 4,12,13 1,2,4,7,9,11, 13
4,13
11. 9,12,2 1,2,7,9,11,13 2,9
12. 2,9,11,12 1,2,7,11 2,11
13. 12,13 1,2,4,7,9,11, 12,13
12,13
14. 2,7,11 1,2,7 2,7
15. 1,7 1,7 1,7
16. 1,2,4,7,8,9,11, 12,13,14
1 1
17. 2,4,7,8,9,11,12 ,13,14
Table 8 : Iteration VI
Sr. No.
Reachability set
Antecedent set
Intersection set
Itera tion
8. 13 1,2,4,7,9,11,
12,13
13
VI
9. 4,9,12,13 1,2,7,9,11,13 9,13
10. 4,12,13 1,2,4,7,9,11, 13
4,13
11. 9,12,2 1,2,7,9,11,13 2,9
12. 2,9,11,12 1,2,7,11 2,11
13. 12,13 1,2,4,7,9,11,
12,13
12,13
14. 2,7,11 1,2,7 2,7
15. 1,7 1,7 1,7
16. 1,2,4,7,8,9,11, 12,13,14
1 1
17. 2,4,7,8,9,11,12 ,13,14
[image:8.595.38.558.83.353.2]1,2 2
Table 9 : Iteration VII
Sr. No.
Reachability set
Antecedent set
Intersection set
Itera tion
9. 4,9 1,2,7,9,11 9
VII
10. 4 1,2,4,7,9,11 4
11. 9,2 1,2,7,9,11 2,9
12. 2,9,11 1,2,7,11 2,11
14. 2,7,11 1,2,7 2,7
15. 1,7 1,7 1,7
16. 1,2,4,7,8,9,11, 14
1 1
[image:8.595.317.545.363.577.2]17. 2,4,7,8,9,11,14 1,2 2
Table 10 : Iteration VIII
Sr. No.
Reachability set
Antecedent set
Intersection set
Itera tion
9. 9 1,2,7,9,11 9
VIII
11. 9,2 1,2,7,9,11 2,9
12. 2,9,11 1,2,7,11 2,11
14. 2,7,11 1,2,7 2,7
15. 1,7 1,7 1,7
16. 1,2,7,8,9,11,14 1 1
17. 2,7,8,9,11,14 1,2 2
Table 11 : Iteration IX
Sr. No.
Reachability set
Antecedent set
Intersection set
Itera tion
12. 11 1,7,11 11
IX
14. 7,11 1,7 7
15. 1,7 1,7 1,7
16. 1,7,8,11,14 1 1
12. 11 1,7,11 11
Table 12 : Iteration X
Sr. No.
Reachability set
Antecedent set
Intersection set
Itera tion
14. 7 1,7 7 X
15. 1,7 1,7 1,7
16. 1,7,8,14 1 1
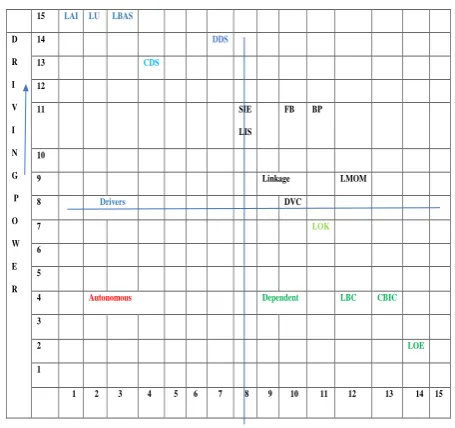
4.4
Classification of factors
Fig. 4 below shows the driving power and dominance diagram.
Fig . 4: Driving power and dependence diagram
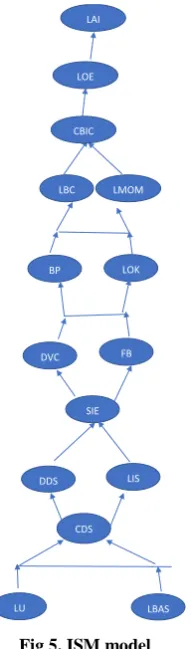
4.5
ISM model
An ISM model is developed ( as shown in fig. 5 below ) after arranging the elements as per their interaction or dependence relationships.
15 LAI LU LBAS
D R I V I N G P O W E R
14 DDS
13 CDS
12
11 SIE
LIS
FB BP
10
9 Linkage LMOM
8 Drivers DVC
7 LOK
6
5
4 Autonomous Dependent LBC CBIC
3
2 LOE
1
[image:8.595.37.297.381.723.2]Fig 5. ISM model
5.
MANAGERIAL IMPLICATIONS &
CONCLUSIONS
This research may help manufacturing companies to develop business policies related to big data analytics in supply chains. It may also lead to the exploration of barriers to big data analytics in service companies.
6.
ACKNOWLEDGMENTS
Our thanks to the anonymous reviewers whose comments have helped us in improving the manuscript . Authors are also thankful to Prof. S.P Singh of IIT Delhi, India in disseminating the knowledge about ISM methodology which helped the authors substantially while preparing the manuscript.
7.
REFERENCES
[1] Kaisler, S., Armour, F., Espinosa, J. A., & Money, W. 2013. Big data: Issues and Challenges moving forward. 46th Hawaii international conference on system sciences (HICSS), 995–1004. Wailea, Maui, HI: IEEE.
[2] Syed, A. R., Gillela, K., & Venugopal, C. 2013. The future revolution on big data. .International Journal of Advanced Research in Computer and Communication Engineering, 2(6), 2446–2451.
[3] LaValle, S., Lesser, E., Shockley, R., Hopkins, M. S., & Kruschwitz, N. 2013. Big data, analytics and the path from insights to value. MIT Sloan Management Review, 52 (2), 21–31.
[4] Zakir, J., Seymour, T., & Berg, K. 2015. Big data analytics. Issues in Information Systems, 16(2), 81–90.
[5] Stedman, C. 2014. Enterprises take a long view on big data programs and purchases. TechTarget Search Business Analytics <http://searchbusinessanalytics.
[6] Loshin D. 2015. Comparing the leading big data
analytics software options.
http://searchbusinessanalytics.techtarget.com/feature/Co mparing-theleading-big-data-analytics-software-options.
[7] IBM(2013. What is big data? - Bringing big data to the enterprise<http://www. ibm.com/big-data/us/en/>.
[8] Ransbotham, S., Kiron, D., Prentice, P.K. 2015. The talent dividend: analytics talent is driving competitive advantage at data-oriented companies. MIT Sloan Management Review, 56(3),63–68.
[9] Thong , J.J. 1999. A n integrated model of information system adoption in small businesses , Journal of management information systems , 15 (4) , 187-214.
[10] Ramayah , T. , Mohamad , O. , Omar , A. and Marimuthu , M. 2009. technology adoption among small and medium enterprises (SME s) : a research agenda , World academy of science , Engineering and technology Journal , 41 , 943-946.
[11] Storey, D.J. 1997. Understanding the Small Business Sector. London: International Thompson Business Press.
[12] Biesdorf, S., Court, D., & Willmott, P. 2013. Big data: What’s your plan?: Insights & Publications<http://www.mckinsey.com/insights/busines s_technology/big_data_whats_your_plan>
[13] Bell, L. 2014. IDF: Intel announces A-Wear to push big data apps via Internet of Things: . The INQUIRER<http://www.theinquirer.net/inquirer/news/23 64331/idfintel-announces-a-wear-to-push-big-data-apps-via-internet-of-things>.
[14] Provost F, Fawcett T. 2013. Data science and its relationship to big data and data-driven decision making. Big Data , 1, 51–59. doi:10.1089/ big.2013.1508.
[15] Manyika J, Chui M, Brown B, Bughin J, Dobbs R, Roxburgh C, Byers AH. 2011. Big data: the next frontier for innovation, competition, and productivity. McKinsey Global Institute.
[16] Coleman , S. , Gobb, R. , Manco, G. Pievatolo, A. , Martorelle, X.T. , Reisf , M.S. 2016. How Can SMEs Benefit from Big Data? Challenges and a Path Forward, special issue article , quality, reliability and engineering international , DOI: 10.1002/qre.2008
[17] Ghobakhloo , M., Sabouri MS, Hong, T.S., Zulkifli N. 2011. Information technology adoption in small and medium sized enterprises: an appraisal of two decades literature. Interdisciplinary Journal of Research in Business , 1(7), 53–80.
[18] Russegger, S, Freudenthaler , B, Güntner G, Kieseberg P, Stern H, Strohmeier F. 2015. Big Data und Data-driven Business für KMU. Digital networked Data - Verein für Innovation und Erforschung vernetzter digitaler Daten: Salzburg, Austria.
[19] Zhu, K., Kraemer, K., Zhu , S. 2002. A cross -country Study of Electronic Business Adoption using the Technology-organization- Environment framework , Proceedings of Twenty -third International Conference
BP
SIE
LIS
LBAS DDS
CDS
LU
DVC FB
LOK LMOM LBC
on Information Systems, December 15-18, Barcelona, Spain.
[20] Matlay, H. and Addis , M. 2003. Adoption of ICT and e- commerce in small business : an HEI based consultancy perspective , Journal of small business and enterprise development , 10(3) , 321-335.
[21] McAfee, A., Brynjolfsson, E. 2012. Big data: the management revolution. Harvard Business Review , 90 , 61–68.
[22] Capgemini 2012. Measuring organisational maturity in predictive analytics: the first step to enabling the vision. Capgemini, Paris. https://www.capgemini.com/resource-fileaccess/resource/pdf/Measuring_Organizational_Matu rity_in_Predictive_Analytics__the_First_Step_to_Enabli ng_the_Vision.pdf
[23] Viuker, S. 2015. Cybercrime and hacking are even bigger worries for small business owners. The Guardian. http://www.theguardian.com/business/2015/jan/21/bcybe rsecurity-small-business-thwarting-hackers-obama-cameron
[24] Edwards, G. Cyber security threats and data loss: hacker
attacks on SMB organizations.
http://blog.watchpointdata.com/cyber-securitythreats-and-data-loss-hacker-attacks-on-smb-organizations/
[25] Rains, T. 2014. Cyber threats to windows XP and guidance for small businesses and individual consumers. https://blogs.microsoft.com/ cybertrust/2014/03/24/ cyber-threats-to-windows-xp-and-guidance-for-small-businesses-and-individual-consumers/
[26] Lacey, D., James, B.E.2010. Review of Availability of Advice on Security for Small/Medium Sized Organisations. Information Commissioner’s Office: Wilmslow, UK.
[27] Davidsson, P. 1989. Entrepreneurship – and after? A study of growth willingness in small firms. Journal of Business Venturing , 4, 211–226.
[28] Pissarides, F. 1999. Is lack of funds the main obstacle to growth? EBRD’s experience with small- and medium-sized businesses in central and eastern Europe. Journal of Business Venturing, 14(5), 519–539. doi:10.1016/S0883-9026(98)00027-5.
[29] Bartlett, W., Bukvić, V. 2001. Barriers to SME growth in Slovenia. Economic Policy in Transitional Economies, 11(2), 177–195. doi:10.1023/A:1012206414785.
[30] Muthaih K, Venkatesh S. 2012. A study on the barriers affecting the growth of small and medium enterprises in India. International Journal of Research in Computer Application Management , 2(1), 77–81.
[31] Sutanonpaiboon , J. and Pearson A.M. 2006. E- commerce adoption : perception of managers and owners of small and medium enterprises (SME s ) in Thailand , journal of Internet commerce , 5 (3) , 53-82 .
[32] Writz, J., Wong , P.K. 2001. An empirical study on internet based business to business e- commerce in Singapore , Singapore management review , 23 (1) , 87-112.
[33] Jones , M.C. and Beatty , R.C. 1998. Towards the development of measures of perceived benefit and compatibility of EDI : a comparative assessment of competing first order factor models , European journal of information systems , 7 (3) , 210-220.
[34] Shakir M , Smith , G.R and Gulee , E. 2007. E procurement : Reaching out to small and medium business , MIS quarterly executive , 6 (4) , 225-238.