Using Regression Analysis to Identify the Predictive
Ability of the Achievement Test and the Secondary
School Rate in the Prediction of the Cumulative Rate
Ahmed Saied Rahama Abdallah
College of Business Administration-Hotat Bani TamimPrince Sattam Bin Abdu-Alaziz University, K.S.A
ABSTRACT
this study aimed to identify the predictive ability of the achievement test and the secondary school rate in the prediction of the cumulative rate of scientific specialization for students of the Faculty of Science at Prince Sattam Bin Abdul-Aziz University. The data of the study was collected from the Deanship of Admissions and Registration for the academic year (2017-2018). The sample of the study was (180) students. Linear regression was adopted in the data analysis. The results revealed a positive correlation between the secondary school rate and the university cumulative rate. A positive and weak correlation between the achievement test and the university cumulative rate was found. In addition, the secondary school rate and achievement tests were able to predict the cumulative rate in the specializations of mathematics, chemistry, and biology. The study recommended reconsidering the policy of admitting students in Saudi universities by adding other criteria besides the secondary school rate and the achievement test suited to the nature of each university.
Keywords
predictive ability, achievement test, secondary rate, cumulative rate
1.
INTRODUCTION
University admission policy is one of the most pressing issues for education in any society because the criteria for admitting students in institutions of higher education are a problem facing most societies. Graduates from secondary school and the number of those wishing to enroll in university education. Statistics indicate that the number of students of higher education has increased rapidly in the Arab countries during the past three decades [1]. Recently, the desire to enroll in higher education has grown, leading to a high percentage of secondary school entry to universities. It is known that the lack of centralization in the tests inevitably leads to discrepancies in the evaluation among schools, which negatively affects justice and equality in opportunities in university education [2].
Despite the steady expansion of university education in Saudi Arabia, a number of majors are gaining more demand in the labor market and have the largest share of competition in admission which varies across Saudi universities. Some universities adopt only the second rate for admission; others depend on their own tests and another group use test offered by the National Centre for Measurement and Assessment (NCMA) in addition to secondary school rate. The NCMA was established to standardize admission criteria among Saudi universities including Prince Sattam bin Abdul-Aziz University (PSAU) (NCMA[3]
Most of the scientific research was concerned with the study of the predictive power and predictive honesty of secondary
school tests, achievement test, and general aptitude test, but the results of the research were contradicted. Most of them did not arrive at decisive decisions about the ability of the criteria used to admit students to predict the cumulative average and confirm their predictability. Therefore, the current study focuses on the role of the achievement test and the secondary school rate in the prediction of the cumulative rate, and to continue the efforts of researchers to evaluate the efficiency of the admission criteria used in science faculties at PSAU, especially in scientific disciplines.
2.
THE OBJECTIVES OF THE STUDY
This study aims to identify the predictive ability of the achievement test and the secondary school rate in the prediction of the cumulative rate of scientific specialization for students of the Faculty of Science at PSAU. The data of the study were collected from the Deanship of Admissions and Registration at PSAU in the academic year (2017-2018).
3.
METHODS AND MATERIALS:
3.1 Source of Data
The data of the study were collected from the Deanship of Admissions and Registration at PSAU in the academic year (2017-2018). The collected data of the students included the achievement test, the secondary school rate, and the cumulative rates of students of the faculties of science.
3.2 Sample size and the study population
The study population included all the students of the final year in the faculties of science with a specialization in chemistry, physics, biology, and mathematics at the PSAU with its various branches, namely students of the eighth level. The sample size was (186) students.
3.3 The variables of the study
3.3.1The dependent variable:
The dependent variable is the cumulative average and represents the predicted variable and its symbol is Y.
3.3.2Independent variables:
Secondary rate(X1), achievement test(X2), they represent the predictive variables.
4.
REGRESSION MODEL
for estimating classic model parameters is the ordinary least squares (OLS) [4]
According to Wiley [5], the simple linear regression model consists of the mean function is written as follows:
E(Y |X = x) = β0 + β1x (1)
The parameters in the mean function are the intercept β0, which is the value of E(Y |X = x) when x equals zero, and the slope β1, which is the rate of change in E(Y |X = x) for a unit change inX. In most applications, parameters are unknown and must be estimated using data.
4.1 The Variance of the Model is:
Var(Y |X = x) = σ 2 (2)
The variance function in the above equation is assumed to be constant, with a positive value σ2 that is usually unknown. The difference between the observed data and the expected value, statisticians have invented a quantity called a statistical error, or ei for case i defined implicitly by the equation
yi = E (Y |X = xi ) + ei or explicitly by ei = yi − E (Y |X = xi). The errors ei depend on unknown parameters in the mean function and so are not observable quantities. They are random variables and correspond to the vertical distance between the point yi and the mean function E(Y |X = xi ). Errors are often assumed to be normally distributed, but normality is much stronger than we need. Parameters are unknown quantities that characterize a model. Estimates of parameters are computable functions of data and are therefore statistics. Depending on Ordinary Least Square (OLS) method, the simple linear model can be estimated as:
i =_E(Y |X = xi ) = ˆβ0 + ˆβ1xi (3)
4.2 Determination coefficient (R
2)
R-square explains the power of variation in the relationship between two (or more) variables, Sometimes R2 is called the coefficient of determination, and we can estimate it using the formula:
R2 = (4)
Which is the square of the multiple correlation coefficient R. As the number of independent variables increases, the R2 value also increases, so R2 cannot be a good measure for the goodness of model fit [6].
R2 value tells you how much variation is explained by your model (whether the predictors are sufficient in explaining the variation in the response). So 0.1 R2 means that your model explains 10% of variation within the data. The greater R2 the better the model. In addition, the coefficient of determination measures the percentage of variability in Y that can be explained through knowledge of the variability in the independent variable X [7].
4.3 The T-test
We use the t-test to test the significance of the coefficient of the simple regression.
we can test the following hypothesis and alternative hypothesis:
H0: β1 = 0
H1: β1 ≠ 0,
And we will depend on the following formula to compute the t-statistics as:
T0 = (ß1/(√se(ß1))) (5)
The p-value will appear in the outputs compare with the level of significance (0.05) or (0.01), if the p-value is less than the level of significance the estimated coefficient of the model statistically is significant.
4.3 Multiple Linear Regression Model
Multiple regression analysis focused on the relationship between the response variable and explanatory variables. According to [7] multiple regression equation could take the form:
Y= B0+B1X1+B2X2+…….+BkXk+ Ɛ j (6)
The parameters ß0, ß1, . . ., ßk are called regression coefficients, Ɛ provides for random variation in y not explained by the x variables. This random variation may be due partly to other variables that affect y but are not determined in the model.
The X’s are the independent variables. Y is the dependent variable. The β’s are the coefficients of regression need to be estimated. The εj is the error term or the residuals of the model. Although a number of techniques may solve the regression problem, the most-used method is least squares. In the least-squares regression analysis, the b’s are selected to minimize the sum of the squared residuals.
4.3.1 The F-test:
For a multiple regression model with intercept, we want to test the following hypothesis and alternative hypothesis:
H0: β1 = β2 = ... = βp-1 = 0 H1: βj ≠ 0, for at least one value of j
This test is known as the overall significance of the estimated regression model depending on the formula, which could be written as
F = MSM / MSE = (explained variance) / (unexplained variance) (7)
If the assumptions of the statistical model for linear regression are appropriate and if the null hypothesis (H0: β1 = β2 = ... = βp-1 = 0) is true, the ratio
F = MSM / MSE has an F distribution with df =1, n-2. When H0 is true, MSR and MSE are each estimator of σ 2.
5.
LITERATURE REVIEW
Several countries depend on standard tests to admit students in higher education [8]. These standard tests include aptitude or achievement tests or both of them. The former concentrates on evaluating spoken and logical capabilities, and they are general. The latter refers to tests used to assess applicants' achievement and they are built on specific guides and notions students will study in their future. Moreover, students who score high in these standard tests are qualified to prevail in their formal study. Since the forecasting force of this teste, they are given high attention form educational institutions [9].
Standardized tests are beneficial in terms that they lend a sense of standardization, efficacy, and chance. Standardization reduces the discrepancy in secondary school curricular, content and grading system. Efficacy has the potentiality of eliminating the costs and time. Chance enables students to show their abilities despite their low marks.
5.1 Admission Criteria in Higher
Education:
Many Arab countries rely on the acceptance of their students for higher education on a set of criteria and requirements that must be applied to all secondary school graduates in order to determine their scientific path in universities and colleges. Aldosary [10] pointed that there are standards in the Gulf countries for admission such as Admission tests introduced by universities, year of graduation, certificate of good conduct from secondary school graduate student, pass the interview and the student's desire. The acceptance policies of universities in the Arab world varied according to the specific regulations of each country, but they are generally influenced by Western experiences. They have two features: instability in orientation and standards, and the growing tendency to make admission more open or open to balance equal opportunity in the sense of certainty of its ability on the development of human resources, which represent the most complex development cycles [11].For example, in Tunisia, university admission requires obtaining a high school diploma in addition to two criteria: the degree of the student in the subjects of specialization and grades required in the last two years of secondary school. In Syria, admission is made according to the following criteria: obtaining a secondary school certificate or equivalent and success in the admission competition in some colleges that require it [12]. In Yemen, admission is made according to the following criteria [13]. the student must have a secondary school qualification or equivalent according to the admission guide, if he has not graduated more than four years, For the percentages in the faculties of the university and its specialties. In Sudan [14], admission is accepted on the basis of the success in the subjects from which the percentage of admission to the given college is calculated, passing the capacity test required for admission to some colleges. In Egypt [15], applicants are accepted according to the grades of the general secondary certificate. Technical certificates are accepted in the appropriate colleges. Admission rates vary among universities in Egypt.
5.2 Admission System in the Universities of
Saudi Arabia
Admission to Saudi universities is required to obtain a high school diploma or equivalent, pass the medical examination, success in the personal interview or acceptance tests for each college if any. Each university, but each college and department at the university apply different admission tests, each with its own tests. Moreover, these tests are not subject to the status and evaluation of the performance of students of scientific procedures and controls determined by the science of measurement except for a few of them. A student is not able to prepare for the test in any way, and he may not know what the mark he achieved, in particular, whether he passed or failed. In addition, the academic institutions are unaware of weaknesses in the test. These academic institutions cannot be blamed for this weakness, because they are found to teach capable students and not to discover their abilities before joining them. Such demand requires concerted efforts by specific stakeholders and requires achieving justice,
consistency and quality control at the higher education level in the Kingdom. Apply it. In addition, the student had to travel through the vast area of Saudi Arabia, and in a short time to perform the admission tests in different universities, and often coincided with the introduction of acceptance tests in more than one hand and the student lost valuable opportunities because there was a need to standardize tests. Therefore, the many tests offered by each university have been dispensed with. Relying on standardized tests in addition to the secondary level. This task was assigned to the National Center for Measurement and Evaluation, which was established in the year 2000. The student's admission is immediately accepted to the required specialization at the university or college. The weighted average is calculated between secondary and general abilities. In order to facilitate this process, each university and each college has developed a web page of its own to provide the student with the required specialization and to enter the secondary level and the degree of its examination in the general abilities exam. On the original certificates and compare them with the data entered by the student on the university or college website. There are some disciplines that require, in addition to general capacity tests, to pass an achievement test, such as the Faculty of Medicine, Pharmacy, Health Colleges and Faculty of Science [16]
5.3 Previous Studies
Morgan [17], conducted a study aimed at identifying the ability of some variables to predict the cumulative rate, the sample of the study consisted of (469) students from the University of Louisiana, the results showed that the secondary school rate was the most effective predictor of the cumulative average. Hoda study [18] aimed to analyze the motivation factors associated with academic success and perseverance among Indiana University students for the academic year 2000-2001. The degree of admission exam, student gender, age, race, and material income, and the first-year cumulative GPA was the most predictive of the number of semesters the student completes while studying at the university.
In the same line, Saud [2] found that the general aptitude test correlated with the university cumulative average for the first year of scientific specializations. He also found that the correlation between the achievement test of the scientific colleges and the cumulative rate was positive and moderate.
The study of Al-Ghamdi[19] aimed to know the characteristics of the ability test and the criterion of secondary and their ability to predict the cumulative average of students of Umm Al-Qura University. The study sample consisted of (1672) students. The most important results: There is a statistically significant relationship between the admission criteria (secondary rate, general abilities test) and the passes of success (quarterly and cumulative rates), and that the secondary rate criterion is one of the most important criteria for predicting academic success.
Al-Shehri [21] conducted a study aimed to evaluate the admission criteria used in Taif University: secondary rate, aptitude test, achievement test and cumulative rate prediction through these criteria. The results showed that the secondary rate ranked first; followed by the achievement test, and then the general aptitude test came in third rank. This indicates the importance of the secondary rate in explaining the variation in the cumulative rate.
Similarly, Sahli [22] aimed to identify the predictive ability to test the general abilities and the test of secondary school cumulative rate of Saudi university students, and the sample of the study consisted of final year students at King Saud University and Imam Muhammad bin Saud University. The sample size was (2384) male and female students. The results indicated a positive and statistically significant relationship between the student's cumulative GPA and his score in the ability test. The study also found a positive correlation between the student's cumulative GPA and his score in the high school test.
Lemon [23] conducted a study aimed at detecting the predictive capacity of the cumulative GPA at the end of the basic stage at the rate of secondary school, and the sample of the study included (2752) students from the eighth, ninth and tenth grade in Karak governorate, Jordan. The study concluded that the correlation coefficients between the study variables were statistically significant and therefore the cumulative GPA at the end of the basic stage can be used as a basic criterion in classifying students into three academic disciplines: scientific, literary, management and information technology.
Bashiwa [24] also conducted a study aimed to predict the student's cumulative GPA through the Aptitude Test, High School Average and Achievement Test. The study sample consisted of (142) students from Hail University. The results of the study showed that the achievement test ranked first and explained the highest value of variation in the secondary school exam. The results also showed the ability of both variables, students’ degree in the aptitude test and the student's secondary school scores, to predict the cumulative average of the student in the final year at the university.
Al-Naimi study [25] aimed to detect the predictive ability of the secondary rate and achievement test and test the general abilities in the prediction of the university cumulative average of graduates of Imam Muhammad bin Saud Islamic University. The sample of the study consisted of (3527) students. The study revealed that the achievement test was the most predictive of the total study sample; the secondary rate was the most predictive of the forensic colleges, the most predictive was the achievement test for the faculties of natural sciences and the faculties of humanities.
Alkahtani and Adam[26] investigated the causes of low success average of the students in addition to scoring higher grade point average (GPA). The study concluded that there appeared a significant positive and weak relationship between the high school grades average and the university GPA. The students who scored good grades in school also recorded good grades in university. It was also found that there was augmentation tendency of grades to the students in university compared to their real mathematical skills. Sulphey [27] examined the correlation between the admission grades (high school GPA and GAT) of Saudi college students and their academic attainment. The findings revealed that there is a strong correlation between the admission grades and the two variables.
Several studies have empirically confirmed the relationship between future academic performance and the merging both standardized test marks and high school GPA. Results showed that the combination even outperformed either of the one in a consistent manner Wiley [5], Burton and Ramist [28], Julian [29], Kobrin, Patterson[30], Kuncel, Crede, and Thomas [31], Noble [32]. For instance, Kobrin [30] revealed an accumulative increase in the predictive validity by .08 when the two combined. Burton and Ramist [28] assessed the ability of standardized tests and high school GPA to predict future performance. The study concluded that a combination of both the scores could make significant and precise contributions to predict first-year GPA, cumulative college GPA, as well as graduation. It was also found that the anticipation accuracy increased with the augmentation of the two or either of them. Both were able to predict even specific academic conduct at college like distinction and other departmental honors.
6.
STATISTICAL ANALYSIS
6.1 Characteristics of sample members
The results in the table below illustrates the frequencies and percentages of the sample members. There were 81 students with percent (43.5) belong to mathematic department, 52 with (28%) belong to biology department, 27 with (14.7%) belong to chemistry department, and 26 students with (14%) belong to physics department. The gender for the respondents showed (154) with (82.8%) were males and (32) with (17.2%) were females.
Table (1): Frequency distribution according to specialization and sex of respondents
Percentage Frequency
Specialization
5.34 18
Math
8534 72
Chemistry
7132 47
Biology
8532 72
Physics
Gender
82.8 154
Male
8237 32
Female
822 812
Total
6.2 Variable checking
Table (2): descriptive statistics of all variables
N Skewness Kurtosis
statistic statistic Std.Error statistic Std.Error
y 186 0.742 0.178 0.217 0.355
X1 186 -1.043 0.178 0.693 0.355
X2 186 0.548 0.178 1.400 0.355
Valid N
186
6.3 Simple Linear Regression:
Table (3) shows the results of the simple regression. There is a positive correlation between the secondary school rate and the university cumulative rate. The value of the determination coefficient (R2) indicates that secondary school rate explains 19% of the variation in the cumulative rate, and 81% of the variation remains unexplained. The correlation coefficient of Pearson indicates a positive correlation between the Secondary rate and the university cumulative rate. The value of the t-test with p-value 0.0001 confirms the statistical significance of the simple regression coefficient rate of the secondary school rate.
Table (3): Simple Linear Regression for the Secondary School Rate
D. W p-value T B R2 R Variable
8352 232228 236 23257 2386 2352 Secondary rate
Table (4) presents the results of another simple regression. It shows a positive correlation between the achievement test and the university cumulative rate. The value of the R2 indicates that the achievement test explains 9.4% of the variation in the cumulative rate and 90.6% left unexplained. The correlation coefficient of Pearson indicates a positive correlation between the achievement test and the university cumulative rate. The value of the t-test confirms the statistical significance of the simple regression coefficients for the achievement test.
Table (4): Simple linear Regression for the Achievement test
VIF P-value
T-value ß R2 Correlation
coefficient Variable
8347 23222. 53. 232.6 23265 23.8
Achievement test
6.4 Multiple Linear Regression:
Table (5) displays the results of the multiple regression analysis of the secondary school rate and the achievement test in the prediction of the university cumulative rate of students in the scientific disciplines of mathematics, chemistry, biology, and physics. The value of the R2 indicates that both the achievement test and the secondary school rate explain (23%) of the variation in the cumulative rate, and 77% of the variation in the cumulative rate is left unexplained. It is considered a weak explanatory force and the estimated regression model is statistically significant according to the F-test value (27.16) with p-value (0.0001).
To check out the Multicollinearity which the value of the VIF (Variance Inflation Factor), If VIF < 10 for a particular independent variable multicollinearity is not considered a problem otherwise we should drop that variable. The values of VIF is equal (1.0771) for X1 and (1.822) for X2, which means that no need to drop any of the variables.
Table (5): Multiple linear Regression
VIF(X2) VIF(X1)
p-value F D.W ß 2 ß 1 ß0 R2 Variables
1.82 1.0771 232221 72382 8356 23274 0.036 -1.68 237. Secondary
rate and Achievement
test
6.5 Diagnosis of Residuals
To make a residual analysis to see how it will perform, first we draw a graph in such the predicted values of (on x-axis) with the residuals to see if there is an equal variance for the residuals or not. Figure (1) showed there is no increasing or decreasing pattern, which means that they have equal variances.
Figure (1): Plotting Residuals Variance
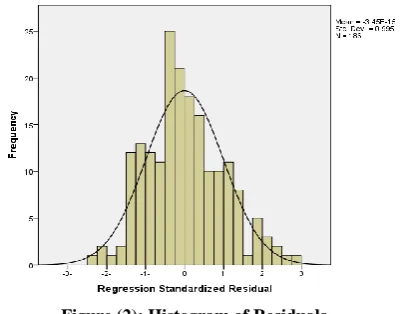
Second, normality of the residuals has been checked, and this will be done graphically and numerically. Graphically, a histogram was drawn for residuals. Figure (2) shows the symmetry, and indicates that residuals follow the normal distribution.
Figure (2): Histogram of Residuals
Another graph is illustrated below figure (3), which shows the same result as the previous one. Therefore, those difference-plotted residuals do not show any problem with the estimated regression model.
-2 -1 0 1 2
0 2 4 6
Residual
[image:5.595.302.554.153.243.2] [image:5.595.325.535.327.457.2] [image:5.595.66.268.362.416.2] [image:5.595.331.533.544.701.2] [image:5.595.59.275.545.613.2]Figure (3): Normal-Q Plot of Standardized Predicted Value
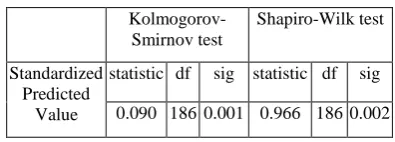
Numerically, by using Kolmogorov-Smirnov and Shapiro-Wilk tests show p-values of (0.001), (0.0002) respectively in the table (6) which are less the level of significance (0.05), hence the residuals of the multiple regression is normally distributed.
Table (6): Tests of Normality
Kolmogorov-Smirnov test
Shapiro-Wilk test
Standardized Predicted
Value
statistic df sig statistic df sig
0.090 186 0.001 0.966 186 0.002
a. Lilliefors Significance Correction
6.6 Multiple linear Regression According to
Specialization
We did a multiple regression according to specialization, the results in table (7) shows that the value of the (R2) indicates both the achievement test and the secondary school rate explain (51%) of the variation in the cumulative rate of the chemistry, followed by the mathematics with 25%, 20% change in cumulative rate due to change in achievement test and secondary school rate for biology, and only (2%) for physics. The estimated regression models for mathematics, chemistry, and biology were statistically significant according to p- values, whereas the regression model for physics, did not show any statistical significance.
Table (7): Multiple linear regression according to specialization
p-value F D.W ß 2 ß 1 ß0 R2 specialization
23222 632 8344 2328. 2325 2318 2374 Mathematics
23222 8737 8361 23256 23247 -4.6 2348 Chemistry
2322. 2324 8324 23271 232.6 -2.2 2372 Biology
2321 2372 8322 23226 23287 8356 2327 Physics
7.
DISCUSSION
After estimating the simple and multiple regression models of the predictive variables, the following findings are revealed: secondary school rate and the achievement test variables have a positive and a weak correlative relationship with the GPA of the level eight students in the faculties of science. Thus, the secondary school rate and achievement tests have the ability to predict the cumulative average in mathematics, chemistry, and biology, while physics it cannot rely on the estimated
regression model because it is not statistically significant. This result accords with the result of Sahli (2012) and Huda (2006).
The secondary school rate explains (19%) of the variation in the cumulative average for students of the faculties of science with their different specialties, while the achievement test explains (9.4%). Their explanatory power together reached (23%) through the multiple regression model. This may be due to poor coordination between secondary and university curricula, and the gap between curricula in secondary school and university. Secondary schools’ examinations measure knowledge associated with lower mental abilities such as memory, understanding, and application with little focus on higher-order skills such as analysis, synthesis, and evaluation. University curricula focus on learning and learning processes related to higher mental abilities, (Tests and training, scientific research, applied graduation projects). This variation may also be attributed to the nature of the secondary school tests that are left to schools rather than to the Ministry. This may result in varying levels of tests and marking standards according to differences in schools and districts. This result is in line with that of Bashwa (2014).
The ability of the secondary school rate and the achievement test in mathematics and chemistry is greater in predicting the cumulative rate of the student than in biology. This variation may be attributed to the number of students in different disciplines. The number of students in mathematics and chemistry is more than their number in biology. The secondary school rate and the achievement test failed in the prediction of the cumulative rate of physics because of the insignificance of the estimated model. This may be due to the small number of students who enter the department of physics.
8.
CONCLUSION
The study conducted in the college of Science in PSAU, Saudi Arabia. The study conclude that the secondary school rate and achievement test had ability to predict the cumulative rate of the students in the college of science. The estimated regression models of chemistry, mathematics, and biology had a statistical significant, while physics was insignificant.
9.
RECOMMENDATIONS:
Based on the findings, we recommend the following:
Reconsidering the policy of admitting students in Saudi universities by adding other criteria besides the secondary school rate and the achievement test suited to the nature of each university.
The Ministry of Education should consider legislation and enact other standards according to the nature of the university and specialization, such as placement test of each university, a special written test for each specialty, personal interviews of applicants, or any other criteria as the university deems fit.
Raising students' awareness of the importance of the secondary school rate, the achievement test and other criteria required in admission to university education.
[image:6.595.99.249.73.192.2] [image:6.595.67.265.293.364.2] [image:6.595.68.267.561.646.2]10.
REFERENCES
[1] Gharaibeh, Faisal Mahmoud 2001. Educational policies and the role of university education in preparing people to face the latest developments, Journal of Educational and Psychological Sciences, No. 2.
[2] Al-Saud, Faisal bin Abdullah Al-Mashari .2009. 3Development of criteria for acceptance of students in Saudi Universities: The experience of the National Center for Measurement and Evaluation in University education, Working Paper at the Arab Regional Conference (Towards an Arab Space for Higher Education - Global Challenges and Community Responsibilities), Cairo, Egypt.
[3] Student training manual for capacity testing 3 7222
3 National Center for Measurement and Evaluation in Higher Education, Kingdom of Saudi Arabia, Riyadh.
[4] Tu YK, Kellett M, Clerehugh V.2005. Problems of correlations between explanatory variables in multiple regression analyses in the dental literature. British Dental Journal; 199 (7):457–461.
[5] Wiley, A. 2014. Student success in college: How criteria should drive predictor development. Proceedings of the First International Conference on Assessment & Evaluation, Riyadh: The National Center for Assessment in Higher Education.
[6] The R Project for Statistical Computing:
http://www.r-project.org).
[7] John E.H., Dean W.W. 2009. Business forecasting, Pearson Prentice hall, 6th edition
[8] Curtis, D.2007. Correlation of admission criteria with academic performance in dental students. Journal of Dental Education, 71(10).
[9] Evans, B. J. 2012. College Admission Testing in
America. Retrieved
fromhttps://cepa.stanford.edu/sites/default/files/Draft
%20of%20College%20Testing%20in%20America.pdf
[10] Al-Dosari, Saleh. 1989.Studying the standardization of the conditions of admission of students in the universities of the member countries of the Arab Bureau of Education for the Gulf States, the Arab Bureau of Education for the Gulf States, Riyadh.
[11] Al-Khashab, Abdul-Ala Yusuf and Al-Ashab, khalis.2002. To accommodate the increasing numbers of applicants for higher education 3Paper presented to the Eighth Conference of Ministers Responsible for Higher Education and Scientific Research in the Arab World, Cairo.
[12] Arab Organization for Cultural and Scientific Education.2005. Department of Education Programs, Union of Arab Universities: a guide to the systems of study and equivalence of certificates in Arab universities, Tunisia.
[13] University of Sana'a 2004. Deanship of Admission and Registration: University Admission Guide for the year 2004/2005.
[14] Ministry of Higher Education and Scientific Research in the Republic of Sudan.2005. Guide to admission to higher education institutions for the academic year 2004, General Directorate of Admission, Khartoum.
[15] Ministry of Higher Education, Republic of Egypt, University Admission Coordination Office.2005. Student guide for admission to universities and institutes for the academic year 2005-2006.
[16] Shahry, Mohamed .2007. Honoring the general ability tests and the general secondary certificate examination at the university cumulative average in Saudi Arabia, Master Thesis, Mutah University. Karak, Jordan.
[17] Morgan, D.2005. An investigation of selected academic and nonacademic predictor variables of academic performance of student-athletes at Louisiana State University (Doctoral dissertation). Louisiana: Louisiana State University.
[18] Huda, G. T.2006. An analysis of motivational factors related to academic success and persistence for university students (D.Ed. dissertation). Pennsylvania: University of Pennsylvania.
[19] Al-Ghamdi, Mohammed. 2010.The predictive value of the general and secondary qualifications examination as criteria for acceptance of students at Umm Al-Qura University, Master Thesis, Umm Al-Qura University.
[20] Al-Ghamdi, Mohammed (2010). The Predictive Value of the General and Secondary Qualifications Examination as Criteria for Acceptance of Students at Umm Al-Qura University, Unpublished Master Thesis, Umm Al-Qura University, Makkah
[21] Shahry, Abdullah .2011. The Predictive value of admissions criteria used at Taif University, paper presented to the Arab Organization Conference for Admissions and Registration Officials at Universities in Arab Countries, Al-Hosn University, United Arab Emirates, Abu Dhabi.
[22] Sahli, Mishal Rashid.2012. Predictive ability to test the abilities and test the secondary level at university level among Saudi university students 3Yarmouk University, Master Thesis.
[23] Lemon, Kawther.2013. The predictive ability of the cumulative average at the end of the basic stage at the secondary level, master thesis, Mu'tah University, Amman.
[24] Bashewa, Abdullah .2014. Predictive indicators of admission criteria used in the preparatory year at Hail University: Arab Journal for Quality Assurance of University Education, V 7.
[25] Al-Nuaimi, Izz al-Din Abdullah.2017. The ability of University admission criteria to predict the cumulative accumulation rate of the students of Imam Muhammad Bin Saud Islamic University, Journal of Educational Sciences, vol.2(2).
[26] Alkahtani, Mubarak and Sbeil, Adam 2018. Longitudinal evaluation of University GPA and real performance of mathematics graduates, Asian journal of scientific research 11(4): 506-541.
[28] Burton, N. W. and Ramist, L.2001. Predicting success in college: SAT studies of classes graduating since 1980 (College Board Research Report 2001-02). New York.
[29] Julian, E.2005. Validity of the medical college admission test for predicting medical school performance. Academic Medicine,910 - 917. https://www.ncbi.nlm.nih.gov/pubmed/16186610.
[30] Kobrin, J. L., Patterson, B. F., Shaw, E. J., Mattern, K. D., and Barbuti, S. M. 2008. Validity of the SAT for predicting first-year college grade point average (College
Board Research Report No. 2008-5). New York, NY: The College Board.
[31] Kuncel, N. 2005. A meta-analysis of the validity of the pharmacy college admission test (PCAT) and grade predictors of pharmacy student performance. American Journal of Pharmaceutical Education, 69(3), 47-339.