ISSN Online: 2162-2086 ISSN Print: 2162-2078
DOI: 10.4236/tel.2018.85063 Apr. 9, 2018 888 Theoretical Economics Letters
What Is Statistical Arbitrage?
Marco Lazzarino
*, Jenny Berrill,
Aleksandar Šević
School of Business, Trinity College, Dublin, Ireland
Abstract
Statistical Arbitrage (SA) is a common financial term. However, there is no common definition in the literature while investors use the expression SA for a variety of different strategies. So, what is SA? In order to answer this ques-tion, we investigate SA strategies across equity, fixed income and commodity. The analysis of strategies’ key features indicates that no existing definition fully describes them. To bridge this gap, we identify a general definition and propose a classification system that encompasses the current forms of SA strategies while facilitating the inclusion of new types as they emerge.
Keywords
Statistical Arbitrage, Investment Strategies, Classification
1. Introduction
The concept of arbitrage is fundamental in financial literature and has been used in classical analysis of market efficiency [1][2], whereby arbitrage opportunities are quickly exploited by investors. However, pure arbitrage opportunities are unlikely to exist in a real trading environment [3][4]. An arbitrageur typically engages in a trade that involves some risks. In the specific case where these risks are statistically assessed, then it is appropriate to use the term statistical arbitrage (SA). SA has been broadly investigated in literature, however, scholars either focus on definitions or on developing and testing investment strategies, while we are not aware of any attempt to reconcile these two areas of research. On the one hand, several studies introduce definitions extending the concept of arbitrage through statistics but with little emphasis on strategies [5]-[11]. On the other hand, research on statistically determined arbitrage strategies focuses on models and investment opportunities [12][13] with little or no discussion on definitions and theoretical framework. This leads us to our research question. What is SA?
This paper addresses this question with an in-depth investigation of SA. We How to cite this paper: Lazzarino, M.,
Berrill, J. and Šević, A. (2018) What Is Statis-tical Arbitrage? Theoretical Economics Let-ters, 8, 888-908.
https://doi.org/10.4236/tel.2018.85063
Received: February 2, 2018 Accepted: April 6, 2018 Published: April 9, 2018
Copyright © 2018 by authors and Scientific Research Publishing Inc. This work is licensed under the Creative Commons Attribution International License (CC BY 4.0).
http://creativecommons.org/licenses/by/4.0/
DOI: 10.4236/tel.2018.85063 889 Theoretical Economics Letters begin by reviewing existing definitions of arbitrage, which are reduced to a common framework to analyze and compare them. We survey statistically de-termined arbitrage strategies analyzing both the academic and financial industry research. In total, we review 165 articles on the subject, published between 1995 and 2016. Particular attention is paid to hedge funds techniques, market neutral investment strategies and algorithmic trading. The strategies are discussed in a standardized way analyzing equity, fixed income and, for the first time, com-modity. We find that these strategies show significant similarities and common features that define them. The comparison of theoretical definitions and strate-gies’ key features indicates that no available definition appropriately describes SA strategies. To bridge this gap, we propose a general definition, which more closely reflects investors’ strategies. In addition, we suggest that, instead of searching for a definitive theoretical definition of SA, scholars should instead agree on a classification system that encompasses the current forms of SA while facilitating the inclusion of new types as they emerge. We propose a simple sys-tem for classifying strategies that takes into account the strategies’ risk and re-turn profile. We illustrate the advantages of this approach by demonstrating how it can guide theoretical development and empirical testing. We also provide ex-amples of potential future research directions.
We make several contributions to the existing literature. We identify a general definition, which encompasses all SA strategies and introduce a classification system that facilitates their study. This is achieved through an innovative inves-tigation of SA both in academic and financial industry research. In our review, for the first time, we analyze SA across all asset classes (equity, fixed income and commodity) to identify common features and defining elements. Our analysis brings clarity in SA investing and allows investors to have a common framework to assess different investment opportunities.
The paper is organized as follows. In Section 2, we review existing definitions of SA producing a comprehensive mapping. In Section 3, we report a survey of statistically determined arbitrage strategies. In Section 4, we identify the key features which are common to the various strategies. We combine the findings of the previous sections and propose a general definition and classification sys-tem. Section 5 concludes the paper.
2. Review of Definitions
DOI: 10.4236/tel.2018.85063 890 Theoretical Economics Letters producing large losses which endangered global markets and forced the Federal Reserve Bank of New York to organize a bailout in order to avoid a wider finan-cial collapse. Nevertheless, SA continued to grow in popularity with applications progressively expanding to all asset classes. SA has become one of the main in-vestment strategies in inin-vestment banks and mostly for hedge funds [16]. In par-ticular, the term SA is used to denote hedge funds that aim to exploit pricing anomalies in equity markets [17]. Technological developments in computational modelling have also facilitated the use of SA in high frequency trading and with the so-called machine learning methods, such as neural networks and genetic algorithms [18][19][20][21]. In more recent years, SA has seen renewed inter-est in emerging areas such as bitcoin [22][23], big data [24][25][26] and factor investing [27].
The literature on the limits of arbitrage is quite broad and provides some in-sights on why SA opportunities exist. Mou [28] reports how arbitrageurs have to face three different types of risks: fundamental risk [3], noise trader risk [29] and synchronization risk [30]. Duffie [31] describes the risks arising from inattentive investors. Finally, behavioral effects can generate additional risk and asset bub-bles. On the one hand, these risks create SA opportunities. On the other hand, the same risks can undermine arbitrageurs’ efforts and cause delays in correcting market anomalies.
In this section, we review all definitions of arbitrage available in literature which may be suitable to define SA. Our analysis encompasses both alternative definitions of arbitrage as well as definitions of statistical arbitrage. Before re-viewing the various definitions, we briefly recall the four types of definitions that are commonly used: 1) lexical, 2) conceptual, 3) abstract and 4) operational [32] [33]. Lexical definitions use simple terms for a wide audience. Conceptual defi-nitions describe a concept in a way that is compatible with a measurable occur-rence. Abstract definitions are used when the meaning cannot be measured em-pirically. Finally, operational definitions provide a clear and concise meaning of a concept in a way that can be measured. Operational definitions clearly specify the object and criteria of measurement which makes them particularly suitable for scientific investigation. We find that existing definitions can be categorized as lexical, conceptual or operational while there are no abstract definitions.
2.1. Lexical Definitions of SA
DOI: 10.4236/tel.2018.85063 891 Theoretical Economics Letters as a framework for identifying, modelling and exploiting small but consistent regularities in asset price dynamics. Other definitions are centered on the con-cept of mispricing. Thomaidis and Kondakis [37] define SA as an attempt to profit from pricing discrepancies that appear in a group of assets. Do, Faff and Hamza [38] claim that SA is an equity trading strategy that employs time series methods to identify relative mispricings between stocks. Burgess [36] also de-scribes statistical arbitrage as a generalization of a traditional arbitrage where mispricing is statistically determined through replicating strategies. In using de-rivatives, Zapart [39] describes statistical arbitrage as an investment opportunity when perfect hedging is not possible.
A general definition of SA strategy should describe what SA is and its objec-tives. We find instead that some definitions focus on specific implementations and techniques. In particular, in a broad range of papers, SA is associated with pairs trading [14][40]-[46] and cointegration [47][48][49][50][51].
2.2. Conceptual Definitions of SA
Another set of definitions can be classified as conceptual as they can be asso-ciated with specific measures. In reviewing Hedge Funds (HFs) strategies, Con-nor and Lasarte [52] use the probability of a loss in defining SA as a zero-cost portfolio where the probability of a negative payoff is very small but not exactly zero. Stefanini [12] uses the expected value in noting that SA seeks to capture imbalances in expected value of financial instruments, while trying to be market neutral. For Saks and Maringer [53], SA accepts negative payoffs as long as the expected positive payoffs are high enough and the probability of losses is small enough. Focardi, Fabozzi and Mitov [54] focus on uncorrelated returns report-ing that SA strategies aim to produce positive, low-volatility returns that are un-correlated with market returns.
2.3. Operational Definitions of Arbitrage
We next discuss the various extensions of arbitrage available in the literature that are used mainly in asset pricing. All definitions can be classified as opera-tional and are mathematically formulated. Here, we provide a description of the various arbitrages while we refer to the relative papers for a more rigorous for-mulation.
We first introduce the classical definition of arbitrage, defined as a zero-cost trading strategy with positive expected payoff and no possibility of a loss. The absence of arbitrage is a necessary condition for equilibrium models, however this condition alone is often too weak to be practically useful for certain applica-tions such as option pricing [10].
DOI: 10.4236/tel.2018.85063 892 Theoretical Economics Letters [6] independently apply the same concept as Ledoit to derivatives. They define a strategy as a Good Deal (GD) if its market price lies outside the range of plausi-ble prices as determined by the various discount factors.
Bernardo and Ledoit [7] introduce the Approximate Arbitrage (AA) as they note that the Sharpe ratio is not a good measure of the attractiveness of an in-vestment opportunity. If returns are not normally distributed strategies can have arbitrarily low Sharpe ratios, hence the introduction of a gain-loss ratio. AA is defined as an investment strategy whose maximum gain-loss ratio is above a predefined constant value greater than one. Instead of using the Sharpe ratio or the gain-loss ratio, Carr, Geman and Madan [9] base their definition of Accepta-ble Opportunity (AO) on two distinct sets of probability measures (valuation and stress measures). AO is defined as an investment strategy having a non-negative expected value under each valuation measure and losses capped under a set of stress measures. In other words, AO is an investment opportunity acceptable to a wide variety of reasonable individuals as it has expected non-negative payoff with losses capped under probability measures reflecting stressed conditions (stress measures). Bertsimas, Kogam and Lo [8] introduce 𝜀𝜀-Arbitrage (εA) re-ferring to replication strategies for derivatives. An εA occurs whenever the price of a derivative significantly differs from the least costly optimal replication strategy.
In the literature, there are two definitions of Statistical Arbitrage (SA) which differ significantly from each other. Bondarenko’s SA [10] is a trading strategy which can have negative payoffs, as long as the average payoff is non-negative for given augmented information set. Key in the definition is the introduction of the augmented information set, which, in addition to the market information at time t, also includes the knowledge of the final price. Hogan et al.[11] provide an alternative definition of SA which focuses on long horizon trading opportun-ities. Hogan’s SA is a long horizon trading opportunity that, at the limit, gene-rates a risk-less profit. According to this definition SA satisfies four conditions 1) it is a zero-cost, self-financing strategy, that in the limit has 2) positive ex-pected discounted payoff, 3) a probability of a loss converging to zero, and 4) a time averaged variance converging to zero if the probability of a loss does not become zero in finite time. The fourth condition only applies when there always exists a positive probability of losing money.
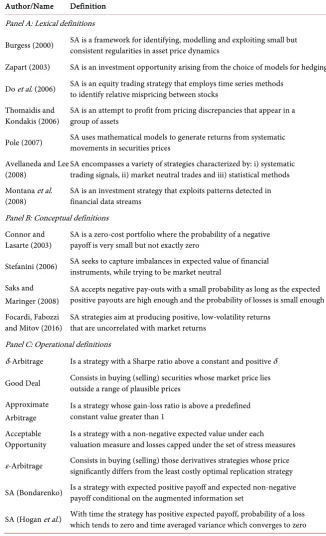
As a summary, we provide a high-level description of all the reviewed arbi-trage definitions in Table 1. Most of them are intended to describe only specific types or aspects of SA and will be discussed and compared to SA strategies in Section 4.2.
3. Literature Review of Strategies
3.1. Literature Review
DOI: 10.4236/tel.2018.85063 893 Theoretical Economics Letters Table 1. Definitions.
Author/Name Definition Panel A: Lexical definitions
Burgess (2000) SA is a framework for identifying, modelling and exploiting small but consistent regularities in asset price dynamics
Zapart (2003) SA is an investment opportunity arising from the choice of models for hedging
Do et al. (2006) SA is an equity trading strategy that employs time series methods to identify relative mispricing between stocks
Thomaidis and
Kondakis (2006) SA is an attempt to profit from pricing discrepancies that appear in a group of assets
Pole (2007) SA uses mathematical models to generate returns from systematic movements in securities prices
Avellaneda and Lee
(2008) SA encompasses a variety of strategies characterized by: i) systematic trading signals, ii) market neutral trades and iii) statistical methods Montana et al.
(2008) SA is an investment strategy that exploits patterns detected in financial data streams Panel B: Conceptual definitions
Connor and
Lasarte (2003) SA is a zero-cost portfolio where the probability of a negative payoff is very small but not exactly zero
Stefanini (2006) SA seeks to capture imbalances in expected value of financial instruments, while trying to be market neutral
Saks and Maringer (2008)
SA accepts negative pay-outs with a small probability as long as the expected positive payouts are high enough and the probability of losses is small enough Focardi, Fabozzi
and Mitov (2016) SA strategies aim at producing positive, low-volatility returns that are uncorrelated with market returns Panel C: Operational definitions
δ-Arbitrage Is a strategy with a Sharpe ratio above a constant and positive δ
Good Deal Consists in buying (selling) securities whose market price lies outside a range of plausible prices
Approximate Arbitrage
Is a strategy whose gain-loss ratio is above a predefined constant value greater than 1
Acceptable
Opportunity Is a strategy with a non-negative expected value under each valuation measure and losses capped under the set of stress measures
ε-Arbitrage Consists in buying (selling) those derivatives strategies whose price significantly differs from the least costly optimal replication strategy
SA (Bondarenko) Is a strategy with expected positive payoff and expected non-negative payoff conditional on the augmented information set
SA (Hogan et al.) With time the strategy has positive expected payoff, probability of a loss which tends to zero and time averaged variance which converges to zero
trad-DOI: 10.4236/tel.2018.85063 894 Theoretical Economics Letters ing as well as statistical models for time series analysis. There are no reviews for commodities, where studies primarily focus on modelling spreads and term structures for single commodities [57].
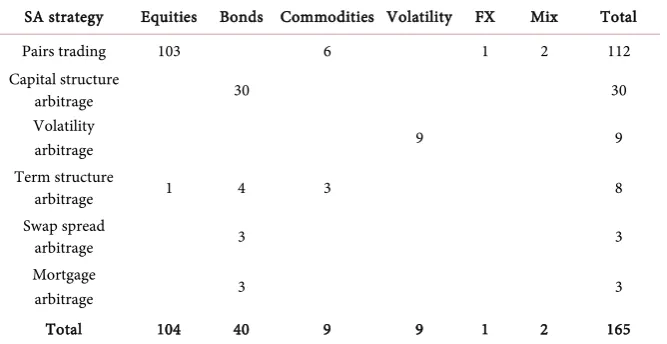
In our review, for the first time, we look at SA across all asset classes to iden-tify common features and defining elements. We review the existing literature on statistically determined arbitrage strategies and, particularly, on those la-belled as SA. We identify 165 articles in literature discussing SA strategies span-ning from 1995 to 2016 (see Table 2). The surveyed studies focus on equities (104 studies), followed by bonds (40) while other asset classes appear only in a small number of articles: commodities (9), volatility (9) and FX (1). Just two ar-ticles discuss pairs trading across asset classes (mix): investment grade credit de-fault swaps versus equity [58] and gold miners versus gold [59].
We categorize the various strategies based on the classification proposed by Duarte, Longstaff and Yu [15] who identify five different types of SA strategies in fixed income: 1) swap arbitrage strategies, 2) term structure arbitrage (or yield curve arbitrage), 3) mortgage arbitrage, 4) volatility arbitrage and 5) capital structure arbitrage. We add equity pairs trading to the classification for fixed income of Duarte, Longstaff and Yu [15]. The term SA is used very frequently in particular in relation to pairs trading (112) which includes pairs trading between indices (13), ETFs (4) and spread trading between commodities (6). Various ar-ticles focus on cointegration (21), the Ornstein-Uhlenbeck1 stochastic process
[image:7.595.208.542.522.694.2](10) and, more recently, high frequency trading (9). Pairs trading is predomi-nantly an equity strategy (103). Capital structure arbitrage is the second most documented strategy (30) which includes primarily convertible arbitrage strate-gies (19). Term structure stratestrate-gies are documented only in eight studies of which four analyze bonds. Swap spread arbitrage and mortgage arbitrage are discussed in three studies each.
Table 2. Studies on arbitrage strategies. The table reports the breakdown by asset class of existing studies on statistically determined arbitrage opportunities.
SA strategy Equities Bonds Commodities Volatility FX Mix Total
Pairs trading 103 6 1 2 112
Capital structure
arbitrage 30 30
Volatility
arbitrage 9 9
Term structure
arbitrage 1 4 3 8
Swap spread
arbitrage 3 3
Mortgage
arbitrage 3 3
Total 104 40 9 9 1 2 165
DOI: 10.4236/tel.2018.85063 895 Theoretical Economics Letters
3.2. Review of Strategies
We next describe the six identified trading strategies. Pairs trading is a SA strat-egy which is particularly popular in equity [41]. In its simplest formulation, pairs trading aims to identify pairs of stocks whose prices have historically moved to-gether. When the spread between the two components of the pair significantly widens, the strategy sells the best performing security to buy the laggard. If the spread reverts to the mean the trade will be profitable regardless of market trends. This strategy relies on the assumption of a (long-term) equilibrium in the investigated spreads [60] which can be detected through a variety of statistical methods [14] [34] [38] [40] [41] [42] [61]. Long and short positions can be combined in a ratio which makes the trade market-neutral (with a neutral beta position versus the market) or dollar-neutral. The use of pairs trading is not li-mited to stocks. There are applications to other areas such as spreads between different commodities [62]-[67], commodity future contracts [68] and freight markets [69][70]. Pairs trading can also be used to model the spread between different portfolios [71][72][73].
Term structure arbitrage is a common SA strategy which typically involves taking market-neutral long-short positions at different points of a term structure as suggested by a relative value analysis [15]. Positions are held until the trade converges and the mispricing disappears. Term structure arbitrage is particularly common in fixed income (also called yield curve arbitrage) and commodities. In spite of being one of the most common SA strategies, the literature on imple-mentations of yield curve arbitrage is quite limited and mostly focuses on inter-est rates models [15][74]. Term structure arbitrage in commodities uses models (similar to the one used in rates) to identify relative value opportunities across the curve [57]. An implementation of term structure arbitrage in commodities is described by Mou [28] who identifies investment opportunities arising from the futures rolling of the main commodity indices. In credit, SA opportunities in the term structure of CDS are studied by Jarrow, Li and Ye [75].
Volatility arbitrage is a popular and widely used strategy [76] [77] [78][79] [80]. Its implementations are structured to be pure bets on volatility and should not be influenced by the actual direction of the underlying. Similarly to other types of arbitrage, volatility arbitrage refers to a wide range of different strategies which can be classified into 1) gamma trading, 2) volatility surface arbitrage, 3) cross asset volatility trading and 4) dispersion trading. Gamma trading plays the implied volatility versus the historical volatility on the same asset [9]. If the rea-lized volatility exceeds the volatility implied in the option price, arbitrageurs can profit by buying an option and hedging the delta in the underlying market. The positive income is proportional to 2
0.5⋅S ⋅ ⋅Γ (Realized Variance-Implied
Va-riance)where S is the price of the underlying, and Γ is the gamma of the option
DOI: 10.4236/tel.2018.85063 896 Theoretical Economics Letters prices and maturities and profit from buying (selling) options whose implied volatility is excessively low (high) [81]. Cross-asset volatility trading plays the implied volatility of an asset versus the implied volatility of another asset through traditional long-short trades. Finally, dispersion trading (also known as decorrelation trading) trades the volatility of a basket of securities (generally and index) against the volatilities of the components of the same basket [81]. The volatility of an index is a function of the volatilities of the constituents and the correlations between them. Greater correlations translate into less diversification and higher index volatility. Decorrelation is traded by selling index variance swaps and buying single stock variance swaps [82].
Swap spread arbitrage is another popular fixed income strategy which bets on the difference between a fixed and a floating yield [15][83]. It is structured in two parts. On the one hand, the arbitrageur enters a par interest rate swap pay-ing a fixed coupon rate SR and receiving the floating LIBOR rate Lt. On the other hand, the arbitrageur buys a treasury bond, with the same maturity as the swap, with the money borrowed through a repurchase agreement known as re-po. Entering this part of the trade the arbitrageur earns the treasury rate TR and pays the repo rate rt. The overall cash flow of the trade is
(
Lt−rt) (
− SR TR−)
where SR−TR is the fixed interest rate component (also known as swapspread) and Lt−rt is the floating rate part which needs to be rolled periodically (typically every three months). The strategy generates a positive income as long as the floating yield exceeds the fixed one. Swap spread arbitrage is immune from interest rate risk if both the repo rate and LIBOR (which generally have the same maturity and rolling dates) react similarly to a move in rates.
Mortgage arbitrage consists of buying mortgage-backed securities (MBSs) while hedging their interest rate exposure primarily through derivatives [84]. The strategy provides a positive carry as the yield on MBSs is typically higher than that of comparable treasury bonds. As the spread earned is generally small, arbitrageurs use leverage to enhance returns. Mortgage arbitrage strategies can be classified based on the different types of MBS used. A popular implementa-tion of the strategy is with pass-through MBSs which pass all of the interest and principal cash flows of a pool of mortgages to the pass-through investors [12].
DOI: 10.4236/tel.2018.85063 897 Theoretical Economics Letters the equity with a short (long) position [89].
Convertible Arbitrage is one of the most popular capital structure strategies and involves buying a portfolio of convertible bonds while selling short the un-derlying stocks [90] [91]. Intuitively, if the stock increases in price, the bonds will appreciate and if the stock falls the short position will profit. In some ver-sions, the interest rate risk is hedged with treasury futures or interest rate swaps. In addition to credit arbitrage and convertible arbitrage, other capital structure arbitrage strategies focus on the spread between bonds and equities of the same company. In particular Schaefer and Strebulaev [89] show that structural models provide accurate predictions of the sensitivity of corporate bond returns to changes in the value of equity (hedge ratios). Other strategies instead focus on the spread between CDS and corporate bonds or different types of credit default swaps [92][93].
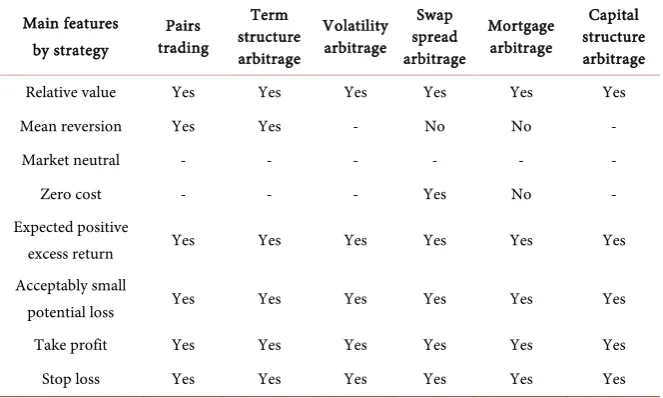
This review allows us to identify the defining features of the different strate-gies across asset classes. They are summarized in Table 3.
4. What Is SA?
In this section, we define SA strategies. We identify those features which are common to the surveyed arbitrage strategies. We compare them with the availa-ble definitions and provide a new definition in conjunction with a classification scheme. The new definition incorporates all strategies’ key elements and the classification scheme encompasses the important dimensions of SA while being flexible and easy to use.
4.1. Strategies Key Features
All strategies aim to exploit relative value opportunities through the implemen-tation of long-short positions. Pairs trading invests in the spread between two stocks. Term structure models the spread between yields or future prices.
Table 3. Arbitrage trading strategies. The table reports the defining features of the surveyed strategies.
Strategy Descriptions
Pairs trading Plays mean reversion in the spreads of two securities Term structure
arbitrage Takes long-short positions across the term structure Volatility
arbitrage Plays the spread of implied vs. realized volatility of the same security or implied vs. implied volatility of the same or different securities Swap spread
arbitrage Profits from the spread between a fix and a floating leg by entering a short (long) Treasury position and simultaneously buying (selling) an IRS Mortgage
arbitrage Buys MBS hedging the interest rates exposure Capital structure
[image:10.595.198.537.538.733.2]DOI: 10.4236/tel.2018.85063 898 Theoretical Economics Letters Volatility arbitrage identifies relative value opportunities between volatilities. Swap spread plays a fixed spread versus a floating spread. Mortgage arbitrage models the spread of MBS over treasury. Capital structure arbitrage profits from the spread between various instruments of the same company. Spreads trading involves taking long-short positions in order to profit from spreads or simply to bet on a security while being market-neutral.
However, not all strategies need mean reversion. Pairs trading and term structure arbitrage need spreads to revert to their mean to be profitable. Other strategies instead need a persistent positive spread-carry: between implied and realized volatility (volatility arbitrage), between the fixed and the floating spread (swap spread arbitrage), in the MBS spread over treasury (mortgage arbitrage) and between various instruments of the same company (capital structure arbi-trage). If spreads narrow these strategies are less profitable and can turn into a loss. In addition, not all strategies are zero-cost. This is not only due to market frictions or trading costs but it is true by construction. For example, pairs trad-ing (in the market-neutral form) may require a net payment and mortgage arbi-trage requires the purchase of MBSs.
It is not possible to clearly define whether SA strategies are market-neutral. All strategies invest in some risk factors while hedging others. For example, term structure arbitrage may hedge only against parallel shifts of the term structure. Volatility arbitrage hedges against movements of the underlying but not of the underlying volatility. Swap spread arbitrage hedges against changes in treasury and swap rates but not against credit risk. Mortgage arbitrage hedges against movements in treasury rates but not mortgage spreads.
Not all strategies guarantee gains but rather offer positive expected excess re-turns with an acceptably small potential loss. Arbitrageurs require a positive ex-pected excess return over the risk free to compensate for risk. The potential loss must be acceptably small in order to qualify the strategy as arbitrage rather than simple investment. Although not all the academic literature reports it, trades al-ways have take profit and stop loss features. The take profit identifies when a trade no longer offers positive expected excess returns. A take profit is triggered in case there is reversion to the mean (pairs trading, term structure arbitrage, volatility arbitrage and capital structure arbitrage) or when the positive carry disappears (swap spread arbitrage and mortgage arbitrage). The stop loss quan-tifies when a loss is no longer acceptably small and results from investors’ risk tolerance.
From the previous analysis, it is possible to conclude that three key factors de-fine statistically determined arbitrage opportunities: 1) relative value, 2) positive expected excess returns and 3) acceptably small potential loss. Take profit and stop loss are features which enable to operationalize SA strategies (see Table 4).
4.2. Definition of SA Strategy
DOI: 10.4236/tel.2018.85063 899 Theoretical Economics Letters Table 4. Surveyed features of statistically determined arbitrage strategies. For each trad-ing strategy, the table reports whether the listed features are present or not. Where there is no clear assessment (−) is reported.
Main features by strategy
Pairs trading
Term structure arbitrage
Volatility arbitrage
Swap spread arbitrage
Mortgage arbitrage
Capital structure arbitrage
Relative value Yes Yes Yes Yes Yes Yes
Mean reversion Yes Yes - No No -
Market neutral - - - -
Zero cost - - - Yes No -
Expected positive
excess return Yes Yes Yes Yes Yes Yes
Acceptably small
potential loss Yes Yes Yes Yes Yes Yes
Take profit Yes Yes Yes Yes Yes Yes
Stop loss Yes Yes Yes Yes Yes Yes
they focus on the same observable phenomenon but from different perspectives. Definitions focus primarily in strengthening the concept of arbitrage introduc-ing additional constraints that can make theory more consistent with financial markets. In some cases, they use tools common to practitioners, such as the Sharpe ratio in δA. In other cases, instead the focus is more on the theoretical framework, such as in the augmented information set in Bondarenko’s defini-tion [10]. Strategies instead use quantitative models as a tool to have a more effi-cient approach to uncover mispricing. Starting from the empirical evidence of market inefficiency, investors use different techniques to identify arbitrages with a given statistical confidence. It is evident how both academics and practitioners look at the same issue: academics rule out those investment opportunities which are not compatible with a rigorous pricing, while investors try to identify in-vestment opportunities resulting from inaccurate pricing. In both cases statistic-al methods have been used. Now the question is: do they come to the same con-clusions? And more particularly, is there a definition of SA which encompasses the various strategies?
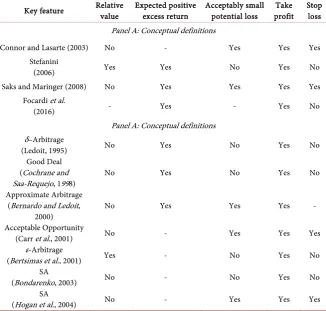
We aim to create a definition which is measurable. That rules out lexical defi-nitions which focus generically on systematic strategies [13][35] [36][94] and relative value [37][39][95]. We compare the key features of SA strategies with conceptual and operational definitions (see Table 5).
DOI: 10.4236/tel.2018.85063 900 Theoretical Economics Letters Table 5. SA definitions versus strategies’ key features.
Key feature Relative value Expected positive excess return Acceptably small potential loss profit Take Stop loss
Panel A: Conceptual definitions
Connor and Lasarte (2003) No - Yes Yes Yes
Stefanini
(2006) Yes Yes No Yes No
Saks and Maringer (2008) No Yes Yes Yes Yes
Focardi et al.
(2016) - Yes - Yes No
Panel A: Conceptual definitions δ–Arbitrage
(Ledoit, 1995) No Yes No Yes No
Good Deal (Cochrane and
Saa-Requejo, 1998) No Yes No Yes No
Approximate Arbitrage (Bernardo and Ledoit,
2000) No Yes Yes Yes -
Acceptable Opportunity
(Carr et al., 2001) No - Yes Yes Yes
ε-Arbitrage
(Bertsimas et al., 2001) Yes - No Yes No
SA
(Bondarenko, 2003) No - No Yes No
SA
(Hogan et al., 2004) No - Yes Yes Yes
Only δA, GD and AA incorporate the feature of positive excess returns while the other definitions generically refer to positive expected returns as there is no ini-tial cost involved. AA embeds the feature of acceptably small potenini-tial loss but this is limited to a specific measure (gain-loss ratio). AO limits losses through the use of generic stress measures. Hogan’s SA partially requires acceptably small potential losses as the probability of a loss converges to zero with time. All defi-nitions embed the concept of take profit as long as it is assumed that a strategy is closed at maturity or when the expected returns are no longer positive. AOs can be closed in stop loss if the realized loss is higher than what is acceptable ac-cording to the stress measures. Hogan’s SA has the concept of stop loss if it is assumed that a strategy is closed when the constraints on the probability of a loss are no longer satisfied. AA trades are closed in stop loss only if the gain-loss ra-tio is lower than one. According to the other definira-tions instead a trade is closed only when the defining criteria are no longer met and this does not necessarily involve a stop loss. In conclusion, there are some differences across definitions. Although some definitions are compatible with various strategies’ common fea-tures, nevertheless they fail to incorporate all of them as defining elements.
DOI: 10.4236/tel.2018.85063 901 Theoretical Economics Letters select the most appropriate measure as explained below.
We define a SA strategy as a relative value strategy with a positive expected
excess return and an acceptably small potential loss. We note the following in
relation to our proposed new definition. First, SA is a relative value strategy. This reflects the fact that all the reviewed strategies play the spread of a security against another one. It should be noted that, while the concept of relative value is universally accepted, its boundaries are not clearly defined. A priori a total re-turn strategy can be considered a relative value strategy of an investment against the overnight rate (which is close to zero). It is using the common understand-ing that we refer to relative value strategies as strategies aimunderstand-ing to find mispric-ing usmispric-ing historical relationships. As a relative value strategy, SA requires that the underlying securities are combined in a long-short portfolio. This allows to more accurately isolate some sources of risk (expected to deliver positive excess returns) while hedging others. The underlying securities may or may not belong to the same asset class.
Another element is given by the expected positive excess return. This part of the definition incorporates two features. The first one is given by the fact that the strategy focuses on the expected return. This differs from the definition of arbi-trage where the strategy has no admissible possible negative outcomes. Losses are allowed in our definition of SA. The second one is given by the excess return. This reflects the fact that every arbitrageur embarks on a strategy involving some risk only if there are expectations of returns higher than the risk free whenever an initial investment is required.
The last requirement is given by the acceptably small potential loss. This ele-ment is fundaele-mental in order to differentiate SA from a simple investele-ment strategy. To be called arbitrage, a strategy needs to have a constrained loss pro-file. A strategy is closed whenever the defining criteria are no longer satisfied: 1) in stop loss, if the loss is no longer acceptably small or 2) in take profit, if the performance is positive and the expected excess return is no longer positive.
This definition cannot be operational unless we define how to measure a posi-tive expected excess return and an acceptably small potential loss. The need for clarity on this issue is critical. However, the complex and dynamic landscape of financial markets suggests that no definitive theoretical or operational definition of SA is likely to be agreed. Because of this we propose to use the definition in conjunction with a classification scheme.
DOI: 10.4236/tel.2018.85063 902 Theoretical Economics Letters function.
This classification scheme aims to be sufficiently detailed to encompass the important dimensions of SA while at the same time being intuitive and easy to use. To be widely accepted, a definition should also appeal to practitioners and other stakeholders by reflecting the world as it is perceived. Our definition, with annexed classification scheme, satisfies the four canons of a good definition: adequacy, differentiation, impartiality and completeness [32]. It is adequate as it clarifies a substantial portion of the meaning of SA. It shows differentiation as it eliminates confusions including all the terms which distinguish SA from a ge-neric investment strategy. Impartiality in the definition is guaranteed as all key elements receive similar significance while assuring the necessary completeness. Our definition of SA compares favorably to existing SA definitions. The defini-tion of Bondarenko [10] is not suitable to describe this wider range of strategies. Hogan’s SA definition instead seems to be more focused on investors’ strategies and this is reflected by its broader use in more recent literature [54] [100]. However, Hogan’s definition does not emphasize the need for positive excess return and the peculiarity of relative value. Additionally, it is not flexible enough to include SA strategies based on specific ratios, see for example the Sharpe ra-tios used by Bertram [101], Cummins and Bucca [67] and Goncu [100]. Our de-finition reformulates the dede-finition of Saks and Maringer [53] adding relative value. This addition is fundamental to rule out investing in short term govern-ment bonds (with positive expected return and low probability of a loss) as a SA strategy.
Our definition and classification system could guide future research. For ex-ample, the use of a common classification system allows investigating the prof-itability and riskiness of SA strategies across asset classes and time. This enables mapping pricing anomalies and can provide directions on how to improve pric-ing models. The existence of persistent SA opportunities in selected strategies can be used as an indicator to direct future research to less studied asset classes and instruments. Having a framework brings transparency to the term SA, helping investors in making investment decisions. For example, our definition of SA can be used in the hedge funds industry where there is no agreement on a standardized classification system of strategies [102]. This can help address the issue of a lack of uniform definitions in hedge funds where several classification systems are still in use with significant differences among them [103][104].
5. Conclusions
fea-DOI: 10.4236/tel.2018.85063 903 Theoretical Economics Letters tures which define the concept embedded in investors thinking. As no definition is suitable to describe this type of strategies, we introduce a general definition and propose a classification system that encompasses the current forms of SA strategies while facilitating the inclusion of new types as they emerge.
Our study makes several contributions to the existing literature. We bridge the gap existing between the literature on arbitrage definitions and SA strategies. We perform an innovative investigation of SA both in academic and financial industry research analyzing, for the first time, SA across all asset classes (equity, fixed income and commodity). We find a general definition, which includes all SA strategies and propose a classification system measuring the strategies’ risk and return profile. This facilitates the inclusion of new strategies and measures as they emerge. Our analysis allows investors to have a common framework to evaluate investment opportunities and brings clarity in SA investing, guiding theoretical development and empirical testing. We also provide examples of po-tential future research directions.
References
[1] Fama, E. (1969) Efficient Capital Markets: A Review of Theory and Empirical Work. The Journal of Finance, 25, 383-417.https://doi.org/10.2307/2325486
[2] Ross, S. (1976) The Arbitrage Theory of Capital Asset Pricing. Journal of Economic Theory, 13, 341-360.https://doi.org/10.1016/0022-0531(76)90046-6
[3] Shleifer, A. and Vishny, R. (1997) The Limits of Arbitrage. The Journal of Finance, 52, 35-55.https://doi.org/10.1111/j.1540-6261.1997.tb03807.x
[4] Alsayed, H. and McGroarty, F. (2014) Ultra-High-Frequency Algorithmic Arbitrage Across International Index Futures. Journal of Forecasting, 33, 391-408.
https://doi.org/10.1002/for.2298
[5] Ledoit, O. (1995) Essays on Risk and Return in the Stock Market. Massachussetts Institute of Technology,Cambridge, MA.
[6] Chochrane, J.H. and Saa-Requejo, J. (1998) Beyond Arbitrage: Good Deal Asset Price Bounds in Incomplete Markets. Journal of the Political Economy, 108, 79-119.
https://doi.org/10.1086/262112
[7] Bernardo, A. and Ledoit, O. (2000) Gain, Loss and Asset Pricing. Journal of the Po-litical Economy, 108, 144-172.https://doi.org/10.1086/262114
[8] Bertsimas, D., Kogam, L. and Lo, A. (2001) Hedging Derivative Securities and In-complete Markets: An Epsilon Arbitrage Approach. Operational Research, 49, 372-394.https://doi.org/10.1287/opre.49.3.372.11218
[9] Carr, P., Geman, H. and Madan, D. (2001) Pricing and Hedging in Incomplete Markets. Journal of Financial Economics, 62, 131-167.
https://doi.org/10.1016/S0304-405X(01)00075-7
[10] Bondarenko, O. (2003) Statistical Arbitrage and Securities Prices. Review of Finan-cial Studies, 16, 875-919.https://doi.org/10.1093/rfs/hhg016
[11] Hogan, S., Jarrow, R., Theo, M. and Warachka, M. (2004) Testing Market Efficiency Using Statistical Arbitrage with Application to Momentum and Value Strategies. Journal of Financial Economics, 73, 525-565.
https://doi.org/10.1016/j.jfineco.2003.10.004
Ho-DOI: 10.4236/tel.2018.85063 904 Theoretical Economics Letters boken, NJ.
[13] Pole, A. (2007) Statistical Arbitrage. John Wiley & Sons, Hoboken, NJ.
[14] Gatev, E., Goetzmann, W.N. and Rouwenhorst, K.G. (2006) Pairs Trading: Perfor-mance of a Relative-Value Arbitrage Rule. The Review of Financial Studies, 19, 797-827.https://doi.org/10.1093/rfs/hhj020
[15] Duarte, J., Longstaff, F.A. and Yu, F. (2006) Risk and Return in Fixed Income Arbi-trage: Nickerls in Front of a Steamroller? The Review of Financial Studies, 20, 769-811.https://doi.org/10.1093/rfs/hhl026
[16] Preqin (2016) Global Hedge Fund Report.
[17] HFR (2016) HFR Hedge Fund Strategy Classification System.
[18] Brogaard, J., Hendershott, T. and Riordan, R. (2014) High-Frequency Trading and Price Discovery. The Review of Financial Studies, 27, 2267-2306.
https://doi.org/10.1093/rfs/hhu032
[19] Chaboud, A.P., Chiquoine, B., Hjalmarsson, E. and Vega, C. (2014) Rise of the Ma-chines: Algorithmic Trading in the Foreign Exchange Market. The Journal of Finance, 69, 2045-2084.https://doi.org/10.1111/jofi.12186
[20] Orteg,a L. and Khashanah, K. (2014) A Neuro-Wavelet Model for the Short-Term Forecasting of High-Frequency Time Series of Stock Returns. Journal of Forecast-ing, 33, 134-146.https://doi.org/10.1002/for.2270
[21] Payne, B. and Tresl, J. (2015) Hedge Fund Replication with a Genetic Algorithm: Breeding a Usable Mousetrap. Quantitative Finance, 15, 1705-1726.
https://doi.org/10.1080/14697688.2014.979222
[22] Brandvold, M., Molnár, P., Vagstad, K. and Valstad, O. (2015) Price Discovery on Bitcoin Exchanges. Journal of International Financial Markets, Institutions and Money, 36, 18-35.https://doi.org/10.1016/j.intfin.2015.02.010
[23] Lintilhac, P. and Tourin, A. (2016) Model-Based Pairs Trading in the Bitcoin Mar-kets. Quantitative Finance, 1-14.
[24] McAfee, A., Brynjolfsson, E., Davenport, T., Patil, D. and Barton, D. (2012) Big Da-ta. The Management Revolution. Harvard Business Review, 90, 61-67.
[25] Lazer, D., Kennedy, R., King, G. and Vespignani, A. (2014) The Parable of Google Flu: Traps in Big Data Analysis. Science, 343, 1203-1205.
https://doi.org/10.1126/science.1248506
[26] Nardo, M., Petracco, M. and Naltsidis, M. (2016) Walking down Wall Street with a Tablet: A Survey of Stock Market Predictions Using the Web. Journal of Economic Surveys, 30, 356-369.https://doi.org/10.1111/joes.12102
[27] Maeso, J. and Martellini, L. (2017) Factor Investing and Risk Allocation: From Tra-ditional to Alternative Risk Premia Harvesting. The Journal of Alternative Invest-ments, 20, 27-42.https://doi.org/10.3905/jai.2017.20.1.027
[28] Mou, Y. (2010) Limits to Arbitrage and Commodity Index Investment: Front-Running the Goldman Roll.
[29] De Long, B., Shleifer, A., Summers, L. and Waldmann, R. (1990) Noise Trader in Financial Markets. Journal of Political Economy, 98, 703-738.
https://doi.org/10.1086/261703
[30] Abreu, D. and Brennermeier, M. (2002) Synchronization Risk and Delayed Arbi-trage. Journal of Financial Economics, 66, 341-360.
https://doi.org/10.1016/S0304-405X(02)00227-1
DOI: 10.4236/tel.2018.85063 905 Theoretical Economics Letters Capital. The Journal of Finance, 65, 4.
https://doi.org/10.1111/j.1540-6261.2010.01569.x
[32] Borsodi, R. (1967) The Definition of Definition. Porter Sargent, Boston, MA. [33] Aggarwal, R., Berrill, J., Hutson, E. and Kearney, C. (2011) What Is a Multinational
Corporation? Classifying the Degree of Firm-Level Multinationality. International Business Review, 20, 557-577.https://doi.org/10.1016/j.ibusrev.2010.11.004
[34] Avellaneda, M. and Lee, J. H. (2008) Statistical Arbitrage in the U.S. Equities Mar-ket.
[35] Montana, G. (2009) Flexible Least Squares for Temporal Data Mining and Statistical Arbitrage. Expert Systems with Applications, 36, 2819-2830.
https://doi.org/10.1016/j.eswa.2008.01.062
[36] Burgess, A.N. (2000) Statistical Arbitrage Models of the FTSE 100. In: Abu-Mostafa, et al., Computational Finance 99, MIT Press, Cambridge, MA, 297-312.
[37] Thomaidis, N.S. and Kondakis, N. (2006) An Intelligent Statistical Arbitrage Trad-ing System. In: Lecture Notes in Computer Science, Springer-Verlag, Berlin. [38] Do, B., Faff, R. and Hamza, K. (2006) A New Approach to Modelling and
Estima-tion for Pairs Trading.
[39] Zapart, C. (2003) Statistical Arbitrage Trading with Wavelets and Artificial Neural Networks. IEEE International Conference on Computational Intelligence for Finan-cial Engineering, Hong Kong, 20-23 March 2003, 429-435.
[40] Nath, P. (2003) High Frequency Pairs Trading with U.S. Treasuries Securities: Risks and Rewards for Hedge Funds. Working Paper. London Business School,London. [41] Vidyamurthy, G. (2004) Pairs Trading. John Wiley & Sons, Hoboken, NJ.
[42] Elliott, R.J., Van Der Hoek, J. and Malcom, W.P. (2005) Pairs Trading. Quantitative Finance, 5, 271-276.https://doi.org/10.1080/14697680500149370
[43] Bolgün, K.E., Takasbank, E.K. and Güven, S. (2010) Dynamic Pairs Trading Strate-gy for the Companies Listed in the Istanbul Stock Exchange. International Review of Applied Financial Issues and Economics, 1, 37-57.
[44] Meucci, A. (2010) Review of Statistical Arbitrage, Cointegration and Multivariate Ornstein-Uhlenbeck.
[45] Cummins, M. (2010) Optimal Statistical Arbitrage: A Model Specification Analysis on ISEQ Dates. Irish Accounting Review, 17.
[46] Reiakvam, O.H. and Thyness, B. (2011) Pairs Trading in the Aluminum Market. A Cointegration Approach. Norwegian University of Science and Technology, Trondheim.
[47] Alexakis, C. (2010) Long-Run Relations among Equity Indices under Different Market Conditions: Implications on the Implementation of Statistical Arbitrage Strategies. Journal of International Financial Markets, Institutions and Money, 20, 389-403.https://doi.org/10.1016/j.intfin.2010.05.003
[48] Chiu, M.C. and Wong, H.Y. (2013) Optimal Investment for an Insurer with Coin-tegrated Assets: CRRA Utility. Insurance: Mathematics and Economics, 52, 52-64.
https://doi.org/10.1016/j.insmatheco.2012.11.004
[49] Chen, H. and Zhu, Y. (2015) An Empirical Study on the Threshold Cointegration of Chinese A and H Cross-Listed Shares. Journal of Applied Statistics, 42, 2406-2419.
https://doi.org/10.1080/02664763.2015.1034660
Em-DOI: 10.4236/tel.2018.85063 906 Theoretical Economics Letters pirical Economics, 51, 1115-1149.https://doi.org/10.1007/s00181-015-1029-5
[51] Rad, H., Low, R.K.Y. and Faff, R. (2016) The Profitability of Pairs Trading Strate-gies: Distance, Cointegration and Copula Methods. Quantitative Finance, 16, 1541-1558.https://doi.org/10.1080/14697688.2016.1164337
[52] Connor, G. and Lasarte, T. (2003) An Overview of Hedge Fund Strategies. [53] Saks, P. and Maringer, D. (2008) Genetic Programming in Statistical Arbitrage. [54] Focardi, S., Fabozzi, F. and Mitov, I. (2016) A New Approach to Statistical
Arbi-trage: Strategies Based on Dynamic Factor Models of Prices and Their Performance. Journal of Banking and Finance, 65, 134-155.
https://doi.org/10.1016/j.jbankfin.2015.10.005
[55] Sharpe, W.F. (1964) Capital Asset Prices. Journal of Finance, 19, 425-442.
[56] Lo, A. (2002) The Statistics of Sharpe Ratios. Financial Analysts Journal, 58, 36-52.
https://doi.org/10.2469/faj.v58.n4.2453
[57] Lautier, D. (2005) Term Structure Models of Commodity Prices. Journal of Alterna-tive Investments, 8, 42-64.https://doi.org/10.3905/jai.2005.523082
[58] Gadiraju, P. (2009) CDXIG Index, VIX and the Swap Curve Slope: A Study in Cross-Market Statistical Arbitrage.
[59] Yu, J. and Wang, Z. (2014) China’s Gold Statistical Arbitrage. no. Meic, 1414-1418. [60] Ardeni, P. (1989) Does the Law of One Price hold for Commodity Prices? American
Journal of Agricultural Economics, 71, 661-669.https://doi.org/10.2307/1242021
[61] Do, B. and Faff, R. (2010) Does Simple Pairs Trading Still Work? Financial Analysts Journal, 66, 83-95.https://doi.org/10.2469/faj.v66.n4.1
[62] Monroe, M. and Cohn, A. (1986) The Relative Efficiency of the Gold and Treasury Bill Futures Markets. The Journal of Futures Markets, 6, 477-493.
https://doi.org/10.1002/fut.3990060311
[63] Johnson, R., Zulauf, C., Irwin, S. and Gerlow, M. (1991) The Soybean Complex Spread: An Examination of Market Efficiency from the Viewpoint of a Production Process. The Journal of Futures Markets, 11, 25-37.
https://doi.org/10.1002/fut.3990110104
[64] Wahab, M., Cohn, R. and Lashgari, M. (1994) The Gold-Silver Spread: Integration, Cointegration, Predictability and Ex-Ante Arbitrage. The Journal of Futures Mar-kets, 14, 709-756.https://doi.org/10.1002/fut.3990140606
[65] Barrett, W. and Kolb, R. (1995) Analysis of Spreads in Agricultural Futures. The Journal of Futures Markets, 15, 69-86.https://doi.org/10.1002/fut.3990150107
[66] Girma, P. and Paulson, A. (1999) Risk Arbitrage Opportunities in Petroleum Fu-tures Spreads. The Journal of Futures Markets, 19, 931-955.
https://doi.org/10.1002/(SICI)1096-9934(199912)19:8<931::AID-FUT5>3.0.CO;2-L
[67] Cummins, M. and Bucca, A. (2012) Quantitative Spread Trading on Crude Oil and Refined Products Markets. Quantitative Finance, 12, 1857-1875.
https://doi.org/10.1080/14697688.2012.715749
[68] Cui, L., Huang, K. and Cai, H. (2015) Application of a TGARCH-Wavelet Neural Network to Arbitrage Trading in the Metal Futures Market in China. Quantitative Finance, 15, 371-384.https://doi.org/10.1080/14697688.2013.819987
[69] Roehner, B. (1996) The Role of Transportation Costs in the Economics of Com-modity Markets. American Journal of Agricultural Economics, 78, 129-176.
https://doi.org/10.2307/1243707
be-DOI: 10.4236/tel.2018.85063 907 Theoretical Economics Letters tween Oil Futures and Tanker Freight markets. IAME 2002 Conference,Panama, December 2002.
[71] Alexander, C., Dimitriu, A. and Malik, A. (2005) Indexing and Statistical Arbi-trage—Tracking Error or Cointegration? Journal of Portfolio Management, 31, 50.
https://doi.org/10.3905/jpm.2005.470578
[72] Cheng, X., Yu, P. and Li, W. (2011) Basket Trading under Co-Integration with the Logistic Mixture Autoregressive Model. Quantitative Finance, 11, 1407-1419.
https://doi.org/10.1080/14697688.2010.506445
[73] Acosta-Gonzalez, E., Armas-Herrera, R. and Fernandez-Rodriguez, F. (2015) On the Index Tracking and the Statistical Arbitrage Choosing the Stocks by Means of Cointegration: The Role of Stock Picking. Quantitative Finance, 15, 1075-1091.
https://doi.org/10.1080/14697688.2014.940604
[74] Fabozzi, F. (2001) The Handbook of Fixed Income Securities. McGraw Hill, New York
[75] Jarrow, R., Li, H. and Ye, X. (2009) Exploring Statistical Arbitrage Opportunities in the Term Structure of CDS Spreads. RMI Working Paper No. 11/08.
[76] Belton, T. and Burghardt, G. (1993) Volatility Arbitrage in the Treasury Bond Basis. Journal of Portfolio Management, 19, 69-77.
https://doi.org/10.3905/jpm.1993.409447
[77] Amman, M. and Herriger, S. (2002) Relative Implied-Volatility Arbitrage with In-dex Options. Financial Analysts Journal, 58, 42.
[78] Ahmad, R. and Willmott, P. (2005) Which Free Lunch Would You Like Today Sir? Delta-Hedging, Volatility Arbitrage and Optimal Portfolios. Willmott Magazine, 2005, 64-79.
[79] Jena, R. and Tankov, P. (2011) Arbitrage Opportunities in Misspecified Stochastic Volatility Models. SIAM Journal of Financial Mathematics, 2, 317-341.
https://doi.org/10.1137/100786678
[80] Baik, B., Kang, H. and Kim, Y. (2013) Volatility Arbitrage around Earnings An-nouncements: Evidence from the Korean Equity Linked Warrants Market. Pacific Basin Finance Journal, 23, 109-130.https://doi.org/10.1016/j.pacfin.2013.01.001
[81] Sinclair, E. (2008) Volatility Trading. John Wiley & Sons, Hoboken, NJ. [82] Morgan, J.P. (2006) Variance Swaps. J.P. Morgan Securities Ltd., London. [83] Krishnamurthy, A. (2008) Fundamental Value and Limits to Arbitrage.
[84] Biby, J., Modukuri, S. and Hargrave, B. (2001) Collateralized Borrowing via Dollar Rolls. In:, The Handbook of Mortgage-Backed Securities.
[85] Yu, F. (2005) How Profitable Is Capital Structure Arbitrage? Financial Analysts Journal, 62, 47-62.
[86] Driessen, J. and Van Hemert, O. (2012) Pricing of Commercial Real Estate Securi-ties during the 2007-2009 Financial Crisis. Journal of Financial Economics, 105, 37-61.https://doi.org/10.1016/j.jfineco.2012.02.006
[87] Kapadia, N. and Pu, X. (2012) Limited Arbitrage between Equity and Credit Mar-kets. Journal of Financial Economics, 105, 542-564.
https://doi.org/10.1016/j.jfineco.2011.10.014
[88] Calice, G., Chen, J. and Williams, J. (2013) Are There Benefits to Being Naked? The Returns and Diversification Impact of Capital Structure Arbitrage. European Jour-nal of Finance, 19, 815-840.https://doi.org/10.1080/1351847X.2011.637115
DOI: 10.4236/tel.2018.85063 908 Theoretical Economics Letters [90] Agarwal, V., Fung, W.H., Loon, C.Y. and Naik, L.Y. (2006) Risk and Return in
Convertible Arbitrage: Evidence from the Convertible Bond Market.
[91] Yan, H., Yang, S. and Zhao, S. (2016) Research on Convertible Bond Pricing Effi-ciency Based on Nonparametric Fixed Effect Panel Data Model. China Finance Re-view International, 6, 32-55.https://doi.org/10.1108/CFRI-04-2015-0030
[92] Mayordomo, S., Ignacio, J. and Romo, J. (2014) Testing for Statistical Arbitrage in Credit Derivatives Markets. Journal of Empirical Finance, 26, 59-75.
https://doi.org/10.1016/j.jempfin.2014.02.002
[93] Leccadito, A., Tunaru, R. and Urga, G. (2015) Trading Strategies with Implied For-ward Credit Default Swap Spreads. Journal of Banking and Finance, 58, 361-375.
https://doi.org/10.1016/j.jbankfin.2015.04.018
[94] Avellaneda, M. and Lee, J. H. (2008) Statistical Arbitrage in the U.S. Equities Mar-ket.
[95] Hillier, D., Draper, P. and Faff, R. (2006) Do Precious Metals Shine? An Investment Perspective. Financial Analysts Journal, 62, 98-106.
https://doi.org/10.2469/faj.v62.n2.4085
[96] Duffie, D. and Pan, J. (1997) An Overview of Value at Risk. The Journal of Deriva-tives, 4, 7-49.https://doi.org/10.3905/jod.1997.407971
[97] Rockafellar, R. and Uryasev, S. (2000) Optimization of Conditional Value-At-Risk. Journal of Risk, 2, 21-42.https://doi.org/10.21314/JOR.2000.038
[98] Jorion, P. (2007) Value at Risk. McGraw-Hill, New York.
[99] Wang, C. and Zhao, Z. (2016) Conditional Value-at-Risk: Semiparametric Estima-tion and Inference. Journal of Econometrics, 195, 86-103.
https://doi.org/10.1016/j.jeconom.2016.07.002
[100]Goncu, A. (2015) Statistical Arbitrage in the Black-Scholes Framework. Quantita-tive Finance, 15, 1489-1499.https://doi.org/10.1080/14697688.2014.961531
[101]Bertram, W. (2010) Analytical Solutions for Optimal Statistical Arbitrage Trading. Physica A: Statistical Mechanics and Its Applications, 389, 2234-2243.
https://doi.org/10.1016/j.physa.2010.01.045
[102]Baquero, G. and Verbeek, M. (2008) Style Investing: Evidence from Hedge Fund Investors. WIP.
[103]Indjic, D. and Heen, A. (2003) AIMA Survey of Hedge Fund Classification Practice. AIMA Journal.