© 2019, IRJET | Impact Factor value: 7.211 | ISO 9001:2008 Certified Journal
| Page 2255
STUDY ON CONCRETE WITH E-WASTE AS PARTIAL REPLACEMENT OF
COARSE AGGREGATE AND M-SAND AS FINE AGGREGATE
N.B.KANISKHA
1, P.PAVITHRAN
2, J.SANJAI
3, F.SHEELA
4, V.BALAJI
51,2,3,4
Student, Department of Civil Engineering, Achariya College of Engineering Technology, Puducherry, India
5Assistant Professor
,Department of Civil Engineering, Achariya College of Engineering Technology,
Puducherry, India
---***---Abstract -
Electronic products have become an integral part of daily life which provides more comfort and security. These products have a life period of usually 5-10 years. Disposal of large amounts of E-Waste material can be reused in the concrete industry as E-Waste is an emerging issue posing serious pollution problems to the human and the environment. For solving the disposal of large amount of E-waste material, reuse of E-waste in concrete industry is considered as the most feasible application. The work was conducted on M30 concrete. The replacement of coarse aggregate with E-waste in the range of 0%, 5%, 10%, 15%, 20% and 25%. Finally the mechanical properties of the concrete mix specimens obtained from the addition of these materials are compared with control concrete mix. The test results showed that a significant improvement in compressive strength was achieved in the E-waste concrete compared to conventional concrete and can be used effectively in concrete.Key Words: E-waste, Compressive strength, Split tensile strength, Flexural strength.
1.INTRODUCTION
Fine and coarse aggregates make up the bulk of a concrete mixture. These materials when mixed with water harden with time. Natural resources are depleting worldwide while at the same time the generated wastes from the industry are increasing substantially.
The sustainable development for construction involves the use of non-conventional and innovative materials, and recycling of waste materials in order to compensate the lack of natural resources and to find alternative ways conserving the environment.
Attention is being focused on the environment and safeguarding of natural resources and recycling of waste materials.
Gaps in the current scenario: a) Shortage of river sand,
b) Skyrocketing cost of construction materials, c) Increasing environmental concern, and d) Adaptation of unscrupulous practices. Therefore, a substitute is required with
a) Similar grain size,
b) Similar mechanical properties, c) Workable,
d) Cost-effective, and
e) No effect on cement chemistry.
The replacement of coarse aggregate with E-waste in the range of 0%, 5%, 10%, 15%, 20% and 25%.Finally the mechanical properties of the concrete mix specimens obtained from the addition of these materials is compared with control concrete mix.
2. E-WASTE
© 2019, IRJET | Impact Factor value: 7.211 | ISO 9001:2008 Certified Journal
| Page 2256
Whole categories of old electronic items contribute to e-waste such as VCRs being replaced by DVD players, and DVD players being replaced by Blu-ray players. E-waste is created from anything electronic: computers, TVs, monitors, cell phones, PDAs, VCRs, CD players, fax machines, printers, etc.
Besides adding harmful elements to the environment, improper disposal of e-waste is a recycling opportunity lost. Common items of electrical and electronic waste are:
1. Large household appliances (refrigerators/freezers, washing machines, dishwashers) 2. Small household appliances (toasters, coffee makers, irons, hairdryers)
3. Information technology (IT) and telecommunications equipment (personal computers, telephones, mobile phones, laptops, printers, scanners, photocopiers)
4. Consumer equipment (televisions, stereo equipment, electric toothbrushes) 5. Lighting equipment (fluorescent lamps)
6. Electrical and electronic tools (handheld drills, saws, screwdrivers) 7. Toys, leisure and sports equipment
8. Medical equipment systems (with the exception of all implanted and infected products) 9. Monitoring and control instruments
10. Automatic dispensers.
The major sources producing e-waste are:
1. IT and Telecom equipment 2. Large household appliances 3. Small household appliances 4. Consumer and lighting equipment 5. Electrical and electronic tools 6. Toys and sports equipment 7. Medical devices
8. Monitoring and control instruments
Almost all electronic waste contains some form of recyclable material, including plastic, glass and metals.
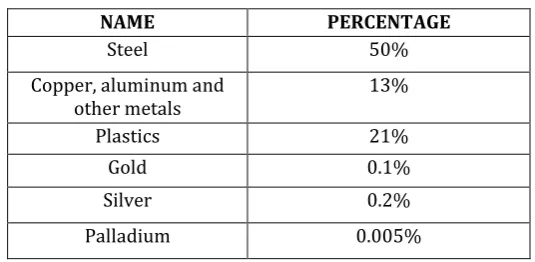
[image:2.595.163.431.525.656.2]The composition of e-waste is as in Table 1.
Table -1: Composition of e-waste
There are some of the methods for the disposal of E-Waste: i. Landfill
ii. Incineration iii. Reuse iv. Recycling
NAME PERCENTAGE
Steel 50%
Copper, aluminum and
other metals 13%
Plastics 21%
Gold 0.1%
Silver 0.2%
© 2019, IRJET | Impact Factor value: 7.211 | ISO 9001:2008 Certified Journal
| Page 2257
2.1 RECYCLING
Recycling of E-Waste is not just a viable solution to eliminate the harmful effects of disposal, but a sound business proposition in itself. E-Waste components are collected and segregation is done. Glass waste and hazardous waste are separated. Shredding is a process in which it reduces and separates component materials such as plastic, aluminum, copper, steel and precious metals.
E-Waste such as PCBs can be crushed to coarse grain particles using a jaw crusher then fine pulverizing is done to make as a fine powder. This can be achieved with the cryogenic grinding method. In this method, samples are made brittle and pulverized through crushing, shearing or impact actions.
Electrostatic separation is a process in which it separates the insoluble mixtures resulting with the separation of metals and non-metals. Metals can be recovered and non-metals can be reused.
2.2 HARMFUL EFFECTS
Improper breaking or burning of printed circuit boards (PCBs) and switches may lead to the release of mercury, cadmium and beryllium which are highly toxic to human health. Another dangerous process is the recycling of components containing hazardous compounds such as halogenated chlorides and bromides used as flame retardants in plastic, which form persistent dioxins and furans on combustion at low temperatures.
Improper disposal of these electronic wastes affect the soil, air, and water components of the environment.
3. MATERIALS
The most commonly available Portland Pozzolana cement of 53 grade was selected for the investigation. The cement used was dry, powdery and free from lumps. Concrete mixes were prepared using locally available M sand. Ordinary crushed stone with size 20mm was used as coarse aggregate in concrete mixes.
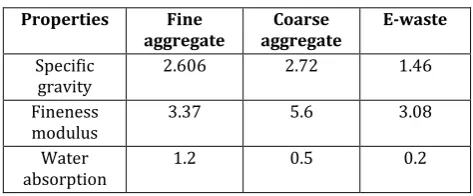
[image:3.595.179.416.528.626.2]The PCB was broken manually to 20mm size using hammer. Various properties of the materials were tested and the results are in Table.2
Table -2: Properties of Aggregates
Properties Fine
aggregate aggregate Coarse E-waste
Specific
gravity 2.606 2.72 1.46
Fineness
modulus 3.37 5.6 3.08
Water
absorption 1.2 0.5 0.2
4. CONCRETE MIX
Concrete is a versatile construction material, it is plastic and malleable when newly mixed, yet strong and durable when hardened. Concrete is the 2nd most consumed substance in the world-behind water. About 10 billion tons of concrete are produced every year. The oldest known man-made concrete mix dates back to around 500 BC .Concrete can last for thousands of years. Every major construction project uses concrete in one form or another. The Three Gorges Damn in China is the world’s largest concrete structure, consuming 35 million cubic yards of concrete.
© 2019, IRJET | Impact Factor value: 7.211 | ISO 9001:2008 Certified Journal
| Page 2258
When aggregate is mixed with dry Portland cement and water, the mixture forms a fluid slurry that is easily poured and molded into shape. The cement reacts with the water and other ingredients to form a hard matrix that binds the materials together into a durable stone-like material that has many uses.
[image:4.595.160.437.219.385.2]
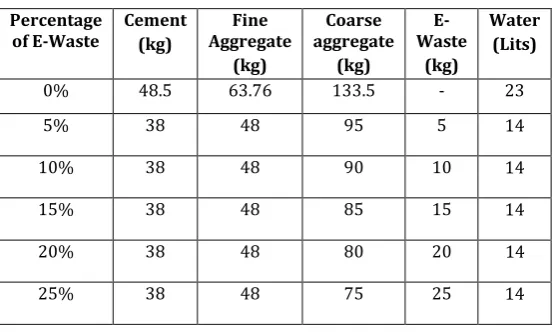
The mixes were designated with the grade of concrete and the type of fine aggregate used. IS method of concrete mix was used to achieve a mix with cube strength of 30 MPa. Mix proportions were arrived and E-waste was added to the concrete mix with a w/c ratio 0.45. The percentage of E-waste added by weight was 0, 5, 10, 15, 20 and 25.
Table -3: Mix Proportions
5. CONCRETE CURING
Water curing is the most effective method of curing. It produces the highest level of compressive strength. In addition to this the concrete was cured in Sea Water to test the strength of concrete in sea environment.
A proper curing greatly contributes to reduce the porosity and dry shrinkage of concrete and thus achieves higher strength and greater resistance to physical and chemical attacks in aggressive environments. With these results in mind, proper curing was done for specified days after the specimens are removed from the moulds.
The curing was carried out in two types of water. One normal water and another is sea water for curing of cubes, cylinders and prisms.
Seawater is more enriched in dissolved ions of all types compared to fresh water. Scientific theories behind the origins of sea salt started with Sir Edmond Halley in 1715, who proposed that salt and other minerals were carried into the sea by rivers, having been leached out of the ground by rainfall runoff. Upon reaching the ocean, these salts would be retained and concentrated as the process of evaporation removed the water.
6. EXPERIMENTAL PROCEDURE
Preparation of test specimens
For the purpose of testing specimens, various concrete specimens were prepared for different mixes by manual mixing. For preparation of concrete specimen aggregates, cement and E-waste was added. After thorough mixing, water was added and the mixing was continued until a uniform mix was obtained.
The concrete was then placed in to the moulds which were properly oiled. After placing of concrete in moulds, proper compaction was given using the tamping rods manually.
For compressive strength test, cubes of size 150mmx150mmx150mm were cast. For splitting tensile strength test, cylinders of size 150mm diameter and 300mm height were cast and for flexural strength test, beams of size 700mm x150mm x 150mm without reinforcement were cast. Specimens thus prepared were demoulded after 24 hours of casting and were kept in a curing tank for curing.
The total number of specimens casted, cured and tested are as follows:
Percentage
of E-Waste Cement (kg)
Fine Aggregate
(kg)
Coarse aggregate
(kg)
E-Waste
(kg)
Water (Lits)
0% 48.5 63.76 133.5 - 23
5% 38 48 95 5 14
10% 38 48 90 10 14
15% 38 48 85 15 14
20% 38 48 80 20 14
© 2019, IRJET | Impact Factor value: 7.211 | ISO 9001:2008 Certified Journal
| Page 2259
Table-4: Details of cube specimenTable-5: Details of cylinder specimen
Table-6: Details of Prism specimen
Table-7: Specification of Moulds
Mix No. Coarse AggregateProperties E-waste Sea Water No. of Specimens Normal Water Total
M1 100% 0% 1 1 2
M2 95% 5% 1 1 2
M3 90% 10% 1 1 2
M4 85% 15% 1 1 2
M5 80% 20% 1 1 2
M6 75% 25% 1 1 2
Mix No.
Properties No. of Specimens
Total Coarse
Aggregate wasteE- Water Sea Normal Water
M1 100% 0% 1 1 2
M2 95% 5% 1 1 2
M3 90% 10% 1 1 2
M4 85% 15% 1 1 2
M5 80% 20% 1 1 2
M6 75% 25% 1 1 2
Mix No.
Properties No. of Specimens
Total Coarse
Aggregate wasteE- Water Sea Normal Water
M1 100% 0% 5 4 9
M2 95% 5% 5 4 9
M3 90% 10% 5 4 9
M4 85% 15% 5 4 9
M5 80% 20% 5 4 9
M6 75% 25% 5 4 9
Test Details Dimensions of Specimens
Compressive Strength Cube:150mmx150mmx150mm
Split Tensile Strength Cylinder:150mm x 300mm
© 2019, IRJET | Impact Factor value: 7.211 | ISO 9001:2008 Certified Journal
| Page 2260
7. TESTING OF SPECIMENS
Comparison of Compressive, Split Tensile, and Flexural Strength
Compressive strength test was carried out cube specimen for which nine cubes were prepared for sea and normal water. Strength of each cube was evaluated after 7, 14 and 28 days. It is done in compression testing machine.
Cylinder specimens were also casted and tested for 28 days for split tensile strength. This test can be done in compression testing machine and also in Universal Testing Machine.
Prism specimens were also casted and tested for 56 days for flexural strength for each mix specification following the standard test procedures. This test is done in Universal Testing Machine.
8. RESULTS AND DISCUSSION
8.1. COMPRESSIVE STRENGTH
The results of compressive strength were presented in Table 8 and Table 9. The test was carried out to obtain compressive strength of concrete at the age of 7, 14 and 28 days. The cubes were tested using compression testing machine of capacity 2000KN. From the Chart 1 and Chart 2 the compressive strength is maximum when replacing of 10% coarse aggregate by E- waste in concrete.
Table-8: Compressive Strength of Concrete in Normal Water
0 5 10 15 20 25 30 35
0% 5% 10% 15% 20% 25%
Str
e
n
gth
in
(N
/m
m
2 )
Replacement of e-waste (in N/mm2)
7 Days
14 Days
28 Days
Chart 1: Compressive Strength of Concrete in Normal Water
Proportion of e-waste added
Compressive strength (in N/mm2)
in
Normal water
7 days 14 days 28 days
0% 20 27.1 30.3
5% 9.81 18.4 22.11
10% 9.84 18.29 22.18
15% 6.73 7.18 14.95
20% 2.73 3.18 7.74
© 2019, IRJET | Impact Factor value: 7.211 | ISO 9001:2008 Certified Journal
| Page 2261
Table-9: Compressive Strength of Concrete in Sea WaterProportion of e-waste
added
Compressive strength (in N/mm2)
in Sea Water
7 days 14 days 28 days
0% 18.2 26.5 28.2
5% 7.58 14.9 17.5
10% 7.62 15.62 17.18
15% 4.95 7.84 12.95
20% 4.95 8.06 11.17
25% 1.74 4.51 8.28
Chart 2: Compressive Strength of Concrete in Sea Water
8.2. SPLIT TENSILE STRENGTH
The results of split tensile strength were presented in Table 10. The test was carried out to obtain split tensile strength of concrete at the age of 28 days. The cylinders were tested using compression testing machine of capacity 2000KN. From the Chart 3 the maximum split tensile strength was observed at 15% replacement of coarse aggregate by E- waste in concrete.
Table-10: Split Tensile Strength of Concrete
Proportion of
e-waste added Split strength(in tensile N/mm2)in
Normal Water
Split tensile strength(in N/mm2)in Sea
Water
0% 1.65 1.58
5% 1.27 1.17
10% 1.30 1.12
15% 1.47 1.01
20% 0.56 0.78
25% 0.51 0.39
0
10
20
30
0% 5% 10% 15% 20% 25%
S
tr
e
n
g
th
i
n
(N
/
m
m
2
)
Replacement of e-waste (in N/mm2)
7 Days
14 Days
© 2019, IRJET | Impact Factor value: 7.211 | ISO 9001:2008 Certified Journal
| Page 2262
Chart 3: Split Tensile Strength of Concrete8.3. FLEXURAL STRENGTH
The results of flexural strength were presented in Table 11.The test results from Chart 4 shows the maximum flexural strength is obtained when 5% replacement of coarse aggregate by E-waste in concrete.
This test was carried out using Universal Testing Machine with single point loading. Table-11: Flexural Strength of Concrete
Proportion of
e-waste added Flexural strength(in N/mm2)in
Normal Water
Flexural strength(in N/mm2)in Sea
Water
0% 4.94 4.12
5% 3.72 3.54
10% 3.12 3.07
15% 2.35 2.12
20% 2.12 2.02
25% 1.85 1.55
Chart 4: Flexural Strength of Concrete
0 1 2 3 4 5 6
St
re
ng
th
in
(N
/m
m
2
)
Replacement of e-waste (in N/mm2)
Normal Water
© 2019, IRJET | Impact Factor value: 7.211 | ISO 9001:2008 Certified Journal
| Page 2263
9. CONCLUSIONS
From the experiments and investigation in this research work, we documented the following facts:
1.
The addition of E-waste shows increase in compressive strength up to 10% replacement. The maximum strength being 22.18N/mm2 for normal water and 17.18N/mm2 for sea water for 10% replacement.2.
Gain on split tensile strength has been observed up to 15% replacement. The maximum strength being 1.27 N/mm2 for normal water and 1.17N/mm2 for 15% replacement.3.
Maximum flexural strength of 3.72N/mm2for normal water and 3.54N/mm2 for sea water has been observed for 5% replacement after which it decreases.4.
The results indicates that the increasing the percentage replacement of coarse aggregate by e-waste over a 10% for compressive, 5% for flexural and 15% for split tensile strength has resulted in reduction of strength for both normal and sea water.5.
Workability and compaction effort of the concrete decreases after 15% replacement of the e-waste.6.
Current study concluded that electronic waste can replace coarse aggregate up to 5% to 10% as optimum replacement.7.
The probable reason for this decrease would be the difference in structure and shape of e-waste when compare to coarse aggregate which resulted in poor compaction and because of the hydrophobic property of the e-waste the hydration of cement retarded.8.
Poor compaction has significantly leaded to formation of honeycomb structures in concrete which also resulted in decline of strength of concrete as the percentage replacement of e-waste increases.9.
Reaction of e-waste with water lead to the production of pungent odor in honeycombed concrete structures due to the presence of toxic chemicals.10.
The e-waste as aggregates reduces the bond strength of concrete. Therefore, the failure of concrete occurs due to failure of bond between the cement paste and aggregates.11.
Introduction of e-waste in concrete tends to make concrete ductile, hence increasing the ability of concrete to significantly deform before failure. So I suggest this characteristic can make the concrete useful in situations where it will be subjected to harsh weather such as expansion and contraction, or freeze and thaw.12.
The strength of concrete by partial replacement of e-waste as compared to conventional concrete is less. Hence it can be used in non-load bearing structures such as partition walls and in parapet walls, lintel, slabs etc.13.
The use of E-waste in concrete can be one of the economical ways for their disposal in environment friendly manner.ACKNOWLEDGEMENT
First and foremost, I would like to thank the Almighty god who blessed me to overcome all the obstacles I came across while proceeding with this project. I am deeply indebted to my project guide Mr.V.Balaji, Assistant Professor, Department of Civil Engineering, Achariya College of Engineering Technology and Mr. Chandrasekaran, Head of the Department, Achariya College of Engineering Technology, for their sincere guidance, timely help and much appreciated correction during every step of this work.
© 2019, IRJET | Impact Factor value: 7.211 | ISO 9001:2008 Certified Journal
| Page 2264
REFERENCES
[1] S. R. Shamili, C. Natarajan, J. Karthikeyan, An Overview of Electronic Waste As Aggregate In Concrete (2017). [2] Rajiv Gupta, Harish Puppala,Nakka Rajesh, Application Of Recycled Coarse Aggregates And E-Waste For
Pavements With Low Traffic, (2015).
[3] Arjun R Kurup, Dr. Senthil Kumar K, Behaviour Of Concrete With E-Waste Fibers Under Compression, (2016).
[4] Sunil Ahirwar, Pratiksha Malviya, Vikash Patidar, Vikash Kumar Singh, An Experimental Study On Concrete By
Using E-Waste As Partial Replacement For Coarse Aggregate, (2016).
[5] A. Arun Kumar, R. Senthamizh Selvan, Performance Of Recycled E-Waste As Aggregates In Green Concrete,
(2017).
[6] Ankit Mathur , Akhil Choudhari , Parnika Singh Yadav, Mr. Krishna Murari, Experimental Study Of Concrete Using
Combination Of E-Waste And Plastic Waste As Coarse Aggregate, (2017).
[7] Manikandan,Arul Prakash and Manikandan , Experimental Study On E–Waste Concrete And Comparing With
Conventional Concrete, (2017).
[8] Ravindra N. Patil, Gaurav S. Sanap, Rohit D. Suryawanshi Saurabh R. Mahajan , Avikshit Vaidya, Vaibhav Nagare,
Eco-Friendly Light Weight Concrete Incorporating E-Waste & Corn Cob, (2017).
[9] Ashwini Manjunath B T, Partial Replacement Of E-Plastic Waste As Coarse-Aggregate In Concrete, (2015).
[10] K.Karuna Devi,S. Arun Kumar, R. Balaraman, Study on properties of concrete with Electronic waste, (2017). [11] Panneer Selvam. N, Gopala Krishna, Recycle of E-Waste in Concrete, GVT(2015).
[12] Bharat Dawande,Devansh Jain, Dr. Gyanendra Singh, Utilization of E-waste as a Partial Replacement of Coarse
Aggregate in Concrete, (2016).
[13] Shobana.R, Recycle of E-waste in concrete, (2017).
[14] Sohan Lal Angure, Dr. Savita Maru, A Review Paper on Use of E-Waste in Concrete, (2017).
[15] P.Krishna Prasanna, M.Kanta, Strength Variations in Concrete by Using E-Waste as Coarse Aggregate, (2014).
[16] An Experimental Investigation On Properties Of Concrete Produced With Manufactured Sand, Mane K.M., Kulkarni
D.K. (2016).
[17] Halesh Kumar B T, Anusha H S, Bhargavi S P, Syed Zabiulla , Replacement Of Fine Aggregate By M-Sand, (2017).
[18] Himanshu Sharma, Dr. Hemant Sood, Effect Of Hydrochloric Acid In Mixing And Curing Water On Strength Of
Concrete, (2015).
[19] Olutoge, F. Adeyemi and Amusan, G. Modupeola, The Effect Of Sea Water On Compressive Strength Of Concrete,
(2014).
[20] K. Alagusankareswari, S. Sandeep Kumar, K. B. Vignesh and K. Abdul Hameed Niyas, An Experimental Study on
E-Waste Concrete, (2016)
[21] Mahaboob Basha, Bhupal Reddy & Vasugi ,Strength behaviour of geopolymer concrete replacing fine aggregates
© 2019, IRJET | Impact Factor value: 7.211 | ISO 9001:2008 Certified Journal
| Page 2265
[22] Arjun Ramakrishna Kurup and K. Senthil Kumar , Arjun Ramakrishna Kurup, Novel Fibrous Concrete MixtureMade from Recycled PVC Fibers from Electronic Waste , (2017).
[23] K.Senthil Kumar and K.Baskar , Shear strength of concrete with E-waste plastic (HIPS) (2015).
[24] M. C. Vats, S. K. Singh, E-Waste characteristic and its disposal, (2014).
[25] Amiya Akram1, C. Sasidhar, K. Mehraj Pasha, E-Waste Management by Utilization of E-Plastics in Concrete
Mixture as Coarse Aggregate Replacement , (2015).
[26] Senthil Kumar.K, Baskar.K , Preliminary study on concrete with mixed electronic plastic waste, (2014). [27] Prof. Harish J Kulakarni, Arun Kumar C, Harsharaj , Replacement of coarse aggregates with e-waste, (2017).
[28] Manikandan P Ph.D Scholar, Senthamilkumar S Professor, Study on recycled e waste in reinforced concrete beam
under gradual loading conditions, (2017).
[29] K. Senthil Kumar1, P. V. Premalatha and K. Baskar, Evaluation of transport properties of concrete made with