© 2017, IRJET | Impact Factor value: 5.181 | ISO 9001:2008 Certified Journal | Page 3495
Fabric Defect Detection using Discrete Wavelet Transform
Minal Patil
1, S. R. Patil
21
Student, Dept. of E&TC, MIT, Aurangabad, Maharashtra, India
2Professor, Dept. of E&TC, MIT, Aurangabad, Maharashtra, India
---***---Abstract –
The main objective of our project is to detect thefabric faults of various types. The hardware platform and software is developed for solving this problem. In our project vertical yarn missing, horizontal yarn missing, oil stain and hole, such defects are detected using Discrete Wavelet Transform and KNN classifier. This system is introducing texture defect detection using decomposition of defective and defect free images. The system acquires the image by using image acquisition device. This system based on MATLAB R2017b(9.3.0.713579) software.
Key Words:Fabric inspection, Fabric defects, Discrete Wavelet Transform (DWT), Decomposition, KNN classifier, classification
1. INTRODUCTION
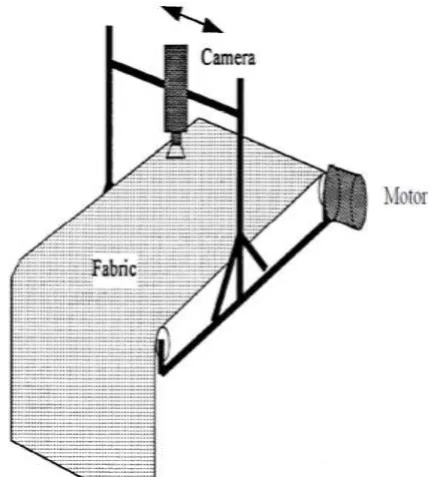
Nowadays there are advances in machine visions and hardware, monitoring and classification process of industrial product can be performed automatically using intelligent software and high speed hardware. Product inspection is an important aspect in modern industry manufacturing. Any abnormality in the product surface is called the Defect. The problem of web inspection particularly, is very important and complex and the research in this field is widely open [1]. In the best manual case, a human can detect not more than 60% of the present defects and he cannot deal with the fabric wider than 2 meter and moving faster than30m/min [2]. Fabric automated visual inspection is becoming an attractive solution to the manual inspection in modern textile industry. An automated system can provide an objective and reliable evaluation on the texture production quality. Many methods have been developed which performs real-time fabric defect detection with significant accuracy. These methods can recognize around 95% of defects on the fabric. Figure 1 shows the hardware schematic for laboratory unit.
Zhang and Wong [3] have used Gabor filter wih the Modified Elman Neural Network and the recognition rate was too good. Bastruk, Yugnak [4] showed result about 99.8% using Gabor wavelets and Principle Component Analysis. Shuyue Chen and Jun Feng [5] introduced Singular Value Decomposition which has an excellent anti-noise property and no influence by the surrounding factors. XU Guo-Sheng [6] used Curve Fitting Techniques for fabric defect detection. Zhang et al. [7] have introduced Morphological technique for defect detection. Conci and Proenca [8] have used Fractal Dimension approach to detect the fabric defects. Using
[image:1.595.322.539.246.485.2]Co-occurrence matrix method 14 features were derived by Haralick [9]. Cumulative Histogram [10], Local Binary Pattern [11], Fourier Transform [12],[13],[14], such many methods have used to detect fabric defects.
Fig -1:
A schematic design of the laboratory test unit
2. WAVELET TRANSFORM
© 2017, IRJET | Impact Factor value: 5.181 | ISO 9001:2008 Certified Journal | Page 3496
Where, a is scaling parameter and t is time.
Wavelet analysis can be performed in MATLAB and wavelet toolbox, by which wavelet transform coefficients can be computed. The toolbox include many wavelet transforms that use wavelet frame representations such as discrete, continuous, non-decimated and stationary wavelet transforms.
3.
DISCRETE WAVELET TRANSFORM
Discrete wavelet transform, which transforms a discrete time signal into discrete wavelet representation. It has inherent multi-resolution nature and can be used in applications where scalability and tolerable degradation are important. The discrete wavelet transform uses the periodized extension mode, each of the two dimensions of the image must be a power of 2. DWT decomposes a signal into a set of mutually orthogonal wavelet basis functions. These functions differ from sinusoidal basis functions in that they are spatially localized i.e., nonzero over only part of the total signal length. Also these functions can be stored more efficiently than pixel box [16]. The DWT of signal x is calculated by passing it through a series of filters,
where g is impulse response of low pass filter
Properties [16] of DWT:
1. Wavelet functions are spatially localized.
2. Wavelet functions are dilated, translated and scaled versions of a common mother wavelet.
3. Each set of wavelet functions forms an orthogonal set of basis functions.
4. DWT is invertible, so that the original signal can be completely recovered from its DWT representation.
4. DWT ARCHITECTURE
[image:2.595.279.559.49.249.2]In DWT architecture, the input image is decomposed [20] into high pass and low pass components using High Pass Filters and Low Pass Filters giving rise to first level of hierarchy. The process is continued until multiple hierarchies are obtained.
[image:2.595.358.510.280.417.2]Fig -2: DWT Decomposition Architecture
Fig -3: First level of Decomposition
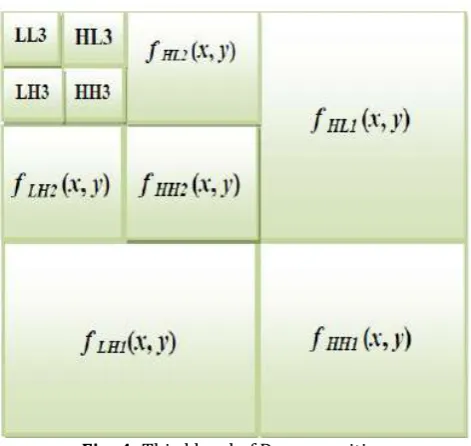
Fig -4: Third level of Decomposition
[image:2.595.316.552.451.674.2]© 2017, IRJET | Impact Factor value: 5.181 | ISO 9001:2008 Certified Journal | Page 3497
21]. This process is repeated with the columns resulting four sub-bands within the array defined by filter output. Approximation coefficient and detail coefficient is a one dimensional wavelet analysis function.
When the fabric image is decomposed it should choose the wavelet that has a good compact support, high vanishing moment and good symmetry, therefore DB wavelets family is selected as a better wavelet family for the fabric image decomposition [17, 18]. The Daubechies wavelets are a family of orthogonal wavelets defining a discrete wavelet transform and characterized by a maximal number of vanishing moments for some given support. With each wavelet type of this class, there is a scaling function (called the father wavelet) which generates an orthogonal multiresolution analysis.
5. K- NEAREST NEIGHBOUR CLASSIFIER
The k-nearest neighbor algorithm (k-NN) is a method for classifying objects based on closest training examples in the feature space. KNN is a simplest classification method than others. KNN is a method for classifying objects based on closest training examples in the feature vector. An object is classified by a majority vote of its neighbors [23]. K is always a positive integer and typically small. Training process of this algorithm is only consists of the storing features vectors and labels of the training images. KNN is a nonparametric algorithm [24] i.e. it does not make any assumptions on the underlying data distribution. J.Gao et.al. [22] Suggests the nearest neighbor is the best classification method. LiLi, Zhang YanXia et.al. [23] proves that the kNN is easier and simpler to build an automatic classifier.
6. PROPOSED ALGORITHM
1. Load the Test Texture image in JPG Format. 2. Reduce the noises in Test Texture image.
3. Convert the Test Texture image to Gray scale image. 4. Transform the gray scale image (spatial domain)
into frequency domain using DWT. Extract the approximation coefficient matrix image using decomposition.
5. Classification of the image using KNN classifier. 6. Get the output whether the image is defect-free or
defective.
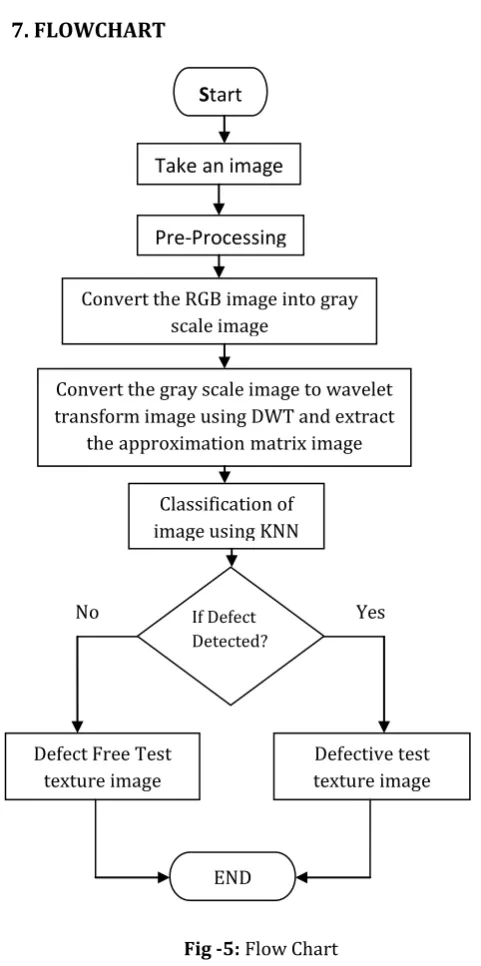
[image:3.595.303.544.85.569.2]7. FLOWCHART
Fig -5:Flow Chart
8. SYSTEM HARDWARE AND SOFTWARE
8.1 Hardware
Logitech Web-camera 5 rpm motor
Roller system
Lighting system uses normal 2 lamps
8.2 Software
MATLAB software(9.3.0.713579), 64 bit Image processing tool
If Defect Detected?
S
tart
Take an image
Defective test texture image Defect Free Test
texture image
Classification of image using KNN
Convert the gray scale image to wavelet transform image using DWT and extract
theapproximationmatrix image Convert the RGB image into gray
scale image
Pre-Processing
END
© 2017, IRJET | Impact Factor value: 5.181 | ISO 9001:2008 Certified Journal | Page 3498
Fig -6: System Hardware
9. PERFORMANCE ANALYSIS IMGES AND TABLE
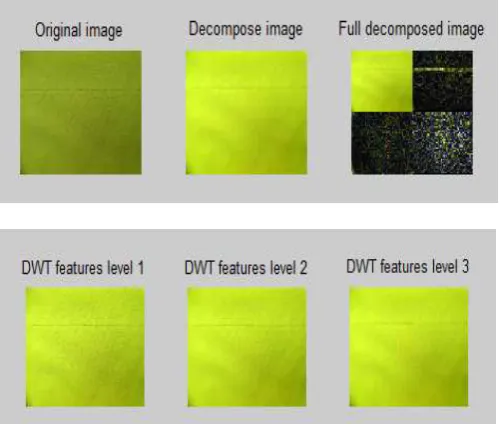
Fig -7 Third level decomposition of test image(Synthetic Fabric material)
(a)
(b)
(c)
[image:4.595.37.287.276.488.2]Fig -9: Online Real Time Fabric faults images; (a) Vertical yarn missing; (b) Ink stain; (c) Horizontal yarn missing
Table-1:Result of various faults detection in %
Train Images
in % DWT and KNN Result in %
Good Fabric
Horizontal yarn missing
Vertical yarn missing
Hole Stain
100 100 100 100 100 90
90 100 100 100 100 80
80 100 100 100 100 70
70 100 100 70 100 70
60 90 90 70 100 70
50 80 60 70 100 60
10. CONCLUSION
[image:4.595.72.252.528.682.2]© 2017, IRJET | Impact Factor value: 5.181 | ISO 9001:2008 Certified Journal | Page 3499
REFERENCES
[1] D. Brzakovic and N. Vujovic, “Designing a defect classification systems: a case study”, Pattern Recognition, Vol. 29, NO. 8, pp. 1401-1419, 1996. [2] Stojanovic and Mitropoulos, “Defect Detection and
Classification on Web Textile Fabric using multiresolution decomposition and neural networks”.
[3] Y.H. Zhang and W.K.Wong, “A new intelligent fabric defect detection and classificaton system based on Gabor filter and modified Elman Neural Network”, 2010. [4] Basturk and Yugnak, “Inspection of defects in fabrics using Gabor Wavlelet and Priciple Componets Analysis”, 2007.
[5] Shuyue Chen and Jun Feng, “Research on Detection of Fabric Defects Based on Singular Value Decomsition”, 2010.
[6] XU Guo-sheng, “The application of Curve Fitting Techniques in Fabric defect Detection”, 2010.
[7] ZhangYF, Bresee RR, “Fabric defect detection and classification using image analysis.” Journal of Textile research,1995, 65(1):1-9.
[8] A. Conci and C. B. Proenca, “A fractal image analysis system for fabric inspection based on box-counting method,” Comput. Netw. IsDN syst., vol. 30, no. 20, pp. 1887-1895, Nov.1998.
[9] R. M. Harlick, K. Shanmugam and I. Dinstein, “Textural features for image calssification,” IEEE Trans Syst., Man, Cybern., vol.3, no. 6, pp. 610-621
[10] H. Kauppinen, “A two stage defect recognition methd for parquet slab grading,” in Proc. IEEE conf. pattern Recog., Barcelona, Spain,2000, vol-4, pp.803-806
[11] T. Ojala, M. Pietikainen, and D. Harwood, “A comparitive study of texture measures with classification based on featured distribution,” Pattern recognition, 29(1):51-59, 1996.
[12]D. M. Tsai and C. Y. Heish, “Automated surface inspection for directional textures,” Image Vis. Comput., vol. 18, no. 1, pp. 49-62, Dec 1999.
[13]L. M. Hoffer, F. Francini, B. Tiribilli, G. Longobardi, “Neural network for the optical recognition of defects in cloth,” Optical Engineering 35 (11) (Nov 1996) 3183-3190.
[14]S. H. Chiu, S. Chou, J. J. Liaw, “Textural defect segmentation using a Fourier-domain maximum likelihood estimation method,” Textile Resarch Journal 72 (3) (2002) 253-258.
[15]S. G. Mallat., “A theory for multiresolution signal decomposition: The wavelet representation”, IEEE Transaction on Pattern Analysis ang Machine Intelligence, 11:674–693, 1989.
[16]Introduction to Discrete Wavelet Transform, 2004.
[17]Shengqi Guan, Jianchang Yuan, Ke Ma, “Fabric Defect Detection based on Wavelet Reconstructoin”, 978-1-61284-774-0, IEEE, 2011.
[18]Shengqi Guan, Xiuhua, Shi, Haiying Cui, Yuqin Song, “Fabric Defect Detection Based on Wavelet Characteristics”, 978-0-7695-3490-9, IEEE, 2008. [19]Z. Ibrahim, S. Al-Attas, Z. Aspar, “Model-based PCB
Inspection Technique Using Wavelet Transform”, Proceedings of the 4th Asian Control Conference (ASCC), 2002.
[20]T.D.Venkateswaran, G.Arumugam, “ Defect Detection In Fabric Images Using Two Dimensional Discrete Wavelet Transformation Technique”, IJCSCN
[21]P.-C. Wu and L.-G. Chen, “An efficient architecture fortwo-dimensional discrete wavelet transform”,IEEE Trans. Circuits and Syst. Video Tech., vol. 11, no. 4, pp. 536-545, April 2001.
[22]J. Gao, Z. Xie, and X. Wu, “Generic object recognition with regional statistical models and layer joint boosting,” Pattern Recognition Letters, vol. 28, no. 16, pp. 2227-2237, 2007.
[23]LiLi, ZHANG YanXia and ZHAO YongHeng, “K-Nearest Neighbors for automated classification of celestial objects,” Science in China Series G-Phys Mech Astron, Vol.51, no.7, pp. 916-922, 2008.