ISSN Online: 2152-7199 ISSN Print: 2152-7180
DOI: 10.4236/psych.2018.95071 May 31, 2018 1143 Psychology
A 3-Faced Construct Validation and a Bifactor
Subjective Well-Being Model Using the Scale of
Positive and Negative Experience, Greek
Version
Theodoros A. Kyriazos
*, Anastassios Stalikas, Konstantina Prassa, Vasiliki Yotsidi
Department of Psychology, Panteion University, Athens, Greece
Abstract
The present study focused on the dimensionality of the Scale of Positive and Negative Experience (SPANE) by: 1) providing evidence that the Greek ver-sion of SPANE is a robust affect measure; 2) constructing a new, briefer SPANE version, the SPANE-8 with promising psychometric profile. The con-struct validation was implemented on 2272 Greek adults using the “3-faced construct validation method”,a construct validation procedure based on sam-ple-splitting. Sample was split in three parts. EFA and Bifactor EFA models were evaluated in the 20% subsample. Then, in the 40% subsample, a total of 10 CFA models were examined (ICM-CFA, Bifactor CFA, ESEM and Bifactor ESEM models). The optimal models of SPANE-12 and SPANE-8 were suc-cessfully cross-validated in another 40% subsample. Strict measurement inva-riance, using the optimal model as a baseline model was successful for both SPANE versions. Reliability (α and ω) and AVE convergent validity were also satisfactory. Correlation analysis based on 10 different measures showed a consistent scheme of relations for both versions. Finally, a Bifactor CFA sub-jective well-being model using SPANE to measure affect was adequately fitted. In sum, the Greek version of SPANE-12 and the new SPANE-8 are invariant, reliable and valid measures of affect. Normative data are made available.
Keywords
SPANE, 3-Faced Construct Validation Method, ESEM, Bifactor EFA, Bifactor CFA, Bifactor ESEM, Subjective Well-Being Model
1. Introduction
Over the past decades, the concept of subjective well-being (SWB) has been ex-How to cite this paper: Kyriazos, T. A.,
Stalikas, A., Prassa, K., & Yotsidi, V. (2018). A 3-Faced Construct Validation and a Bifactor Subjective Well-Being Model Us-ing the Scale of Positive and Negative Ex-perience, Greek Version. Psychology, 9, 1143-1175.
https://doi.org/10.4236/psych.2018.95071
Received: April 28, 2018 Accepted: May 28, 2018 Published: May 31, 2018
Copyright © 2018 by authors and Scientific Research Publishing Inc. This work is licensed under the Creative Commons Attribution International License (CC BY 4.0).
DOI: 10.4236/psych.2018.95071 1144 Psychology tensively studied (e.g. Diener et al., 1999; Keyes, 2006; Ryan & Deci, 2001), whilst due to its uncontested significance a great amount of efforts has been put on the development of the appropriate tools for its measurement (e.g. Bai et al., 2011; Diener, 1984; Diener et al., 1999; Silva & Caetano, 2013; Keyes & Ma-gyar-Moe, 2003; Norrish & Vella-Brodrick, 2008; Veenhoven, 2013).
Affect describes the emotional experience that along with life satisfaction can decisively influence subjective well-being (Diener, Scollon, & Lucas, 2009). Ac-cording to Watson and Tellegen (1985), affect comprises two highly distinctive dimensions, Positive Affect (PA) and Negative Affect (NA). PA refers to indi-viduals’ experiences in positive mood states such as excitement, enthusiasm, cheer, alertness, vigilance, activeness, curiosity, and trust, while NA reflects aversive emotional states such as fear, anger, sorrow, depression, guilt, abase-ment, hatred, disgust, contempt, nervosity, underestimation, and scorn(Russell, 1980; Watson, Clark, & Tellegen, 1988; Diener, Scollon, & Lucas, 2009; Watson, 2002).
Positive and negative affect can either describe a state, meaning that they may reflect relatively temporary mood fluctuations, or a trait that describes a perma-nent, stable and rigid personal characteristic, referred to as positive and negative affectivity or trait PA and trait NA respectively (Watson & Pennebaker, 1989). Studies have shown that trait PA is linked to extroversion and therefore individ-uals with high positive affectivity are found to be happier and more energetic, whereas those with low levels of positive affectivity are more vulnerable to de-pression. On the other hand, trait NA is associated with anxiety and neuroticism and thus individuals who demonstrate high negative affectivity are more likely to experience high levels of distress, while those who report low negative affectivity tend to be more content(Tellegen, 1985; Watson & Pennebaker, 1989; Watson & Clark, 1984; Costa & McCrae, 1980; Clark & Watson, 1991; Clark, Steer, & Beck, 1994; Jolly et al., 1994).
Given the importance of well-being in people’s lives as well as the two-factor structure of affect, an abundance of scales has been developed to measure the pleasant and unpleasant emotions, with the Positive and Negative Affect Sche-dule (PANAS; Watson, Clark, & Tellegen, 1988) adopted as the predominant in-strument for assessing positive and negative affect, mainly due to its psychome-tric properties’ superiority (Thompson, 2007; Gray & Watson, 2007; Diener et
al., 2010). The PANAS is a tool consisting of two scales, one measuring PA and
DOI: 10.4236/psych.2018.95071 1145 Psychology feelings in different cultures and contexts (Schimmack, Diener, & Oishi, 2002; Oishi, Schimmack, & Colcombe, 2003; Diener et al., 2010; Tsai, Knutson, &
Fung, 2006), as well as for overrepresenting some feelings (e.g. anxiety) using
several similar adjectives for describing them (e.g. jittery, nervous, scared and afraid are all emotions that represent anxiety), meaning that the scale is weighted towards a certain type of feeling (Thompson, 2007; Crawford & Henry, 2004).
In order to overcome the drawbacks of the PANAS and the rest existing scales, Diener and his colleagues (2010) developed the new Scale of Positive and Negative Experiences (SPANE). SPANE measures a number of both pleasant and unpleasant experiences related to feelings of well-being and ill-being by asking individuals to recall their activities and experiences during the past four weeks and report the duration of the corresponding feelings experienced. Al-though the initial psychometric analysis (Diener et al., 2010)as well as subse-quent evaluations across several different cultures(Silva & Caetano, 2013; Sumi,
2014) failed to figure out whether the SPANE was advantageous in relation to
the PANAS, the study conducted by Jovanović (2015) confirmed its incremental validity over the latter.
The authors of SPANE (Diener et al., 2010) suggest that the scale has various advantages in comparison to the existing scales. First of all, it gauges a full set of both general and specific emotions felt by the respondents as it includes a wide range of emotional states using adjectives of high significance. In addition, SPANE does not ask from respondents to rate each feeling in terms of intensity as PANAS does but instead it asks them to estimate the amount of time they passed in a particular state in the previous four weeks. This approach is consis-tent with the view that the overall perceptions of subjective well-being are based more on the frequency of an experience than on its intensity (Diener, Sandvik, & Pavot, 1991; Diener, Colvin, Pavot, & Allman, 1991). Besides, the scale captures feelings that were ignored by most previous instruments and it reflects all levels of arousal for feelings so it can apply and perform well across different cultures. Finally, the four weeks period, as adopted by SPANE, contributes to the creation of a balance between memory efficiency and experience sampling.
DOI: 10.4236/psych.2018.95071 1146 Psychology of items. Specifically, it comprises only twelve items in total, six devoted to posi-tive feelings (SPANE-P subscale) and six related to negaposi-tive feelings (SPANE-N subscale) while it also assesses the balance between the two (SPANE-B) by sub-tracting SPANE-N scores from SPANE-P scores. For both positive and negative feelings, 3 items are general (e.g. positive, negative), and three are more specific (e.g. happy, sad).
The scale showed good psychometric properties in the original scale valida-tion study as it reported internal consistency reliability coefficients (Cronbach’s alpha) of .87 for SPANE-P, .81 for SPANE-N, and .89 for SPANE-B, while test-retest reliability coefficients over one month were shown to be .62, .63 and .68 for SPANE-P, SPANE-N and SPANE-B respectively. A single factor structure is supported for both SPANE-P and SPANE-N based on the results from a principal axis factor analysis. The factor loadings of all the items of both subscales ranged from .58 to .81 and from .49 to .78 for SPANE-P and SPANE-N respectively. Also, the two subscales correlated significantly and negatively with each other (r = −.60). The scale performed well in terms of convergent validity with other measures of emotion, happiness, and life satisfaction such as the Sa-tisfaction with Life Scale, and the construct validity of SPANE-P, SPANE-N and SPANE-B was good, with moderate to extremely high correlations with scores of several other well-being measures. Finally, the scale has been translated into more than 9 languages and has been investigated for its psychometric properties across several cultures including Portugal (Silva & Caetano, 2013), China (Li, Bai, & Wang, 2013; Tong & Wang, 2017), Japan (Sumi, 2014), Turkey (Telef, 2015), Italy (Giuntoli et al., 2017), Germany(Rahm, Heise, & Schuldt, 2017), In-dia (Singh, Junnarkar, & Jaswal, 2017), and Serbia (Jovanović, 2015).
In this study, during the evaluation of the original SPANE, a second shorter version of SPANE (SPANE-8) emerged, containing 8 items (4 in SPANE-P and 4 in SPANE-N). SPANE-8 is a revised structure containing one general feeling per dimension instead of three in the original SPANE (Diener et al., 2010: p. 145). We removed the 2 out of 3 general feelings with the weakest factor loadings per factor. The logic behind this removal is that a general feeling is adequately measured with one item for the positive and one for the negative feelings.
DOI: 10.4236/psych.2018.95071 1147 Psychology model (Linley et al., 2009) using SPANE to measure affect. All the above analys-es were performed twice, one for the original SPANE (SPANE-12) and one for the new, shorter version of SPANE-8.
2. Method
2.1. Participants
The sample is part of a study about the Quality of life in relation to Well-Being. The sample comprised 2272 Greek adults of the general population. Males were 37% and females 63% with an average age of M = 35.54 years (SD = 12.35). More than half of the sample was single (51%) or married (41%), followed by divorced (8%). The majority of the participants (59%) did not have children, or had from 1 (14%) to 2 children (22%), or more (5%). Most participants had a Bachelor (42%), finished high-school (24%), had a postgraduate degree (19%), were uni-versity students (14%), or received primary education (1%).
2.2. Materials
2.2.1. Scale of Positive and Negative Experience (SPANE-12)
This 12-item scale is a subjective well-being measure by Diener et al. (2009, 2010). It was translated in Greek by Stalikas, Kyriazos and Petratou (2017) with the translation/back-translation method (Brislin, 1970). It has 2 opposite dimen-sions: positive experiences (using 6 one-word items, e.g. “Positive” or “Happy”) and negative experiences (using 6 one-word items, e.g., “Negative”, “Sad”). Three positive feelings and 3 negative feelings are general, and the rest are spe-cific (Diener et al., 2010: p. 145). Items are scored on a Likert scale ranging from 1 (very rarely or never) to 5 (very often or always). Experiences are evaluated over a 4-week time frame. The positive score (SPANE-P) and the negative score (SPANE-N) can range from 6 to 30. Their difference (Affect Balance or SPANE-B) can vary from −24 to 24.
2.2.2. Scale of Positive and Negative Experience 8 (SPANE-8)
Except for the original version (SPANE-12), this study also proposed a second version (SPANE-8) containing 8 items (4 in SPANE-P and 4 in SPANE-N). SPANE-8 is a revised structure containing one general feeling per dimension (item pleasant in positive experiences and bad in negative ones) instead of 3 in the original SPANE (Diener et al., 2010: p. 145). Thus, 2 general feelings per factor were excluded as overlapping content, leaving a total of 8 items in the scale instead of 12. Among the general positive and negative feelings items, the items with the lowest factor loadings during CFA were excluded. This resulted in a briefer and more parsimonious structure with 4 positive (Pleasant, Happy,
Joyful, Contented) and 4 negative items (Bad, Sad, Afraid, Angry).
2.2.3. Flourishing Scale (FS)
DOI: 10.4236/psych.2018.95071 1148 Psychology are answered on a Likert scale from strong disagreement (1) to strong agree-ment (7). All items are positively phrased. Score ranges from 8 (minimum flourishing) to 56 (maximum flourishing). Diener et al. (2010) reported an in-ternal consistency reliability of α = .87. Inin-ternal consistency reliability in this study was α = 81.
2.2.4. Warwick-Edinburgh Mental Well-Being Scale (WEMWBS)
The WEMWBS was developed by the Universities of Warwick and Edinburgh (Tennant et al., 2007). It is a 14-item unidimensional, self-report scale tapping on positive aspects of mental well-being and psychological functioning (e.g., “I’ve been feeling cheerful”). All items are positively phrased. They are rated on a 5-point Likert scale from “None of the time” to “All of the time” indicating fre-quency of positivity in mental state. Responses are summed to a score ranging from 14 to 70. WEMWBS has been reported to have adequate internal consis-tency reliability in student samples and general population samples, with alpha values of .89 and .91 respectively (Tennant et al., 2007). Internal consistency re-liability in this study was α = .91.
2.2.5. Brief Resilience Scale (BRS)
BRS (Smith, Dalen, Wiggins, Tooley, Christopher, & Bernard, 2008) is a brief measure of resilience. It contains 6 items tapping on the ability to bounce back from stress and difficulties (e.g., “I tend to bounce back quickly after hard times”). Items are rated on a 5-point Likert scale ranging from Strongly Disagree
(1) to Strongly Agree (5). Smith et al. (2008) reported an adequate reliability, with Cronbach’s alpha ranging from .80 - .91. Internal reliability in this study was α = .80.
2.2.6. Mental Health Continuum-Short Form (MHC-SF)
Mental Health Continuum-Short Form (Keyes et al., 2008) is a self-report 14-item questionnaire, measuring the three aspects of well-being proposed by
Keyes (2002): emotional (EWB), social (SWB) and psychological (PWB), e.g.,
“How often did you feel interested in life?”. Items are rated on a 6-point Likert scale, suggesting the frequency of experiences (never, once or twice a month,
about once a week, two or three times a week, almost every day, every day) in the past month. Internal consistency reliability for the total MHC-SF scale (Cron-bach’s alpha) reported by Keyes (2005) to be adequate (>.80). Internal reliability for the total scale in this study was α = .90.
2.2.7. The Gratitude Questionnaire (GQ-6)
re-DOI: 10.4236/psych.2018.95071 1149 Psychology ported to be alpha = .82 (McCullough, Emmons, & Tsang, 2002). Internal relia-bility in this study was α = .68.
2.2.8. Meaning in Life Questionnaire (MLQ)
The MLQ (Steger et al., 2006) measures presence of and search for meaning in life, with a total of 10 items rated on a 7-point Likert scale (from “Absolutely True” to “Absolutely Untrue”). An example item is “I understand my life’s meaning”. Internal reliability in this study was α = .78
2.2.9. Satisfaction with Life Scale (SWLS)
The Satisfaction with Life Scale (Diener, Emmons, Larsen, & Grifin, 1985) is a scale of perceived life satisfaction (e.g., “So far I have gotten the important things I want in life”). Five items are rated on a 7-point Likert scale from 1 (Strongly Disagree) to 7 (Strongly Agree). Internal consistency reliability (Cronbach’s al-pha) was reported from .79 to .89 (Pavot & Diener, 1993). Internal reliability in this study was α = .88.
2.2.10. Trait Hope Scale (HS)
Trait Hope Scale (Snyder et al., 1991) is an assessment tool of trait hope (e.g., “I meet the goals that I set for myself”). HS has two factors: Agency and Pathways. Responses are rated from 1 (Definitely False) to 8 (Definitely True) with a score range from 8 to 64. Snyder et al. (1991) reported that Cronbach’s alphas for the total scale varied from .74 to .84. Internal reliability in this study was α = .89.
2.2.11. World Health Organization Quality of Life-Brief Scale (WHOQOL-BREF)
WHO Quality of Life-Brief scale (WHOQOL Group, 1998a, 1988b) is a self-report assessment tool measuring aspects of perceived quality of life. It is the short ver-sion of the WHOQOL-100 (c.f. Skevington, 1999). It contains 26 items (e.g., “How would you rate your quality of life?”) reflecting all 24 facets of life quality that WHOQOL-100 covers. Answers are rated by four different types of a 5-point Likert scale indicating either intensity, or capacity, or frequency, or judgement (Skevington et al., 2004). Minimum possible rating in every Likert scale is 1 (minimum perceived QOL) and maximum is 5 (maximum perceived QOL). The instrument is divided in four domains—Physical health, Psychologi-cal health, Social Relations and Environment—with satisfactory Cronbach’s al-phas, .82, .81, .68, and .80 respectively(Skevington, Lotfy, & O’Connell, 2004). Internal reliability in this study was α = .91.
2.2.12. Depression Anxiety Stress Scale, Short Form (DASS-9)
DOI: 10.4236/psych.2018.95071 1150 Psychology and frequency of symptoms over the last week (from 0 = did not apply to me at all to 3 = applied to me very much,or most of the time). The higher the score the more intense/frequent the emotions of distress. Each factor has a discrete score varying from 0 to 9. Cronbach’s alpha for the total DASS-9 was reported by Yu-soff (2013) equal to .72 whereas for Depression, Anxiety and Stress factors, al-phas were .52, .57, and .55 respectively. In this study, internal reliability for De-pression, Anxiety, Stress and Total was .79, .77, .73 and .89 correspondingly (c.f. Kyriazos, Stalikas, Prassa, Yotsidi, in press).
2.3. Procedure
Data were collected with the assistance of 150 psychology students from 2 dif-ferent psychology courses (Psychometrics and Research Methods in Psycholo-gy). Students forwarded a link to an electronic test battery (in Google Forms© format) to 15 - 20 adults from their social environment. Students were ex-tra-credited for their participation in the study. All the fields in the form of the digital battery were required to eliminate missing values. A letter was included in the test battery to inform participants about the purpose of this study. The process of data collection was the following. First, students received a short, free workshop on the administration of digital psychology questionnaires by the re-search team. Then, a period of pilot-testing the digital test battery followed to track any flaws in the digital procedure and to record the time required to com-plete the battery (approximately 15 minutes). Finally, after successful pilot test-ing, students were provided with a link to the official study.
2.4. Research Design
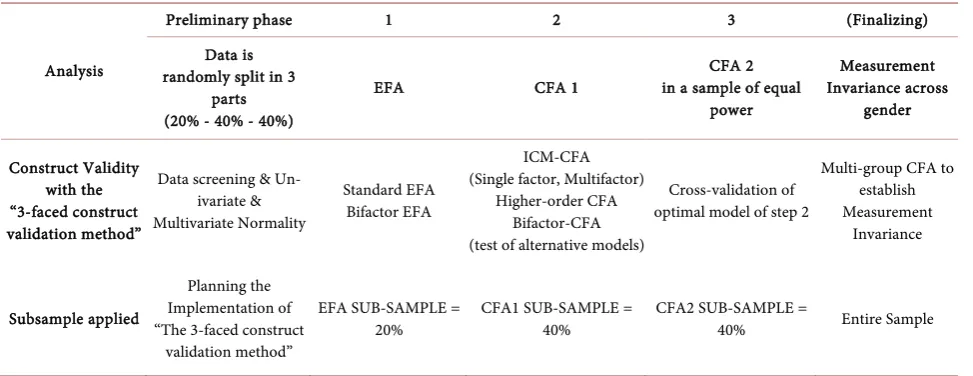
The sample was split in three parts to study the construct validity of SPANE-12 and SPANE-8 in 3 different subsamples (see Table 1). Research was applied in two levels: 1) on three subsamples (EFA, CFA1 and CFA2) to evaluate construct validity and confirm it; 2) on the full sample (Total sample), to evaluate strict measurement invariance across gender. This is a construct validation procedure we called the “3-faced construct validation method” (see also Kyriazos et al., in
press). More specifically, in the above method the sample is randomly split in
DOI: 10.4236/psych.2018.95071 1151 Psychology
Table 1. Overview of the “3-faced construct validation method”.
Analysis
Preliminary phase 1 2 3 (Finalizing)
Data is randomly split in 3
parts (20% - 40% - 40%)
EFA CFA 1 in a sample of equal CFA 2
power Measurement Invariance across gender Construct Validity with the “3-faced construct validation method”
Data screening & Un-ivariate & Multivariate Normality
Standard EFA Bifactor EFA
ICM-CFA (Single factor, Multifactor)
Higher-order CFA Bifactor-CFA (test of alternative models)
Cross-validation of optimal model of step 2
Multi-group CFA to establish Measurement Invariance Subsample applied Planning the Implementation of “The 3-faced construct
validation method”
EFA SUB-SAMPLE =
20% CFA1 SUB-SAMPLE = 40% CFA2 SUB-SAMPLE = 40% Entire Sample
EFA = Exploratory Factor Analysis, ICM-CFA = Independent Cluster Model Confirmatory Factor Analysis. EFA Bifactor = Bifactor Exploratory Factor Analysis.
an MGCFA finalizes the validation procedure to establish measurement inva-riance across gender or/and age using the optimal model as a baseline model. If either the CFA 2 or the measurement invariance fails to revalidate the optimal CFA1 model, then the second best model of the CFA 1 is crosschecked etc. (see Table 1 for an overview of the method). Note that if the sample is not adequate, then only CFA is implemented (keeping the N/p ratio threshold > 10/1) and measurement invariance with the Multiple Indicators Multiple Causes method (MIMIC) follows. The above steps is a generally suggested process of construct validation (c.f. Kyriazos et al., in press).
DOI: 10.4236/psych.2018.95071 1152 Psychology electronically on Google Forms® and were analyzed with SPSS Version 25 (IBM, 2017), Stata Version 14.2 (StataCorp, 2015) and MPlus Version 7.0 (Muthen & Muthen, 2012).
3. Results
3.1. Data Management
The full sample contained N = 2272 cases. All variables had no missing values because all the digital test-battery fields were required (see details in Procedure section).
To validate the factor structure of SPANE, the total sample (N = 2272) was randomly split into three parts (20%, 40% and 40%) to implement a construct validation procedure we call the “3-faced construct validation method” (see also Kyriazos et al., in press). Although splitting a sample is generally suggested for the development of new models(Schumacker & Lomax, 2015), the above analy-sis strategy was adopted because this sample was large enough to maintain ade-quate power after splitting. Specifically, the sample-to-variable ratio (N/p) for the EFA subsample (NEFA = 452), CFA1 subsample (NCFA1 = 910) and CFA2 sub-sample (NCFA2 = 910) was 37.67/1 and 75.83/1 respectively. An acceptable sam-ple-to-variable ratio can range anywhere from 10/1 (Osborne & Costello, 2004; Singh et al., 2016) to 20/1 (Schumacker & Lomax, 2015). Alternatively, a sample having 500 to 1000 cases is generally regarded either satisfactory or excellent (Comrey & Lee, 1992).
3.2. Univariate and Multivariate Normality
The data both in the total sample and the three subsamples violated the normal-ity assumption. Kolomogorov-Smirnov tests (Massey, 1951) on each individual item of SPANE-P and SPANE-N were statistically significant with no exception,
p = .000, indicating that items were non-normally distributed for the total sam-ple. Specifically, Kolomogorov-Smirnov for the total sample ranged from D
(2272) = .172, to D (2272) = .279, for the EFA subsample from D (452) =. 183, to
D (452) = .232, for the CFA1 subsample from D (910) = .187 to D (910) = .327 and finally for the CFA2 subsample from D (910) = .178 to D (910) = .287, p
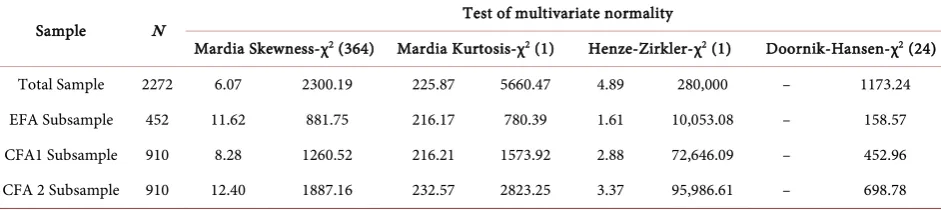
= .000 in all samples. Next, we evaluated multivariate normality with the follow-ing four tests: 1) Mardia’s multivariate kurtosis test(Mardia, 1970); 2) Mardia’s multivariate skewness test (Mardia, 1970); 3) Henz-Zirkler’s consistent test
(Henze & Zirkler, 1990), and 4) Doornik-Hansen omnibus test (Doornik &
Hansen, 2008). The null hypothesis was rejected for all four tests (all p values < .0001), suggesting a violation of multivariate normality in all four samples (Total, EFA subsample, CFA1 subsample, CFA2 subsample). The values of all multivariate tests are presented in Table 2.
3.3. Exploratory Factor Analysis (EFA)
DOI: 10.4236/psych.2018.95071 1153 Psychology
Table 2. Multivariate normality tests.
Sample N Test of multivariate normality
Mardia Skewness-χ2 (364) Mardia Kurtosis-χ2 (1) Henze-Zirkler-χ2 (1) Doornik-Hansen-χ2 (24)
Total Sample 2272 6.07 2300.19 225.87 5660.47 4.89 280,000 – 1173.24
EFA Subsample 452 11.62 881.75 216.17 780.39 1.61 10,053.08 – 158.57
CFA1 Subsample 910 8.28 1260.52 216.21 1573.92 2.88 72,646.09 – 452.96
CFA 2 Subsample 910 12.40 1887.16 232.57 2823.25 3.37 95,986.61 – 698.78
All p values < .0001.
a rescaling-based estimation method appropriate for non-normal distributions and—unlike similar estimators—it produces standard errors and chi-square test (Wang & Wang, 2012). Additionally, MLR is appropriate for sample-sizes rang-ing from for small to medium (Bentler & Yuan, 1999; Muthen & Asparouhov, 2002; Wang & Wang, 2012), like this split sample. The factors were rotated with Geomin factor rotation in the standard EFA model. Additionally, for the EFA Bifactor model, the technique proposed byJennrich and Bentler (2011) was ap-plied. EFA model fit was evaluated by the standards proposed by Hu & Bentler
(1999) and Brown (2015): RMSEA (≤ .06, 90% CI ≤ .06), SRMR (≤ .08), CFI
(≥ .95), TLI (≥ .95), and the chi-square / df ratio less than 3 (Kline, 2016). Mul-tiple indices used together, provided a more conservative and reliable estimation of the results (Brown, 2015).
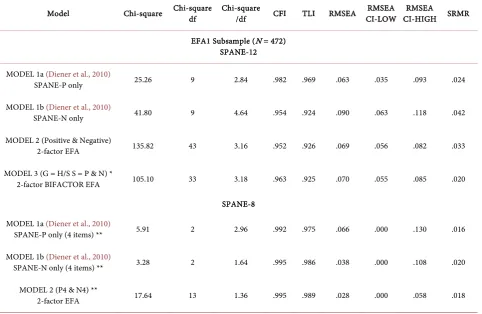
For both SPANE-12 and SPANE-8, a total of 5 EFA models were evaluated in the EFA subsample (N = 472). For SPANE-12, the following models were tested. MODEL 1a was proposed by Diener et al. (2010), and contains only the 6 posi-tive items of SPANE-12 (SPANE-P). Respecposi-tively, MODEL 1b contains only the 6 negative items of SPANE-12 (SPANE-N; Diener et al., 2010) to test the as-sumption that Positive and Negative affect are independent measures of PA and
NA (Crawford & Henry, 2004). MODEL 2 is a bi-dimensional EFA model with
SPANE-P and SPANE-N in two separate factors (proposed by Singh et al., 2017; attributed to Diener et al., 2010). Generally, this EFA model also served as a benchmark for the subsequent Bifactor EFA model. MODEL 3, is a Bifactor EFA model (Jennrich & Bentler, 2011). According to Reise et al. (2007) the evaluation of a Bifactor model is generally recommended when evaluating construct valid-ity (c.f. Hammer & Toland, 2016). The Schmid-Leiman method (Schmid &
Leiman, 1957) had been restricted to Bifactor CFA models until Jennrich &
Bentler’s (2011) proposed the Exploratory Bifactor Analysis method applied
meas-DOI: 10.4236/psych.2018.95071 1154 Psychology ures (see Table 2) achieved the prerequisite limits, Chi-square = 135.82, Chi-square/df = 3.16, RMSE = .069, CFI = .952, and TLI = .926, SRMR = .033, factor loadings .358 - .850, and factor correlation −.724.
For SPANE-8 the following alternative models were tested. MODEL 1a and 1b contained only the 6 items of SPANE-P and SPANE-N respectively (Diener et
al., 2010 for SPANE-12), to test the assumption that PA and NA are independent
constructs (Watson et al., 1988; Crawford & Henry, 2004). MODEL 2 was the two factor structure with SPANE-P and SPANE-N in two different factors. Re-garding the fit of the above SPANE-8 models, all fit indices showed acceptable fit. The 2-factor solution achieved the following fit measures (Chi-square = 17.64, Chi-square/df = 1.36, RMSE = .028, CFI = .995, and TLI = .989, SRMR = .018, factor loadings .390 - .893, and factor correlation −.584). Table 3 con-tains the fit statistics for all models.
3.4. Confirmatory Factor Analysis (CFA)
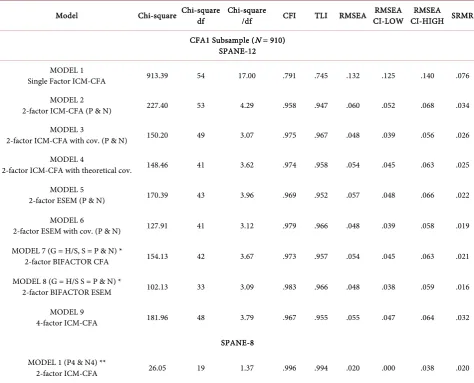
In this phase of the 3-faced construct validation method, we examined both SPANE-12 and SPANE-8 dimensionality further with Confirmatory Factor Analysis in a different subsample (40%, N = 910). The following criteria were applied to evaluate CFA model fit (Hu & Bentler, 1999; Brown, 2015): RMSEA (≤ .06, 90% CI ≤ .06), SRMR (≤ .08), CFI (≥ .95), TLI (≥ .95), and the chi-square /df ratio less than 3 (Kline, 2016).
For SPANE-12 the following 9 models were tested (see Table 4). MODEL 1 has both positive and negative experiences collapsed into one factor. It is a standard practice to test the assumption of maximum parsimony with a unidimensional ICM-CFA model (Crawford & Henry, 2004; Brown, 2015). However, in this case, the model is also based on the hypothesis that PA and NA are opposite ends of a single dimension(Russell & Carroll, 1999; Crawford & Henry, 2004). MODEL 2 has positive and negative experiences separated into two factors (also proposed by Giuntoli et al., 2017; Singh et al., 2017; Rahm et al., 2017; Silva &
Caetano, 2013; Sumi, 2014). MODEL 3 is a variation of MODEL 2 with three
DOI: 10.4236/psych.2018.95071 1155 Psychology
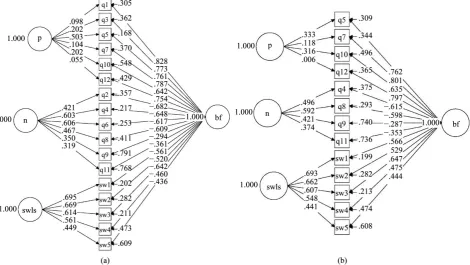
Figure 1. Path Diagrams of 2 alternative models of the total 9 tested for SPANE-12. (a)
2-factor ICM-CFA model with theoretical covariances between general and specific items; (b) A 4-factor model proposed (P General, P Specific, N General and N specific).
Table 3. EFA and bifactor EFA Fit statistics for SPANE-12 and SPANE-8.
Model Chi-square Chi-square df Chi-square /df CFI TLI RMSEA RMSEA CI-LOW CI-HIGH SRMR RMSEA
EFA1 Subsample (N = 472) SPANE-12
MODEL 1a (Diener et al., 2010)
SPANE-P only 25.26 9 2.84 .982 .969 .063 .035 .093 .024
MODEL 1b (Diener et al., 2010)
SPANE-N only 41.80 9 4.64 .954 .924 .090 .063 .118 .042
MODEL 2 (Positive & Negative)
2-factor EFA 135.82 43 3.16 .952 .926 .069 .056 .082 .033
MODEL 3 (G = H/S S = P & N) *
2-factor BIFACTOR EFA 105.10 33 3.18 .963 .925 .070 .055 .085 .020
SPANE-8
MODEL 1a(Diener et al., 2010)
SPANE-P only (4 items) ** 5.91 2 2.96 .992 .975 .066 .000 .130 .016
MODEL 1b (Diener et al., 2010)
SPANE-N only (4 items) ** 3.28 2 1.64 .995 .986 .038 .000 .108 .020
MODEL 2 (P4 & N4) **
2-factor EFA 17.64 13 1.36 .995 .989 .028 .000 .058 .018
[image:13.595.60.543.387.701.2]DOI: 10.4236/psych.2018.95071 1156 Psychology
Table 4. CFA Fit statistics for SPANE-12 and SPANE-8.
Model Chi-square Chi-square df Chi-square /df CFI TLI RMSEA RMSEA CI-LOW CI-HIGH SRMR RMSEA
CFA1 Subsample (N = 910) SPANE-12 MODEL 1
Single Factor ICM-CFA 913.39 54 17.00 .791 .745 .132 .125 .140 .076
MODEL 2
2-factor ICM-CFA (P & N) 227.40 53 4.29 .958 .947 .060 .052 .068 .034
MODEL 3
2-factor ICM-CFA with cov. (P & N) 150.20 49 3.07 .975 .967 .048 .039 .056 .026
MODEL 4
2-factor ICM-CFA with theoretical cov. 148.46 41 3.62 .974 .958 .054 .045 .063 .025
MODEL 5
2-factor ESEM (P & N) 170.39 43 3.96 .969 .952 .057 .048 .066 .022
MODEL 6
2-factor ESEM with cov. (P & N) 127.91 41 3.12 .979 .966 .048 .039 .058 .019
MODEL 7 (G = H/S, S = P & N) *
2-factor BIFACTOR CFA 154.13 42 3.67 .973 .957 .054 .045 .063 .021
MODEL 8 (G = H/S S = P & N) *
2-factor BIFACTOR ESEM 102.13 33 3.09 .983 .966 .048 .038 .059 .016
MODEL 9
4-factor ICM-CFA 181.96 48 3.79 .967 .955 .055 .047 .064 .032
SPANE-8
MODEL 1 (P4 & N4) **
2-factor ICM-CFA 26.05 19 1.37 .996 .994 .020 .000 .038 .020
Estimator = MLR. *G = General Affect Factor, S = Specific Positive and Negative factors, H/S = Happiness/Sadness. **SPANE-8 N (N4) = Bad, Sad, Afraid, Angry. **SPANE-8 P (P4) = Pleasant, Happy, Joyful, Contented.
MODEL 8 is a Bifactor ESEM (c.f. Reise, 2012; Marsh et al., 2013), model (never tested before). MODEL 9 is a 4-factor structure (never tested before). Factor 1 has 3 general positive items, factor 2 has 3 specific positive items, factor 3 has 3 general negative items and factor 4 has 3 specific negative items. This structure incorporates the additional differentiation of items in general and specific (Di-ener et al., 2010), apart from positive and negative (see Figure 1(b)). A higher order model was not tested due to misspecification, i.e. under-identification (Wang & Wang, 2012; Brown, 2015).
DOI: 10.4236/psych.2018.95071 1157 Psychology error covariances were permitted in specific SPANE-P and SPANE-N items, based on the categorization of items either as General or Specific (see Figure 1(a)). The fit of this model was acceptable, however MODEL 4 was less parsi-monious than MODEL 3. MODELS 5 and 6 were the ESEM models, with also an acceptable fit. The 12 items of SPANE-12 were allowed to load on both Positive and Negative Experiences factors in these two ESEM (Asparouhov & Muthen, 2009) models. Nevertheless, in this case there were no cross-loadings and the fit of ICM and ESEM models was equally satisfactory. Note, the primary factor loadings of 2-factor ESEM model ranged from .647 - .805 (SPANE-P) and .418 - .895 (SPANE-N) and factor correlation was −.628. Therefore, ESEM is most suitable than a corresponding ICM-CFA model when fitting the data better, otherwise the ICM-CFA model is preferable as more parsimonious(Marsh et al.,
2014). MODELS 7 and 8 were a Bifactor (Schmid & Leiman, 1957) CFA and a
Bifactor ESEM (c.f. Reise, 2012) model respectively (Figure 1) with also ade-quate fit to the data. However, Bifactor models always tend to show acceptable fit, thus they have been criticized as doubtful (Joshanloo, Jose, & Kielpikowski,
2017; Joshanloo & Jovanovic, 2016). MODEL 9 showed a decent fit with
meas-ures within acceptable limits but with less parsimonious structure (see Figure 1(b)).
Regarding the 2-factor ICM-CFA model tested for SPANE-8, it showed a good fit to the data, Chi-square = 26.05, Chi-square/df = 1.37, RMSE = .020, CFI = .996, and TLI = .994, SRMR = .020. The factor loadings for SPANE-8 P ranged from .639 to .771, and for SPANE-8 N from .413 to .811, with a factor correla-tion of −.662. Table 4 contains all the fit statistics for the 10 alternative CFA models tested for both SPANE versions.
To summarize the findings in the CFA 1 subsample (N = 910), the following models showed an overall optimal fit after considering fit measures, factor load-ings and factor intercorrelations: 1) for SPANE-12, the 2-factor ICM-CFA with 3 error covariances permitted in items 3 - 5, 7 - 12 and 2 - 8 (MODEL 3); 2) for SPANE-8, the 2-factor ICM-CFA. This bi-dimensional structure has also been proposed by many studies as optimal (Giuntoli et al., 2017; Singh et al., 2017; Rahm et al., 2017; Silva & Caetano, 2013; Sumi, 2014), supporting these prelimi-nary findings further.
3.5. Cross-Validating the Optimal CFA Model in a Different
Subsample
After determining that the 2-factor ICM-CFA model was the optimal structure emerging from the CFA 1 subsample (N = 910), for both SPANE-12 and SPANE-8, a crosscheck of this model followed to verify model fit in a second subsample (CFA2, N = 910) of equal power. See Table 1 for details about the “3-faced construct validation method” (see alsoKyriazos et al., in press).
Table 5 contains the results of this crosscheck CFA for SPANE-12 and
DOI: 10.4236/psych.2018.95071 1158 Psychology
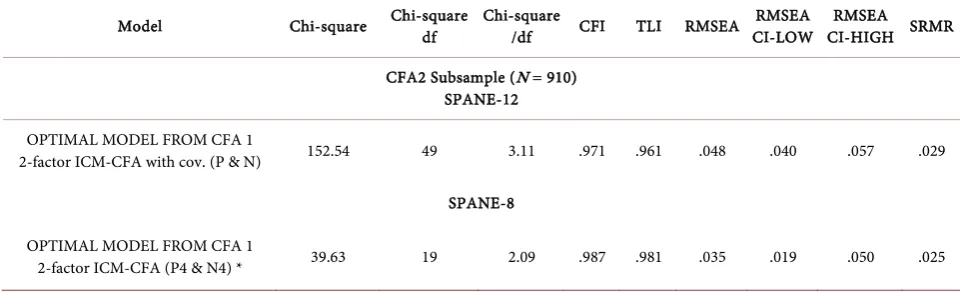
Table 5. CFA Fit statistics for SPANE-12 and SPANE-8 in the CFA2 subsample.
Model Chi-square Chi-square df Chi-square /df CFI TLI RMSEA RMSEA CI-LOW CI-HIGH SRMR RMSEA
CFA2 Subsample (N = 910) SPANE-12
OPTIMAL MODEL FROM CFA 1
2-factor ICM-CFA with cov. (P & N) 152.54 49 3.11 .971 .961 .048 .040 .057 .029
SPANE-8
OPTIMAL MODEL FROM CFA 1
2-factor ICM-CFA (P4 & N4) * 39.63 19 2.09 .987 .981 .035 .019 .050 .025
Estimator = MLR. *SPANE-8 N (N4) = Bad, Sad, Afraid, Angry. *SPANE-8 P (P4) = Pleasant, Happy, Joyful, Contented.
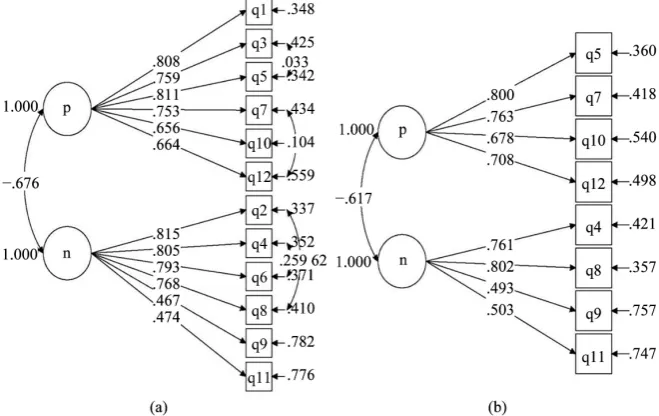
falling within the acceptable range with good fit for SPANE-12 (see Figure 2(a)) and achieving an equally good fit on all indices for SPANE-8 (see Figure 2(b)). Moreover, fit measures for both versions were also very stable across the two subsamples. Factor loadings were also adequate, ranging for SPANE-12 P from .656 to .811 and for SPANE-12 N from .467 to .815, with factors intercor-related at −.676. SPANE-8 factor loadings were equally adequate, both for SPANE-8 P (.678 - .800) and N (.493 - .802), with factors intercorrelated at −.617 (see Figure 2). All items loaded on the intended latent factors. After taking into consideration the above findings (fit statistics and factor loadings) for both SPANE versions, we used this successfully cross-validated 2-factor structure as a baseline model to evaluate measurement invariance across gender.
3.6. Measurement Invariance
For both SPANE versions, we examined measurement invariance across gender in the entire sample (N = 2272). The criteria used were ΔCFI ≤ −.01, and ΔRMSEA ≤ .015 (Chen, 2007). First, for SPANE-12, gender invariance of the 2-factor ICM CFA model with error covariances was tested separately in each gender group (males, N = 832 versus females, N = 1440), to establish a baseline model. This model had a good fit for males (Chi-square = 185.57, Chi-square/df = 3.71, RMSEA = .057, CFI = .965) and equally good for females (Chi-square = 202.77, Chi-square/df = 4.22, RMSEA = .047, CFI = .978). Then, this bi-dimensional baseline solution was tested in both gender groups simulta-neously (M1) showing adequate fit (see Table 6), thus configural invariance was supported. Next, to examine weak invariance, factor loadings were constrained to equality. As shown in Table 6, ΔCFI and ΔRMSEA for this constrained model (M2) confirmed weak invariance. Then, intercepts were forced to be equal (M3), and both ΔCFI and ΔRMSEA suggested that strong invariance was supported. Finally, to test strict invariance, the ultimate test of measurement invariance
(Wang & Wang, 2012), error variances were forced to be equal. ΔCFI and
DOI: 10.4236/psych.2018.95071 1159 Psychology
Table 6. Fit Measures of the nested models tested to validate measurement invariance.
Models Square Chi Df CFI RMSEA Model comparison ΔCFI ΔRMSEA
SPANE-12 (N = 2272) Measurement Invariance Across Gender
M1. Configural Invariance 388.26 98 .974 .051 – – –
M2. Weak Invariance 406.15 108 .973 .049 M2-M1 -.001 -.002
M3. Strong Invariance 498.13 120 .966 .053 M3-M2 -.007 .004
M4. Strict Invariance 499.33 132 .967 .049 M4-M3 .001 -.004
SPANE-8 (N = 2272)
Measurement Invariance Across Gender
M1. Configural Invariance 75.20 37 .993 .030 – – –
M2. Weak Invariance 85.91 43 .992 .030 M2-M1 -.001 .000
M3. Strong Invariance 164.69 51 .978 .044 M3-M2 -.014 .014
M4. Strict Invariance 175.64 59 .977 .042 M4-M3 -.001 -.002
MLR estimator was used in all models. Error covariances for men and women differ across models (c.f. Wang & Wang, 2012).
Figure 2. Path Diagrams of the Optimal 2-factor ICM-CFA models found from the CFA2
subsample, having equal power with CFA1 subsample (see 3-faced construct validation method). (a) Optimal SPANE-12 model; (b) optimal SPANE-8 Model.
[image:17.595.208.538.368.576.2]inva-DOI: 10.4236/psych.2018.95071 1160 Psychology riance (see Table 6). Then, factor loadings (MODEL 2), intercepts (MODEL 3) and error variances (MODEL 4) were consecutively constrained to equality. Model comparison indicated that fit measures were adequate with ΔCFI and ΔRMSEA within acceptable range for MODEL 2 to 1 (weak invariance), tolera-bly acceptable range for MODEL 3 to 2 (strong invariance), and equally accepta-ble for MODEL 4 to 3 (strict invariance).
3.7. Reliability and AVE Validity
Next, we evaluated the reliability and validity of SPANE-12 and SPANE-8 over the entire sample (N = 2272) using the following measures; 1) Cronbach’s alpha
(α; Cronbach, 1951) to examine internal consistency of the responses. Alpha
values above .70 are generally acceptable (Hair et al., 2010), and above .80 ade-quate (Kline, 2000; Nunnally & Berstein, 1994); 2) Omega Total coefficient (ω total; McDonald, 1999; Werts, Lim, & Joreskog, 1974) to examine construct re-liability (Hoque et al., 2017). Omega corresponds either to variance accounted by all factors or by each latent factor separately (Brunner et al., 2012). For omega a, value of .70 or greater is acceptable (Hair et al., 2010); 3) Average Variance Extracted (AVE; Fornell & Larcker, 1981) to evaluate convergent validity. Mal-hotra & Dash (2011) note that ω alone is weak, potentially allowing an error va-riance as high as 50%. Therefore, AVE in combination with ω coefficient offers a more conservative estimation of convergent validity (Malhotra & Dash, 2011). The threshold for AVE is .50 (Fornell & Larcker, 1981; Hair et al., 2010; Awang et al., 2015).
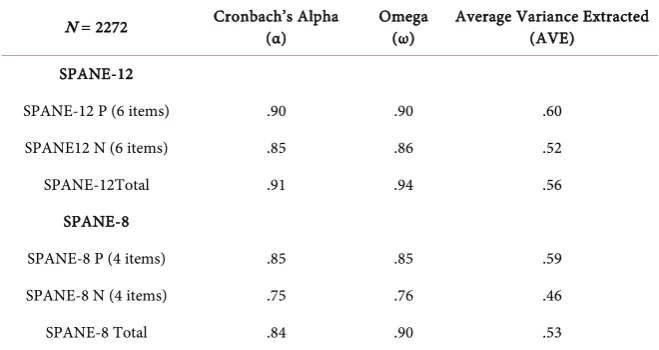
The internal reliability of SPANE-12 total was significant. On average, for each SPANE-12 factor, alpha coefficients were adequate (M = .88). Similarly, for SPANE-8 total internal reliability was satisfactory and on average alpha coeffi-cients for the two factors were also good (M = .80); see Table 7. Likewise, omega reliability coefficient for the total SPANE-12 was substantial (.94) and for each factor on average satisfactory, and equal to alpha, M = .88. This value suggests that mean percentage variance explained by each SPANE-12 factor score is 88%. For the total SPANE-8, omega coefficient was also significant (.90) and for each factor on average sufficient (M = .81), indicating a mean percentage of explained variance per factor score of 81% (see Table 7). Regarding AVE, Total AVE was significant for both versions. For SPANE-12 per factor AVE was on average adequate, M = . 56, and for SPANE-8 equally adequate, M = .53 (Table 7).
3.8. Correlation Analysis to Examine Convergent and
Discriminant Validity
DOI: 10.4236/psych.2018.95071 1161 Psychology
Table 7. Reliability and AVE Convergent Validity of SPANE-12 and SPANE-8.
N = 2272 Cronbach’s Alpha (α) Omega (ω) Average Variance Extracted (AVE)
SPANE-12
SPANE-12 P (6 items) .90 .90 .60
SPANE12 N (6 items) .85 .86 .52
SPANE-12Total .91 .94 .56
SPANE-8
SPANE-8 P (4 items) .85 .85 .59
SPANE-8 N (4 items) .75 .76 .46
SPANE-8 Total .84 .90 .53
SPANE-8 N = Bad, Sad, Afraid, Angry. SPANE-8 P = Pleasant, Happy, Joyful, Contented.
scales comprising trait HOPE(Snyder et al., 1991), Brief Resilience Scale (BRS; Smith et al., 2008), Meaning in life Questionnaire (MLQ; Steger et al., 2006) and Gratitude 6 Questionnaire (McCullough et al., 2002); 4) aspects of life quality like Physical health, Psychological health, Social Relations and Environment (from WHOQOL-BFEF; WHOQOL Group, 1998a, 1988b). We examined results both for SPANE-12 and SPANE-8 as well as correlation between them (presented
in Table 8). Concerning the correlations between SPANE and Group 1 (Mental
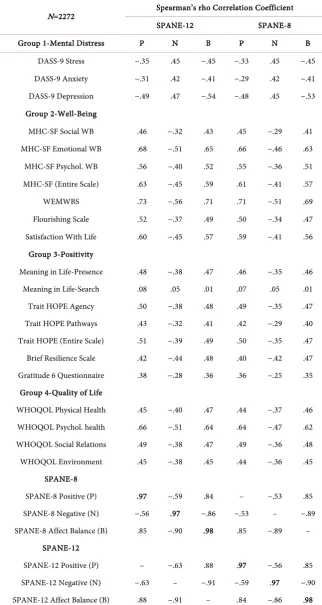
Distress Scales), correlations of SPANE-12 P, SPANE-12 Nand SPANE-12 B with DASS-9 ranged from moderate to strong, M = −.38, M = .45 and M = −.47 re-spectively. The correlations of SPANE-8 P, SPANE-8 N and SPANE-8 Bwith DASS-9 were also moderately strong (M = −.37, M = .44, M = −.46).
The correlations between SPANE-12 P and Group 2 (Well-Being Scales) were on average strong (M = .60). Note that WEMWB and Emotional WB showed the strongest correlations. The correlations between SPANE-12 N and Group 2 were on average moderate to strong (M = −.44). SPANE-12 B had a strong, positive correlation with Group 2 (M = .56). Similarly, correlations between SPANE-8 P and Group 2 were on average strong (M = .58), with WEMWBS and Emotional WB being the strongest. The correlations between SPANE-8 N and Group 2 were negative and on average moderately strong (M = −.40). The correlations between SPANE-8 B and Group 2 were positive and on average strong (M = .55).
DOI: 10.4236/psych.2018.95071 1162 Psychology
Table 8. Bivariate Correlations between SPANE-12, SPANE-8 and other measures.
N=2272 Spearman’s rho Correlation Coefficient
SPANE-12 SPANE-8
Group 1-Mental Distress P N B P N B
DASS-9 Stress −.35 .45 −.45 −.33 .45 −.45
DASS-9 Anxiety −.31 .42 −.41 −.29 .42 −.41
DASS-9 Depression −.49 .47 −.54 −.48 .45 −.53
Group 2-Well-Being
MHC-SF Social WB .46 −.32 .43 .45 −.29 .41
MHC-SF Emotional WB .68 −.51 .65 .66 −.46 .63
MHC-SF Psychol. WB .56 −.40 .52 .55 −.36 .51
MHC-SF (Entire Scale) .63 −.45 .59 .61 −.41 .57
WEMWBS .73 −.56 .71 .71 −.51 .69
Flourishing Scale .52 −.37 .49 .50 −.34 .47
Satisfaction With Life .60 −.45 .57 .59 −.41 .56
Group 3-Positivity
Meaning in Life-Presence .48 −.38 .47 .46 −.35 .46
Meaning in Life-Search .08 .05 .01 .07 .05 .01
Trait HOPE Agency .50 −.38 .48 .49 −.35 .47
Trait HOPE Pathways .43 −.32 .41 .42 −.29 .40
Trait HOPE (Entire Scale) .51 −.39 .49 .50 −.35 .47
Brief Resilience Scale .42 −.44 .48 .40 −.42 .47
Gratitude 6 Questionnaire .38 −.28 .36 .36 −.25 .35
Group 4-Quality of Life
WHOQOL Physical Health .45 −.40 .47 .44 −.37 .46
WHOQOL Psychol. health .66 −.51 .64 .64 −.47 .62
WHOQOL Social Relations .49 −.38 .47 .49 −.36 .48
WHOQOL Environment .45 −.38 .45 .44 −.36 .45
SPANE-8
SPANE-8 Positive (P) .97 −.59 .84 – −.53 .85
SPANE-8 Negative (N) −.56 .97 −.86 −.53 – −.89
SPANE-8 Affect Balance (B) .85 −.90 .98 .85 −.89 –
SPANE-12
SPANE-12 Positive (P) – −.63 .88 .97 −.56 .85
SPANE-12 Negative (N) −.63 – −.91 −.59 .97 −.90
SPANE-12 Affect Balance (B) .88 −.91 – .84 −.86 .98
DOI: 10.4236/psych.2018.95071 1163 Psychology Regarding the correlations of SPANE with Group 4 (Quality of life Scales), SPANE-12 P, SPANE-12 N and SPANE-12 B had on average strong correlations (M = .51, M = −.42, M = .51). SPANE-8 P, SPANE-8 N and SPANE-8 B also had on average a strong correlation with Group 4 (M = .50, M = −.39, M = .50). Fi-nally, about the correlations between the two SPANE versions, SPANE-12 P, SPANE-12 N and SPANE-12 B were strongly correlated with their equivalent SPANE-8 factors with values as high as .97, .97 and .98 respectively, all p < .01 (see Table 8).
3.9. Evaluation of the Bifactor CFA Subjective Well-Being Model
For the measurement of subjective well-being, empirical literature(Linley et al., 2009) suggests using two constructs: 1) positive/negative affect, and 2) life satis-faction. The current study examined if the above empirical hierarchical model of subjective well-being (empirically by Linley et al., 2009; also postulated by Di-ener, Suh, Lucas, & Smith, 1999 as quoted in Ruini, 2017) is confirmable in the current sample with a Bifactor CFA structure. Bifactor structure is an alternative to original proposed higher-order CFA model (Linley et al., 2009) because it successfully reproduces higher order structures (Howard et al., 2016) which in this case is inapplicable due to misspecification (Wang & Wang, 2012; Brown, 2015).To test this Bifactor SWB model (see Figure 3) we used the Satisfaction with Life Scale (Diener et al., 1985) to measure life satisfaction and the two newly va-lidated SPANE versions (SPANE-12 and SPANE-8) to measure affect. Specifi-cally, we tested two Bifactor CFA models. The first had a general subjective well-being factor and SWLS, SPANE-12 P and SPANE12-N as specific factors
(Figure 3(a)). The second had a general subjective well-being factor and SWLS,
SPANE-8 P and SPANE 8-N as specific factors (Figure 3(b)). The SWB model of both SPANE versions had an adequate fit (see Table 9), with all measures within acceptable limits, and chi-square/df on the verge of acceptability. The sa-tisfactory fit of the model to the data suggests that the proposed subjective well-being model is tenable using SPANE-12 or SPANE-8 to measure the affect component (see Figure 3).
3.10. Normative Data for SPANE-12 & SPANE-8
For both SPANE versions tested the means and ranges for the SPANE-P, SPANE-N and SPANE-B dimensions for the total sample (N = 2272) are pre-sented in Table 10.
DOI: 10.4236/psych.2018.95071 1164 Psychology
Figure 3. The subjective well-being measure using the Bifactor CFA method. (a) With SPANE-12 and SWLS as specific factors
[image:22.595.61.543.419.609.2]and a general subjective well-being factor (b) with SPANE-8 and SWLS as specific factors and a general subjective well-being Factor.
Table 9. Fit statistics for the subjective well-being Bifactor CFA Model for SPANE-12 and SPANE-8.
Model Chi-square Chi-square df Chi-square /df CFI TLI RMSEA CI-LOW RMSEA CI-HIGH RMSEA SRMR
N = 2272 Subjective well-being model
Bifactor CFA MODEL 1 (General factor = SWB,
Specific 1 = SWLS Specific 2 = SPANE-12-P Specific 3 = SPANE-12-N
621.36 103 6.03 .970 .960 .047 .044 .051 .036
Bifactor CFA MODEL 2 (General factor = SWB,
Specific 1 = SWLS Specific 2 = SPANE-8-P* Specific 3 = SPANE-8-N*
259.55 53 4.90 .981 .973 .041 .036 .047 .040
Estimator = MLR, *SPANE-8 N = Bad, Sad, Afraid, Angry, *SPANE-8 P = Pleasant, Happy, Joyful, Contented.
Table 10. Summary statistics and raw scores of SPANE converted to percentiles.
N = 2272 Mean Range Percentile
5 10 25 50 75 90 95
SPANE-12
[image:22.595.57.541.658.729.2]DOI: 10.4236/psych.2018.95071 1165 Psychology Continued
SPANE-12 N 15 6 - 30 8.00 9.00 12.00 15.00 18.00 21.00 24.00
SPANE-12 B 7.1 −23 - 24 −8.00 −4.00 2.00 8.00 13.00 17.00 20.00
SPANE-8
SPANE-8 P 14.58 4 - 20 9.00 10.00 13.00 15.00 16.00 18.00 20.00
SPANE-8 N 9.95 4 - 20 5.00 6.00 8.00 10.00 12.00 14.00 16.00
SPANE-8 B 4.63 −16 - 16 −6.00 −3.00 1.00 5.00 9.00 11.00 13.00
and 7 on SPANE-B (53%), as reported by Diener et al. (2010). In turn, for SPANE-8 the 50% of the respondents of our sample had a score ≤ 15, ≤ 10 and ≤ 5 in Positive Experiences, Negative Experiences and Affect Balance respectively (see Table 10).
4. Discussion
The purpose of this study was to examine the construct validity of two versions of SPANE: SPANE-12(Diener et al., 2010) and SPANE-8. SPANE-8 is a new, shorter version proposed by the present study. SPANE-8 contains 1 instead of 3 items of general affect in each original SPANE factor(Diener et al., 2010: p. 145). Among the general positive and negative items, 2 items with the lowest CFA factor loadings were excluded. This resulted to a briefer and more parsimonious structure with a total of 4 positive (Pleasant, Happy, Joyful, Contented) and 4 negative (Bad, Sad, Afraid, Angry) items. Items excluded were: 1) In SPANE-P item 1 (positive) and 3 (good) and 2) In SPANE-N item 2 (negative) and 6 ( un-pleasant).
The main findings that emerged for both SPANE versions are: 1) the two fac-tor model (with SPANE-P and SPANE-N as dimensions) showed the optimal fit (also proposed by Giuntoli et al., 2017; Singh et al., 2017; Rahm et al., 2017; Silva & Caetano, 2013; Sumi, 2014 and attributed to Diener et al., 2010); 2) full, strict measurement invariance across gender was supported; 3) alpha and omega re-liability and AVE convergent validity were adequate; 4) a consistent, overarching pattern of relationships was present from the correlation analysis, common for both versions; 5) the SPANE-12 and SPANE-8 had a high positive correlation indicating that on average 97% of the variance in SPANE-12 is explained by SPANE-8; 6) a Bifactor CFA Subjective well-being model (in a similar vein by
Linley et al., 2009) was tenable in our data using both SPANE-12 and SPANE-8
to measure affect.
DOI: 10.4236/psych.2018.95071 1166 Psychology
(see also Kyriazos et al., in press and Table 1 for an overview), the sample is randomly split in three parts (20%, 40% and 40%) keeping the N/p ratio thre-shold for EFA to 5/1 and for CFA to 10/1. The first 20% is used for EFA. The second 40% is used for an explorative CFA (CFA 1) to test a minimum of the following alternative models: a single-factor ICM-CFA, a multifactor ICM-CFA, a Bifactor CFA and a Higher-order CFA (if applicable). In this study, additional alternative models tested in CFA1 were an ESEM model and a Bifactor ESEM model. Next, the third 40% for a crosscheck CFA (CFA 2) is used to verify the optimal model (or competing optimal models) of CFA 1 in a different subsample of equal power. If the CFA 2 fails to revalidate the optimal CFA 1 model, then the second best model is crosschecked etc. Measurement invariance using the cross-validated model as a baseline model is the final phase of the method (see
Table 1 for an overview of the method). Note that if the sample is not adequate
only CFA is performed (keeping the N/p ratio threshold > 10/1) and measure-ment invariance with the Multiple Indicators Multiple Causes method (MIMIC) follows. In this study the sample-size was adequate to permit sample splitting. Regarding sample power, all three samples were far beyond the suggested thre-shold of 5 to10 cases for each observed variable (Osborne & Costello, 2004; Singh et al., 2016) or even the stricter 20 cases for each observed variable (Schu-macker & Lomax, 2015).
In the first phase of the “3-faced construct validation method”, a total five al-ternative EFA models were tested for both versions—3 for SPANE-12 and 2 for SPANE-8 in the 20% subsample. Models tested included single, and two factor structures. Single structures had only the SPANE-P and SPANE-N as two inde-pendent structures to imitate the factorial structure proposed by Diener et al. (2010), with adequate results for both SPANE versions (12 & 8). For SPANE-12 we also tested a 2-factor Bifactor EFA model. In EFA, the 2-factor solution (also tested by Singh et al., 2017) achieved acceptable fit in all fit indices and the 2-factor Bifactor model showed comparably adequate fit. However, a predomi-nant general Happiness/Sadness factor is not necessarily present since dimen-sionality based only on Bifactor analysis is often regarded questionable (Joshan-loo et al., 2017; Joshan(Joshan-loo & Jovanovic, 2016).
To confirm results of the EFA in the second phase of the “3-faced construct validation method”, we used a new 40% subsample of to explore alternative structures for both SPANE-12 and SPANE-8 versions. CFA has turned into the ubiquitous test of construct validity in psychological measurement(Howard et
al., 2016). We tested a total of 9 alternative SPANE-12 models and the 2-factor
DOI: 10.4236/psych.2018.95071 1167 Psychology positive items, factor 2 containing 3 specific positive items, factor 3 tapping 3 general negative items and factor 4 containing 3 specific negative items. This structure was based on an additional differentiation of items in “general” and “specific”(Diener et al., 2010: p. 145), apart from positive and negative. We did not test a higher order model due to misspecification constrains (Wang & Wang, 2012; Brown, 2015). However, Bifactor results has been criticized at certain con-ditions as questionable (Reise, 2012; Joshanloo et al., 2017).
Considering fit measures and factor loadings, the 2-factor model with 3 error covariances showed the optimal fit. Thus, reaching the 3rd phase of the “3-faced
construct validation method”, the optimal CFA 1 model was subsequently cross-validated with satisfactory results in the third subsample (also 40%). This cross-validation was performed for both versions of SPANE (12 & 8). This bi-dimensional, cross-validated solution for SPANE 12 is in line with many oth-er similar empirical findings (Giuntoli et al., 2017; Singh et al., 2017; Rahm et al., 2017; Silva & Caetano, 2013; Sumi, 2014, attributed to Diener et al., 2010) and it was supported for SPANE-8 as well. Also, in line with previous CFA research, the two SPANE factors were intercorrelated with a strong negative correlation (Giuntoli et al., 2017; Singh et al., 2017; Silva & Caetano, 2013; Li et al., 2013).
The results of measurement invariance across gender (c.f. Brown, 2015; Byrne, 2010; Kline, 2016; Schumacker & Lomax, 2015) of this cross-validated bi-di- mensional ICM-CFA model suggested that all SPANE-12 and SPANE-8 items were invariant (full, strict measurement invariance). Furthermore, the results supporting the measurement invariance across gender are adding to previous research findings in several diverse cultures (Li et al., 2013; Giuntoli et al., 2017;
Singh et al., 2017). Damasio & Koller (2015) comment that invariance adds a
significant quality advantage enabling valid group comparisons across gender, free from response bias.
cal-DOI: 10.4236/psych.2018.95071 1168 Psychology culated both for SPANE-12 and SPANE-8.
Finally, we successfully tested a Bifactor CFA Subjective Well-being model using SPANE (originally by Linley et al., 2009 as a higher order structure). Sub-jective well-being is operationalized having an affective (emotional) component and a cognitive, judgmental component about life satisfaction (Linley et al.,
2009). Thus, the measurement of subjective well-being consists of a
posi-tive/negative affect measure (here SPANE) and a life satisfaction measure (here SWLS by Diener et al., 1985; c.f. Govindji & Linley, 2007; Linley et al., 2009). We built two alternative models using either SPANE-12 or SPANE-8 for the affective component and SWLS for the cognitive life satisfaction component. The ade-quate fit of both models, especially the SPANE-8 model, is an indication that the SWB models is tenable in this sample.
5. Conclusions
We have addressed the issue of construct validity and full strict measurement invariance for two alternative versions of SPANE. We concluded that both the original SPANE-12 and the newly established SPANE-8 confirmed the bi-di- mensional model with the two components of affect in two factors. Additionally, SPANE-12 and SPANE-8 are measurement invariant across gender (strict inva-riance). Our findings confirmed the robustness of SPANE-12, suggesting at the same time that SPANE-8 has equally sound psychometric properties, and a more parsimonious structure, being shorter. The two versions are strongly correlated. Normative data were also calculated for both versions.
Nevertheless, this study has certain limitations that should be taken into ac-count when interpreting the results. First, psychology students participated in data administration through an electronic test battery. The effects of this proce-dure are unspecified. Second, SPANE-8 findings are encouraging, however addi-tional evaluation of its structure is necessary to different samples. Third, the measurement invariance across gender had a rather imbalanced sample of men versus women. All above limitations considered, the present study adds to present affect research by: 1) providing evidence that the Greek version of the original 12-item SPANE (Diener et al., 2010) is a robust measure of affect. The construct validation was implemented using a new sample-splitting based pro-cedure we call “3-faced construct validation method”; 2) providing a newer, briefer version, the SPANE-8, with sound psychometric properties and norma-tive data; 3) proving the strict measurement invariance of both above versions; 4) modeling Subjective wellbeing with a Bifactor CFA model using SPANE to measure the affect component; 5) calculating normative data for the Greek cul-tural context.
References
DOI: 10.4236/psych.2018.95071 1169 Psychology Awang, Z., Afthanorhan, A., & Asri, M. A. M. (2015). Parametric and Non Parametric
Approach in Structural Equation Modeling (SEM): The Application of Bootstrapping. Modern Applied Science, 9, 58-67. https://doi.org/10.5539/mas.v9n9p58
Bai, X., Wu, C., Zheng, R., & Ren, X. (2011). The Psychometric Evaluation of the Satisfac-tion with Life Scale Using a NaSatisfac-tionally Representative Sample of China. Journal of Happiness Studies, 12, 183-197. https://doi.org/10.1007/s10902-010-9186-x
Bentler, P. M., & Yuan, K. H. (1999). Structural Equation Modeling with Small Samples: Test of Global Self-Esteem. Journal of Personality and Social Psychology, 89, 623-642. Brislin, R. W. (1970). Back-Translation for Cross-Cultural Research. Journal of Cross-Cultural
Psychology, 1, 185-216. https://doi.org/10.1177/135910457000100301
Brown, T. A. (2015). Confirmatory Factor Analysis for Applied Research (2nd ed.). New York: Guilford Publications.
Byrne, B. M. (2010). Structural Equation Modeling with AMOS: Basic Concepts, Applica-tions, and Programming (2nd ed.). New York: Routledge.
Chen, F. F. (2007). Sensitivity of Goodness of Fit Indexes to Lack of Measurement Inva-riance. Structural Equation Modeling, 14, 464-504.
https://doi.org/10.1080/10705510701301834
Clark, D. A., Steer, R. A., & Beck, A. T. (1994). Common and Specific Dimensions of Self-Reported Anxiety and Depression: Implications for the Cognitive and Tripartite Models. Journal of Abnormal Psychology, 103, 645-654.
https://doi.org/10.1037/0021-843X.103.4.645
Clark, L., & Watson, D. (1991). Tripartite Model of Anxiety and Depression: Psychome-tric Evidence and Taxonomic Implications. Journal of Abnormal Psychology, 100, 316-336. https://doi.org/10.1037/0021-843X.100.3.316
Comrey, A. L., & Lee, H. B. (1992). A First Course in Factor Analysis (2nd ed.). Hillsdale, NJ: Erlbaum.
Costa, P. T., & McCrae, R. R. (1980). Influence of Extraversion and Neuroticism on Sub-jective Well-Being: Happy and Unhappy People. Journal of Personality and Social Psychology, 38, 668-678. https://doi.org/10.1037/0022-3514.38.4.668
Crawford, J. R., & Henry, J. D. (2004). The Positive and Negative Affect Schedule (PANAS): Construct Validity, Measurement Properties and Normative Data in a Large Non-Clinical Sample. British Journal of Clinical Psychology, 43, 245-265.
https://doi.org/10.1348/0144665031752934
Cronbach, L. J. (1951). Coefficient Alpha and the Internal Structure of Tests. Psychome-trika, 16, 297-334. https://doi.org/10.1007/BF02310555
Damasio, B., & Koller, S. H. (2015). Meaning in Life Questionnaire: Adaptation Process and Psychometric Properties of the Brazilian Version. Revista Latinoamericana de Psi-cología, 47, 185-195. https://doi.org/10.1016/j.rlp.2015.06.004
DeVellis, R. F. (2017). Scale Development:Theory and Applications (4th ed.). Thousand Oaks, CA: Sage.
Diener, E. (1984). Subjective Well-Being. Psychological Bulletin, 95, 542-575. https://doi.org/10.1037/0033-2909.95.3.542
Diener, E. D., Colvin, C. R., Pavot, W. G., & Allman, A. (1991). The Psychic Costs of In-tense Positive Affect. Journal of Personality and Social Psychology, 61, 492-503. https://doi.org/10.1037/0022-3514.61.3.492
Diener, E., Emmons, R. A., Larsen, R. J., & Griffin, S. (1985). The Satisfaction with Life Scale. Journal of Personality Assessment, 49, 71-75.
DOI: 10.4236/psych.2018.95071 1170 Psychology Diener, E., Sandvik, E., & Pavot, W. (1991). Happiness Is the Frequency, Not the Intensi-ty, of Positive versus Negative Affect. In F. Strack, M. Argyle, & N. Schwarz (Eds.), Subjective Well-Being: An Interdisciplinary Perspective (pp. 213-231). Dordrecht: Springer.
Diener, E., Suh, E. M., Lucas, R. E., & Smith, H. L. (1999). Subjective Well-Being: Three Decades of Progress. Psychological Bulletin, 125, 276-302.
https://doi.org/10.1037/0033-2909.125.2.276
Diener, E., Wirtz, D., Biswas-Diener, R., Tov, W., Kim-Prieto, C., Choi, D., & Oishi, S. (2009). New Measures of Well-Being. In E. Diener (Eds.), Assessing Well-Being. Social Indicators Research Series (Vol. 39, pp. 247-266). Dordrecht: Springer.
https://doi.org/10.1007/978-90-481-2354-4_12
Diener, E., Wirtz, D., Tov, W., Kim-Prieto, C., Choi, D, Oishi, S., & Biswas-Diener, R. (2010). New Well-Being Measures: Short Scales to Assess Flourishing and Positive and Negative Feelings. Social Indicators Research, 97, 143-156.
https://doi.org/10.1007/s11205-009-9493-y
Doornik, J. A., & Hansen, H. (2008). An Omnibus Test for Univariate and Multivariate Normality. Oxford Bulletin of Economics and Statistics, 70, 927-939.
https://doi.org/10.1111/j.1468-0084.2008.00537.x
Fornell, C., & Larcker, D. F. (1981). Structural Equation Models with Unobservable Va-riables and Measurement Error: Algebra and Statistics. Journal of Marketing Research, 18, 382-388. https://doi.org/10.2307/3150980
Giuntoli, L., Ceccarini, F., Sica, C., & Caudek, C. (2017). Validation of the Italian Ver-sions of the Flourishing Scale and of the Scale of Positive and Negative Experience. SAGE Open, 7, 1-12.
Govindji, R., & Linley, P. A. (2007). Strengths Use, Self-Concordance and Well-Being: Implications for Strengths Coaching and Coaching Psychologists. International Coaching Psychology Review, 2, 143-153.
Gray, E. K., & Watson, D. (2007). Assessing Positive and Negative Affect via Self-Report. In J. A. Coan, & J. J. B. Allen (Eds.), Handbook of Emotional Elicitation and Assess-ment (pp. 171-183). New York: Oxford University Press.
Guadagnoli, E., & Velicer, W. F. (1988). Relation to Sample Size to the Stability of Com-ponent Patterns. Psychological Bulletin, 103, 265-275.
https://doi.org/10.1037/0033-2909.103.2.265
Hair, J., Black, W., Babin, B., & Anderson, R. (2010). Multivariate Data Analysis (7th ed.). Upper Saddle River, NJ: Prentice-Hall, Inc.
Hammer, J. H., & Toland, M. D. (2016). Bifactor Analysis in Mplus. Lexington, KY: Uni-versity of Kentucky. http://sites.education.uky.edu/apslab/upcoming-events/
Henze, N., & Zirkler, B. (1990). A Class of Invariant Consistent Tests for Multivariate Normality. Communications in Statistics: Theory and Methods, 19, 3595-3617. https://doi.org/10.1080/03610929008830400
Hoque, A. S., Awang, Z., Jusoff, K., Salleh, F., & Muda, H. (2017). Social Business Effi-ciency: Instrument Development and Validation Procedure Using Structural Equation Modeling. International Business Management, 11, 222-231.
Howard, J., Gagné, M., Morin, A. J. S., Wang, Z. N., & Forest, J. (2016). Using Bifactor Exploratory Structural Equation Modeling to Test for a Continuum Structure of Moti-vation. Journal of Management, 1-59.
Model-DOI: 10.4236/psych.2018.95071 1171 Psychology ing, 6, 1-55. https://doi.org/10.1080/10705519909540118
IBM (2017). IBM SPSS Statistical Software, Release 25. Spring House, PA: IBM Corpora-tion.
Jennrich, R. I., & Bentler, P. M. (2011). Exploratory Bi-Factor Analysis. Psychometrika, 76, 537-549. https://doi.org/10.1007/s11336-011-9218-4
Jolly, J. B., Dyck, M. J., Kramer, T. A., & Wherry, J. N. (1994). Integration of Positive and Negative Affectivity and Cognitive Content-Specificity: Improved Discrimination of Anxious and Depressive Symptoms. Journal of Abnormal Psychology, 103, 544-552. https://doi.org/10.1037/0021-843X.103.3.544
Joshanloo, M., & Jovanovic, V. (2016). The Factor Structure of the Mental Health Conti-nuum-Short Form (MHC-SF) in Serbia: An Evaluation Using Exploratory Structural Equation Modeling. Journal of Mental Health, 26, 510-515.
https://doi.org/10.1080/09638237.2016.1222058
Joshanloo, M., Jose, P. E., & Kielpikowski, M. (2017). The Value of Exploratory Structural Equation Modeling in Identifying Factor Overlap in the Mental Health Conti-nuum-Short Form (MHC-SF): A Study with a New Zealand Sample. Journal of Happi-ness Studies, 18, 1061-1074. https://doi.org/10.1007/s10902-016-9767-4
Jovanović, V. (2015). Beyond the PANAS: Incremental Validity of the Scale of Positive and Negative Experience (SPANE) in Relation to Well-Being. Personality and Individ-ual Differences, 86, 487-491. https://doi.org/10.1016/j.paid.2015.07.015
Kashdan, T. B., Biswas-Diener, R., & King, L. A. (2008). Reconsidering Happiness: The Costs of Distinguishing between Hedonics and Eudaimonia. The Journal of Positive Psychology, 3, 219-233. https://doi.org/10.1080/17439760802303044
Keyes, C. L. M. (2002). The Mental Health Continuum: From Languishing to Flourishing in Life. Journal of Health and Social Behavior, 43, 207-222.
https://doi.org/10.2307/3090197
Keyes, C. L. M. (2005). The Subjective Well-Being of America’s Youth: Toward a Com-prehensive Assessment. Adolescent and Family Health, 4, 3-11.
Keyes, C. L. M. (2006). Subjective Well-Being in Mental Health and Human Development Research Worldwide: An Introduction. Social Indicators Research, 77, 1-10.
https://doi.org/10.1007/s11205-005-5550-3
Keyes, C. L. M., & Magyar-Moe, J. L. (2003). The Measurement and Utility of Adult Sub-jective Well-Being. In S. J. Lopez, & C. R. Snyder (Eds.), Positive Psychological As-sessment: A Handbook of Models and Measures (pp. 411-425). Washington DC: American Psychological Association. https://doi.org/10.1037/10612-026
Keyes, C. L. M., Wissing, M., Potgieter, J., Temane, M., Kruger, A., & van Rooy, S. (2008). Evaluation of the Mental Health Continuum-Short Form (MHC-SF) in Setswa-na-Speaking South Africans. Clinical Psychology and Psychotherapy, 15, 181-192. https://doi.org/10.1002/cpp.572
Kline, P. (2000). Handbook of Psychological Testing. London, UK: Routledge.
Kline, R. B. (2016). Principles and Practice of Structural Equation Modeling (4th ed.). New York: The Guilford Press.
Kyriazos, T. A., Stalikas, A., Prassa, K., & Yotsidi, V. (in press). Can the Depression An-xiety Stress Scales Short Be Shorter? Factor Structure and Measurement Invariance of DASS-21 and DASS-9 in a Greek, Non-Clinical Sample. Psychology.