Functional and Multivariate Hydrological Data
Visualization and outlier Detection of Sukkur Barrage
Insia Hussain
Department of Statistics, University of Karachi University Road, Karachi, Pakistan
Mudassir Uddin
Department of Statistics, University of Karachi University Road, Karachi, Pakistan
ABSTRACT
The risk of flood prevention and to make the management and planning of hydrological resources effective, it is required to analyse and measure the flow of water continuously at a number of barrages and dams. The flow variation over a certain time period can graphically be represented through hydrograph for any barrage considered. The hydrograph provides information which is vital to determine the frequencies and severity regarding extreme events.
The major characteristics of flood hydrograph are duration (d), peak (p) and volume (v). Approaches for traditional analysis of hydrological frequency focused individually on each characteristic in a univariate case study. These features were considered jointly in the multivariate case study so that the structure of their dependency could be encountered. Hence, the univariate approaches are not reliable enough to represent the phenomenon and cause reducing the accuracy of risk estimation whereas multivariate approaches contribute in improving the accuracy of risk estimation by considering joint features and dependency structure between characteristics of a flood. However, all the subsequent approaches dealt with characteristics of flood and do not include comprehensive information that can be achieved through hydrograph.
Present work carries an object which contains a framework to represent hydrograph as a functional data curve for frequency analysis. The context of this study considers hydrograph as the observation of infinite dimension such that more efficient and authentic estimates regarding risk related to extreme events are obtained. The aim of this study is to address the problem concerning incomplete data usually encountered in hydrology by exhaustively employing complete information produced by hydrology.
Approaches for analysis of functional data (AFD) are introduced with an intention to concentrate on the visualization of data and detection of outliers using graphical methods in the context of both functional and multivariate study. These methods are illustrated on real-world flood data of Sukkur barrage on the River Indus, in Sindh province, Pakistan.
General Terms
Analysis of functional data (AFD), Frequency analysis of flood (FAF), Functional frequency analysis (FFA), Analysis of multivariate data (AMD).
Keywords
Bivariate Bagplot, Bivariate Boxplot, Functional Bagplot, Functional Boxplot, Functional data, Functional hydrograph, Multivariate data, Rainbow plot.
1.
INTRODUCTION
Extreme events of hydrology such as drought, rainstorm and
flood have significant social and economic impact. Procedures regarding frequency analysis of hydrology are crucial and implemented for analyzing and predicting of such catastrophe, which directly have an effect on management of reservoirs and designing of dams. The precise estimation regarding the associated risk for designing and operating of hydraulic infrastructures needs a complete knowledge of flood. However, overestimation of flood designing tends to oversize construction of reservoirs and hence cost exorbitant amount whereas underestimation of flood tends to cause great damage to designing materials and risk the lives of residents. Frequency analysis of flood (FAF) is ubiquitously employed to execute study regarding such risk. It has been employed in a univariate study for analyzing the peak of flood, [1,2] are referred for further study.
Pakistan is a country located in South Asia has been affected frequently by flood. The longest river of Pakistan is the Indus River, possessing various barrages and dams which have a major contribution in irrigation and electricity generation to the country. Floods observed in years 1928, 1929, 1955, 1957, 1959, 1973, 1976, 1988, 1992, 1995, 1996, 1997 and 2010 are the calamitous. Flood has been defined through the correlation of number of flood characteristics i.e. duration, peak and volume. In the context of univariate, [3] conducted a study for the risk of flood estimation in Pakistan by employing relevant probabilistic distribution to the peak values of flood and obtained the return period associated for numerous barrages and dams on Indus river in Pakistan.
the preceding approaches are used for analyzing flood characteristics rather than using complete content of information through hydrograph. Hence, insufficient data used in hydrology and working with selective number of computed characteristics, produces lack of information as compare to the complete series of available data.
The main source of data in functional frequency analysis (FFA) is daily series of water flow, which causes the formation of hydrograph, through which variables for univariate or multivariate techniques are computed. These variables do not contribute in capturing the shape of hydrograph. The exhaustive information that is produced by hydrograph is crucial to make authentic planning for resources of water and for the hydraulic structures designing. In functional analysis the hydrograph is displayed by curve over a certain time period. Therefore, the content of functional framework encounters the full hydrograph by incorporating all the available data which is authentic for representing the complete phenomena.
The principal objective of present research is to motivate the study of data in functional context which carries benefits for statistical techniques to be applicable in hydrology through the framework of AFD. The selection of suitable model and the estimation for the parameters associated can be negatively affected due to the presence of outliers in data. Therefore, it is essential to detect and treat outliers so that inferences must be based on the correct set of data [12]. Hence, present work constitutes a study based on visualization of data and detection of outliers. The techniques presented are being applied to the recorded observations of flood which is based on daily series of flow for the Sukkur barrage on the Indus River in Sindh province, Pakistan.
This research comprises as follows, the background of theoretical study regarding methods of functional and multivariate statistic in general form is discussed in sections 2. Section 3 contains description of flood data. The methods discussed in sections 2 are applied to the employed data of Sukkur barrage in section 4; this section also contains discussion, comparison and results of functional and multivariate frequency analysis. Section 5 presents the conclusion of research.
2.
METHODOLOGY
This section is representing the methods for visualization of data and detection of outliers in both functional and multivariate context. Data is visualized through the rainbow plot and outliers are detected using functional bagplot and functional highest density region (HDR) boxplot in functional framework whereas multivariate study comprises of computation of flood characteristics, visualization of data and detection of outliers using bivariate bagplot.
2.1
Visualization of Functional Data and
Methods of Outlier Detection
Outliers are the unusual behavior of observations and should be identified and treated, [12]. Univariate outliers are easy to be defined and identified, e.g. [2,13]. Detection of outliers was introduced in multivariate studies by [14]. The detection and treatment of outliers is a crucial phase in analysis of data before modeling. The problem of detecting outlier is also encountered in hydrological analysis which has already gained considerable attention in the framework of univariate setting and an initiative approach was attained by [15] in multivariate study. Outliers also affect the modeling and analysis of hydrological functional data therefore detailed study has been
evolved by [16]. Hence, this section consists of exploring and examining outliers through different methods of detecting outliers in the functional context.
Some literatures presented various methods for detecting outliers in functional study [17-19]. However, [20] worked on real data, the methods that they employed are fast in computation and more reliable for detecting outliers. These methods are graphical and comprise as visualization of functional data by rainbow plots and identification of functional outliers through functional bagplot and highest density region (HDR) functional boxplot. The latter two employed methods help in visually detecting outlier curves which may present within the data range with unusual shape or present outside the data range. The curves having these combined features can also be exhibited by these methods. Practically, different results may possibly be obtained through these two methods of outlier detection which depend on the type of data employed.
2.1.1
Rainbow Plot
[20] introduced the rainbow plot for displaying the data with the additional feature of using color palette according to order of data, which has been implemented by [16] in flood study. This ordering is done through either of two indices that is data density or functional depth. These indices are computed by kernel density and bivariate depths score. The bivariate depth score is written as
(1)
where d(.,.) is the depth half-space function presented by [21]. Depth function of Tukey at is described as number of smallest data points presented in close half space having on boundary. The arrangement of observations is in decreasing order according to ; their values of depth. The curve of first order represents the curve of median, while the curve of last order is the curve considered as outermost among the set of curves. This curve of the median based on the depth function of Tukey for bivariate scores and uses in the modification of floods. Let represents this bivariate Tukey depth median as . If various maximizers are there, then gravity center could be bivariate Tukey depth median. The alternate way for ordering functional data is the estimate of kernel density at the scores of bivariate principal components [22].
(2)
Where K(.) is a function of kernel and be the bandwith of kth bivariate scores point . The functional observation
are then arranged in descending order due to . Hence, the curve of first order having highest OD is the curve of mode, while the curve of last order having lowest OD is the curve lies outside the other curves. The observations after smoothing are displayed with colors depending on OD and OT values. The curves near to center are displayed in red whereas violet color displays the most outlying curve.
2.1.2
Functional Bagplot
An introduction to bagplot in bivariate context on the basis of depth function of half space is presented by [23]. [15] employed this technique in multivariate hydrological study whereas in hydrological functional context it is employed by [16].
scores . Each curve of functional bagplot is related to the point of bivariate bagplot. Correspond to bivariate bagplot there are three elements which contribute in the composition of functional bagplot; median curve of Tukey, the inner and outer functional region. The 50 per cent observations include in inner region, whereas 95 or 99 per cent observations are covered by outer region. The inflation of inner region produces the outer region with the factor of ρ. According to [20], the values of factor ρ should be 1.96 or 2.58 related to 95 or 99 per cent of outer region curves. The considered ρ values are similar with the case, where the distribution of standard normal followed by bivariate scores. Finally, outliers are the points present beyond outer region.
2.1.3
Functional Boxplot
The HDR functional box plot is similar to [24] HDR bivariate boxplot, obtained by first two scores of principal component. The work of [20] is referred to follow for detail study of HDR functional boxplot whereas the study conducted by [16] is recommend to follow for the practical application of HDR functional box plot in hydrology.
The HDR functional boxplot is a composition of mode. As described earlier in preceding section, inner region contains 50 per cent whereas outer region includes 95 or 99 per cent of observations. Curves cross the HDR outer functional region are displayed as outliers.
The difference in detecting outliers by either of two methods namely bagplot and boxplot are mainly depending on the way of establishing inner and outer regions. The depth function and median curve are employed in bagplot while mode and density estimate are employed in boxplot. Hence, outliers are the curves which are unusual compare to mode curve in boxplot whereas outliers displayed in bagplot are unusual compare to median curve.
2.2
Visualization of Multivariate Data and
Method of Outlier Detection
A comparison of functional and multivariate results has been conducted by [16]. A multivariate study based on the work of [15] is aimed to be computed on the present data set following the work of [16].
This section carries some techniques to conduct multivariate study in order to draw comparison between multivariate and functional work. This section composed of two basic phases for representing analysis of multivariate data (AMD). First is a computation of flood characteristics and then visualization of data and detection of outliers using bivariate bagplot.
Data are usually recorded in discrete format, in order to compute flood characteristics so that AMD is conducted; it is required to transform discrete format of data to continuous format through hydrograph. After this transformation, flood characteristics are computed following the work of [9]. These computed characteristics of flood are essential to visualize data and identify suspected outliers using bagplot and corresponding contours.
2.2.1
Flood Characteristics
The fundamental characteristics of flood event are flood duration (d), flood peak (p) and flood volume (v). This study requires only flood peak and volume, therefore focus here is on the computation of peak and volume since they are the most studied and examined flood characteristics e.g., [4,6,9].
The series of bivariate variables (p,v) are computed from discrete observations of flow employing formulas as follows
The series of flow peak is calculated as
(3)
Where is the highest recorded observation of flow on kth day in jth year.
The series of flow volume is calculated as
(4)
Where, are the recorded observations of flow on kth day in jth year, and are the recorded observation of flow on starting and ending day ( respectively, in kth year of flood time span. It is recommended to follow [9] for detailed study.
2.2.2
Visualization of Data and Outlier Detection
Visualization of data is important for conducting any type of analysis. Scatter plot is a simplest tool for visualization in two dimensional (2D) or three dimensional (3D) cases. A generalized form of univariate boxplot is a bagplot in bivariate setting [23] and is correspond to sunburst plot employed by [25]. Depth function of Tukey is the basis of bagplot while the sunburst plots use any of two Tukey or Liu depths. The bagplot composes of dark region present in center encircling 50 percent of deepest points. The Tukey’s median is located in the center of dark region whereas fence is a light region present outside enclosing dark region, is drawn inflating by factor 3. Statistical outliers are the points located outside the fence. The points that are not outlying and present outside the dark region are then linked with the Tukey’s median. These lines are similar to whiskers of univariate boxplots [23]. The bagplot usually provides information relating to sample distribution, such as shape, location and dispersion. Note that, sunburst plot introduced by [25] does not have fence therefore it cannot be employed for detecting outliers. The points located outside the region of fence are identified as extreme and not outliers.
The depth function of Tukey is widely practiced and studied for plots of contour. Depth function contours are used for visualization of data. Contours are helpful for displaying structure and shape of data in multivariate context. These plots help in directly comparing geometry between sets of bivariate data.
3.
DATA DESCRIPTION
The major source of hydrological data is daily stream flow. Flows are also recorded hourly, instantly or on different time scale. The daily flow (cusec) data series that is recorded from year 1977 to 2017 (i.e. n=41 years) for Sukkur barrage are available from Sindh Irrigation Department, Sindh Secretariat, Karachi, Pakistan.
The barrage is built near Sukkur city about 300 miles northeast of Karachi, located in Sindh province on the Indus River, Pakistan. It has a discharge capacity of 900,000 cusecs (i.e. approximately 25500 )
.
Figure 1 indicates the geographical location of the Kotri Barrage.Figure 1: Geographical location of Sukkur Barrage
, , , where
days and is the recorded flow on day of jth year. The subset of time index is the duration [1,183]. This type of data contains n observations in discrete form { , k=1, . . .,183} which is a daily flow of the jth year. These observations comprise as a duration of a year starts from April first to September 30th (i.e. days or 6 months). However, this duration varies and changes according to weather change in a certain area taken as a study of interest. For instance, high flow season of Pakistan is observed in kharif season which comprises of duration April to September.
4.
APPLICATION
The data set employed here having n=41 discrete observations
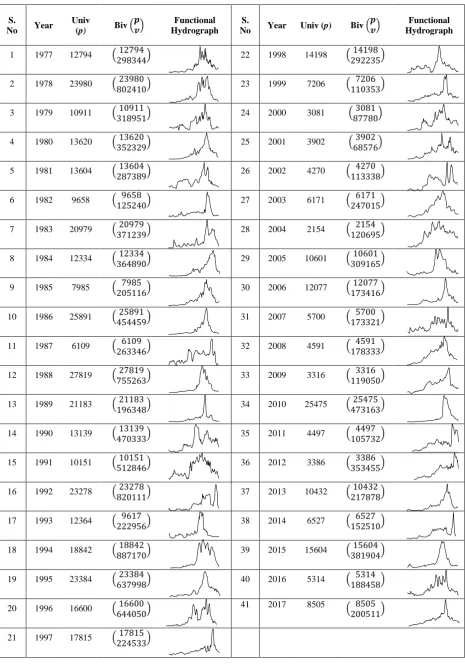
, = [1, 183], j=1,...,n. The jth discrete observation { , k = 1, . . . , 183} represents the measurements of daily flow for the jth year which is converted into cubic meter per second and transformed to functional hydrograph and a series of bivariate variables (p,v) are computed using equations (3) and (4). The functional hydrographs along with corresponding univariate and bivariate observations are displayed in Table 1 to depict the behaviour of flow in three different formats of the framework.
4.1
Functional Results
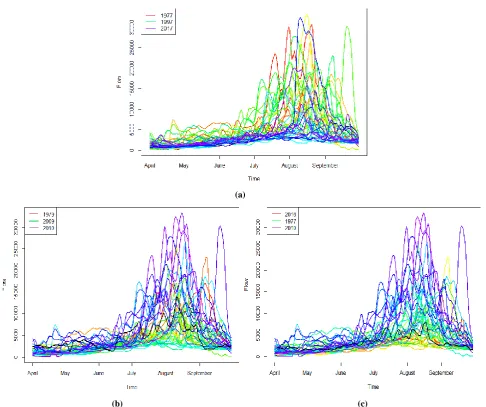
All the graphical methods have some specific format for ordering data in a functional context. All the data in the functional context is graphically displayed through the rainbow plot, with the special feature of having a rainbow color palette with respect to data ordering. By default, functional data displayed by rainbow plot are ordered naturally by the time such that curves color are similar to the color of the rainbow; purple curve displays the flow of most recent year whereas red curve displays the flow of remote past year as depicted by Figure 2(a). The rainbow plots obtained
by ordering indices of bivariate depth and density i.e. equations (1) and (2), are displayed by Figures 2(b) and 2(c), respectively. The curves ordering is indicated by colors in such a way that black is a first curve in center displaying median and mode, respectively, curves in blue are near center whereas curves in red and purple are outliers. Results of ordering show that the two methods of ordering tend to be similar especially high ordering of the associated years. The functional data ordered by depth and density, lead to the development of bivariate and functional bagplot and boxplot, respectively.
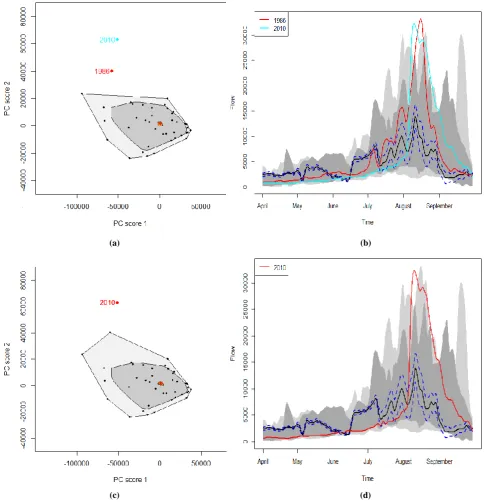
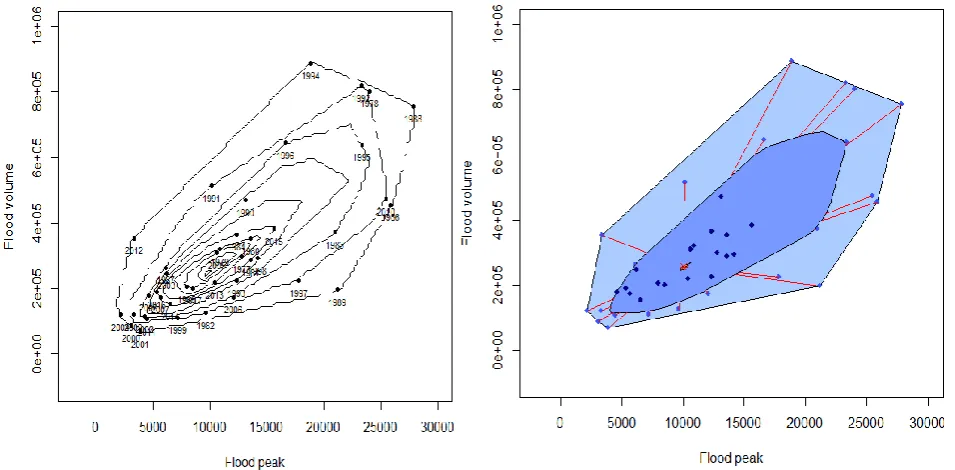
The bivariate and functional bagplot associate to initial two scores of principal components for the probability coverage of 95% and 99% are displayed through Figure 3. Hence it is clear to observe that the curve of year 2010 is located outside the both converging 95% and 99% regions of bivariate bagplot which is also displayed by functional bagplot associated (Figures 3(c) and 3(d)). Therefore, this year is taken into account as outlier according to Tukey’s depth, as mentioned in section 2. Besides this, additional curve of outlier is also observed when the 95% region of bagplot is considered which corresponds to year 1986 as displayed by Figures 3(a) and 3(b). Not that, usually when outliers are present near median, it is difficult to identify them by bagplot, [20]. Although the case is not similar here, it is authentic to use more appropriate approach that is boxplot.
Table 1. Data illustration for three formats: univariate, bivariate and functional.
S.
No Year
Univ
(p) Biv
Functional Hydrograph
S.
No Year Univ (p) Biv
Functional Hydrograph
1 1977 12794
22 1998 14198
2 1978 23980
23 1999 7206
3 1979 10911
24 2000 3081
4 1980 13620
25 2001 3902
5 1981 13604
26 2002 4270
6 1982 9658
27 2003 6171
7 1983 20979
28 2004 2154
8 1984 12334
29 2005 10601
9 1985 7985
30 2006 12077
10 1986 25891
31 2007 5700
11 1987 6109
32 2008 4591
12 1988 27819
33 2009 3316
13 1989 21183
34 2010 25475
14 1990 13139
35 2011 4497
15 1991 10151
36 2012 3386
16 1992 23278
37 2013 10432
17 1993 12364
38 2014 6527
18 1994 18842
39 2015 15604
19 1995 23384
40 2016 5314
20 1996 16600
41 2017 8505
21 1997 17815
Time Flow 5000 10000 15000
April May June July August September
Time
Flow
5000
10000
15000
April May June July August September
Time Flow 0 5000 10000 15000 20000 25000 30000
April May June July August September
Time Flo w 2000 4000 6000 8000 10000
April May June July August September
Time Flow 2000 4000 6000 8000 10000 12000 14000
April May June July August September
Time Flow 1000 2000 3000 4000 5000
April May June July August September
Time Flo w 5000 10000 15000
April May June July August September
Time Flow 1000 2000 3000 4000 5000 6000
April May June July August September
Time Flo w 0 5000 10000 15000
April May June July August September
Time F low 1000 2000 3000 4000 5000 6000
April May June July August September
Time Flow 2000 4000 6000 8000 10000 12000
April May June July August September
Time Flo w 2000 4000 6000 8000
April May June July August September
Time Flow 5000 10000 15000 20000 25000
April May June July August September
Time Flo w 500 1000 1500 2000 2500 3000 3500
April May June July August September
Time Flo w 5000 10000 15000
April May June July August September
Time Flow 2000 4000 6000 8000 10000 12000 14000
April May June July August September
Time Flo w 2000 4000 6000 8000 10000
April May June July August September
Time Flow 0 5000 10000 15000
April May June July August September
Time Flow 0 5000 10000 15000 20000 25000 30000
April May June July August September
Time Flow 2000 3000 4000 5000 6000 7000 8000
April May June July August September
Time Flow 2000 4000 6000 8000
April May June July August September
Time Flow 1000 2000 3000 4000 5000 6000 7000
April May June July August September
Time Flow 0 5000 10000 15000 20000 25000 30000
April May June July August September
Time Flow 1000 2000 3000 4000 5000
April May June July August September
Time Flow 0 5000 10000 15000 20000 25000
April May June July August September
Time Flow 0 5000 10000 15000 20000 25000 30000
April May June July August September
Time Flo w 5000 10000 15000
April May June July August September
Time Flo w 1000 2000 3000 4000 5000 6000 7000
April May June July August September
Time Flow 2000 4000 6000 8000 10000 12000 14000
April May June July August September
Time Flow 1000 2000 3000 4000 5000 6000
April May June July August September
Time Flo w 5000 10000 15000 20000 25000 30000
April May June July August September
Time Flow 2000 4000 6000 8000 10000 12000 14000
April May June July August September
Time
Flow
5000
10000
15000
April May June July August September
Time Flo w 2000 4000 6000 8000
April May June July August September
Time Flow 0 5000 10000 15000 20000
April May June July August September
Time Flow 5000 10000 15000 20000
April May June July August September
Time Flo w 0 5000 10000 15000 20000 25000
April May June July August September
Time Flo w 2000 3000 4000 5000 6000 7000 8000
April May June July August September
Time Flow 5000 10000 15000 20000
April May June July August September
Time Flo w 2000 4000 6000 8000 10000
April May June July August September
Time Flo w 0 5000 10000 15000 20000
(a)
[image:6.595.57.544.66.473.2](b) (c)
Figure 2: Rainbow plots with (a) time (b) depth and (c) density ordering for years 1977-2017
the curve of year 2010 doesn’t. Therefore, the boxplot is more reliable approach compare to bagplot.
Although year 2010 found to be authentic outlier, other suspected years 1978 and 1986 cannot be ignored for examining. It can objectively be deduced from Figures 3 and 4 that the year 2010 based on extreme peak, therefore, the abrupt change in flow behaviour was caused due to the apex of water. The flows of the years 1978 and 1986 also have high peaks but slightly lower than the flow corresponding to the year 2010.
The outliers can further be elaborated according to the meteorological conditions. Flood of the years 1978, 1986 and 2010 are considered as the most important events, the infrequent water flow reveals freak weather conditions. The drastic rise of water level during the span of Kharif season and subsides at the end of the said duration indicates that the winter was frigid, substantial snow was stored during winter which had a contribution in elevating water level of the barrage during searing summer followed by torrential rain in Kharif season.
(a) (b)
(c) (d)
Figure 3: (a) The bivariate and (b) functional bagplot with 95%, whereas
(c) the bivariate and (d) functional bagplot with 99% of probability coverage.
research. Hence, the conclusion is drawn considering the above elucidated facts that the years detected as outliers are not the cause of wrong measurements, it is due to the change of circumstances or climate over time. Therefore, it is recommended to keep these outlier values so that it can be employed for further analysis. The sensitivity of computed outliers can be avoided using robust statistical methods.
4.2
Multivariate Results
The purpose of introducing a multivariate study is to conduct a comparison between results obtained from the functional and multivariate study. The two most studied and examined characteristics of the flood that is peak (p) and volume (v) are
focused here. The series of bivariate (p,v) are computed by the methods discussed in section 3.1 using equations (3) and (4) and results are displayed in Table 1.
[image:7.595.57.542.71.574.2](a) (b)
(c) (d)
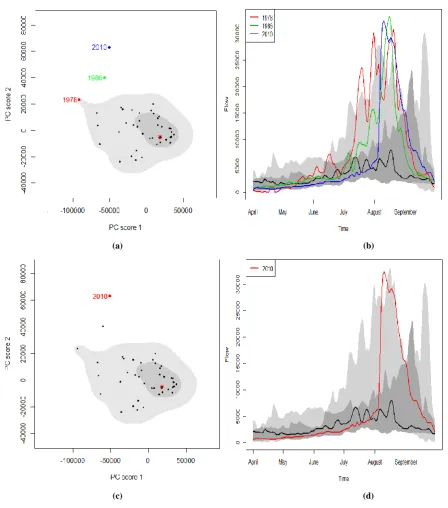
Figure 4. (a) The bivariate and (b) functional boxplot with 95%, while
(c) the bivariate and (d) functional boxplot with 99% of probability coverage
present outside the central region and is produced by inflation of central region using a factor ρ=3 which do not correspond to the factors used in functional bagplot that is 1.96 and 2.58.
The positive dependence and correlation between (p,v) is observed from the orientation of Figures 5(a) and 5(b). It can also be observed that the majority of data values are located at the bottom of the plots while the extreme data values are located at the fence of (p,v) bagplot and on the outermost region of (p,v) contour plot whereas no outlier is displayed. It can be observed that the bagplot shape of bivariate (p,v) is different from functional bagplot and boxplot which is composed of scores . The first two functional
principal component scores do not extract the similar information through hydrograph as bagplot of bivariate (p,v).
5.
CONCLUSION
[image:8.595.54.503.64.573.2]Figure 5: (a) Bagplot and (b) Contour plot using Tukey depth
The potential of using AFD techniques in the study of hydrology is demonstrated using the natural flow series of Sukkur barrage on Indus River in Sindh province, Pakistan. Sukkur Barrage data is visualized and outliers are identified graphically. A study of bivariate flood characteristics (p,v) is conducted for the purpose of comparison which includes graphical method of visualizing data and detecting outliers.. Even though AFD is an extended version of multivariate frequency analysis, both approaches are recommended to be performed so that comprehensive interpretation could be obtained for making appropriate decision.
The initial two functional principal components and bivariate (p,v) do not get information in a same manner through hydrograph. The multivariate approaches do not accumulate the exhaustive information produced by the hydrograph whereas, the functional case study garners comprehensive information presented by flood hydrograph therefore produce authentic results. Nevertheless, both the approaches are useful for understanding flood dynamics and can be employed for the complementary study. These outputs should be used for thorough study in any future research considering several case studies.
The curves of outliers in functional context have different shapes and magnitude compared to other observed curves. In univariate or multivariate context, the shape cannot be observed and captured even after using various variables. The results of functional case study are not coherent with multivariate study and give detailed insight to phenomena of hydrology.
6.
ACKNOWLEDGMENTS
The authors would like to express their gratitude to Sindh Irrigation Department, Sindh Secretariat, Karachi, Pakistan to graciously cater for data of Kotri Barrage to conduct this study. The authors also thank the authors of Aplpack R, Ddalpha R and Rainbow R packages.
7.
REFERENCES
[1] Cunnane, C. (1987). Review of statistical models for flood frequency estimation. In Hydrologic Frequency Modeling (pp. 49-95). Dordrecht, Netherlands: D. Reidel.
[2] Rao, A. R., & Hamed, K. H. (2000). Flood Frequency Analysis. Boca Raton, Florida, United States: CRC Press. [3] Khan, B., Iqbal, M. J., & Yousufzai, M. A. (2011). Flood risk assessment of River Indus of Pakistan. Arabian Journal of Geosciences, 4, 115-122. doi:10.1007/s12517-009-0110-9
[4] Yue, S., Ouarda, T. B., Bobée, B., Legendre, P., & Bruneau, P. (1999). The Gumbel mixed model for flood frequency analysis. Journal of Hydrology, 228, 88-100. doi:10.1016/S0022-1694(99)00168-7
[5] Yue, S., Ouarda, T. B., Bobée, B., Legendre, P., & Bruneau, P. (2002). Approach for describing statistical properties of flood hydrograph. Journal of Hydrologic Engineering, 7(2). doi: 10.1061/(ASCE)1084-0699(2002)7:2(147)
[6] Shiau, J. T. (2003). Return period of bivariate distributed extreme hydrological events. Stochastic Environmental Research and Risk Assessment, 17, 42–57. doi:10.1007/s00477-003-0125-9
[7] Zhang, L., & Singh, V. P. (2006). Bivariate flood frequency analysis using the copula method. Journal of
Hydrologic Engineering, 11(2).
doi:10.1061/(ASCE)1084-0699(2006)11:2(150)
[8] Chebana, F., & Ouarda, T. B. (2011a). Multivariate quantiles in hydrological frequency analysis. Environmetrics, 22, 63-78. doi:10.1002/env.1027 [9] Naz, S., Iqbal, M. J., Akhter, S. M., & Hussain, I. (2016).
The Gumbel mixed model for food frequency analysis of Tarbela. The Nucleus, 53(3), 171-179.
[10] Zhang, L., & Singh, V. P. (2007). Trivariate flood frequency analysis using the Gumbel-Hougaard copula. Journal of Hydrologic Engineering, 12(4). doi:10.1061/(ASCE)1084-0699(2007)12:4(431)
[image:9.595.57.535.74.309.2]doi:10.1061/(ASCE)1084-0699(2007)12:4(420)
[12]Barnett, V., & Lewis, T. (1998). Outliers in Statistical Data (3rd ed.). Chichester, U.K: John Wiley.
[13]Hosking, J. R., & Wallis, J. R. (1997). Regional Frequency Analysis: An Approach Based on L-Moments. Cambridge, U.K: Cambridge University Press. doi:10.1017/CBO9780511529443
[14]Dang, X., & Serfling, R. (2010). Nonparametric depth-based multivariate outlier identifiers, and masking robustness properties. Journal of Statistical Planning and
Inference, 140(1), 198-213.
doi:10.1016/j.jspi.2009.07.004
[15]Chebana, F., & Ouarda, T. B. (2011b). Depth-based multivariate descriptive statistics with hydrological applications. Journal of Geophysical Research, 116, D10120. doi:10.1029/2010JD015338
[16]Chebana, F., Dabo-Niang, S., & Ouarda, T. B. (2012). Exploratory functional flood frequency analysis and outlier detection. Water Resources Research, 48(4), W04514. doi:10.1029/2011WR011040
[17]Hardin, J., & Rocke, M. D. (2005). The distribution of robust distances. Journal of Computational and
Graphical Statistics, 14(4). doi:
10.1198/106186005X77685
[18]Febrero-Bande, M., Galeano, P., & Gonzãlez-Manteiga, W. (2007). A functional analysis of NOx levels: Location
and scale estimation and outlier detection. Computational Statistics, 22(3), 411-427. doi:10.1007/s00180-007-0048-x
[19]Filzmoser, P., Maronna, R., & Werner, M. (2008). Outlier identification in high dimension. Computational Statistics & Data Analysis, 52(3), 1694-1711. doi:10.1016/j.csda.2007.05.018
[20]Hyndman, R. J., & Shang, H. L. (2010). Rainbow plots, bagplots and boxplots for functional data. Journal of Computational and Graphical Statistics, 19(1), 29-45. doi:10.2307/25651298
[21]Tukey, J. W. (1975). Mathematics and the picturing of data. Proceedings of the 1975 International Congress of Mathematics, 2, pp. 523–531.
[22]Scott, D. W. (1992). Multivariate density estimation: theory, practice, and visualization. New York: Wiley.
[23]Rousseeuw, P., Ruts, I., & Tukey, J. W. (1999). The bagplot: A bivariate boxplot. The American Statistician, 53, 382-387. doi:10.1080/00031305.1999.10474494 [24]Hyndman, R. J. (1996). Computing and graphing highest
density regions. The American Statistician, 50(2), 120-126. doi:10.2307/2684423