Twitter Texts’ Quality Classification using Data Mining
and Neural Networks
Ftoon Kedwan
School of Computing Queen’s University Goodwin Hall, Kingston
Ontario, Canada
Chanderdhar Sharma
School of Computing Queen’s University Goodwin Hall, Kingston
Ontario, Canada
ABSTRACT
Purpose: This is an attempt to classify the level of noise in twitter texts which is part of social media data analytics problem. Estimations in recent machine learning & data feeding algorithms researches’ assumptions consider high data quality in social media texts, while they actually lack data accuracy, completeness, and overall quality which leads to the principle of “Garbage In Garbage Out” resulting in bizarre statistical findings. The aim of this project is to predict and classify Twitter data noise levels using a labelled dataset. Methodology: After data cleaning, a clustering technique was used to find the major dimensions in the data imported, and a dimension reduction algorithm was ran using PCA Weighting and the Wight Guided Feature Selection algorithms. They resulted into 6 most significant features which were used in the implementation. An artificial neural network model was trained to predict the Tweets’ quality classes using R and RStudio. The ANN used is Neural Network (NN) and Naïve Bayes (NB) for the purpose of predicting the Twitter text quality. There will be a comparison between the 2 ANN used in terms of accuracy and precision.
Findings: Three different aspects of text mining were discovered in twitter data. (1) Neural network gives surprisingly good result as compared to Naive Bayes algorithm, (2) With only 3 hidden layers, a network was created which can predict good or bad class, (3) Preprocessing of the data and implementing predictive algorithms take huge data and very high computational complexity and time. Research results show that Neural Network performs well even without Dropout layer and convolutional layers. The accuracy of the Neural Network is 99%.
General Terms
Data Mining, Text Quality, Data Classification, Classification Algorithms, Neural Networks, Twitter Text
Keywords
Data Mining, Twitter Text Quality, Twitter Data Classification, Classification Algorithms, Neural Network Algorithm, Text Analysis.
1.
INTRODUCTION
The Social media data tend to be full of noise due to the nature of random texting and casual posting throughout the user’s timeline, not mentioning the use of emoji, abbreviations, grammatical/spelling mistakes, duplications, different or mixed languages, etc. This noise in Twitter data prohibits researchers and experimentalists from achieving reliable conclusions that would help in understanding user behavior’s analysis or other relevant purposes. The project of interest here is classifying the level of noise in twitter texts which is part of social media data analytics problem.
Estimations in recent machine learning & data feeding algorithms researches’ assumptions consider high data quality in social media texts [1], while they actually lack data accuracy, completeness, and overall quality resulting in bizarre statistical findings. In general, social media data tend to be full of noise [2] due to the nature of random texting and casual posting throughout the user’s timeline, not mentioning the use of emoji, abbreviations, grammatical/spelling mistakes, duplications, different or mixed languages, etc. This noise in Twitter data prohibits researchers and experimentalists from achieving reliable conclusions that would help in understanding user behavior’s analysis or other relevant purposes.
An artificial neural network model will be trained to predict the Tweets’ quality classes. R will be used because it has many text processing libraries and simple GUI (RStudio). The ANN used is Neural Network (NN) and Naïve Bayes (NB) for the purpose of predicting the Twitter text quality. The aim is to eventually compare between the 2 ANN used here in terms of accuracy and precision. The labelled dataset includes around 36,000 Tweets. Those tweets are classified as poor quality, or good quality. Redundancy analysis and missing data handling will be done. This data will be divided as 80% training dataset and 20% testing dataset. Initially, there are 16 features, only the most significant features will be used for training the ANN model.
Similar text classification attempts follow slightly different approaches such as using two different first-order probabilistic models to obtain naive Bayes assumptions whether by using a multi-variate Bernoulli model which is a Bayesian Network without dependencies between the texts and their features. Other approaches include the use of multinomial model which is a uni-gram language model. However, people often confuse between those 2 approaches, so McCallum and Nigam aim to explain this confusion by exploring the variances and details of both models. For results verification, classification performance will be compared using five text corpora [3]. Their experiment resulted in that multi-variate Bernoulli is most suited for small vocabulary sizes. In contrast, multinomial is best suited for larger vocabulary sizes. On average, multinomial gives a 27% less error over the multi-variate Bernoulli model for any size of vocabulary [3].
than the regular inductive methods of SVM. Nevertheless, one drawback is that this approach is mostly suited for small training sets. This experiment resulted in that the number of labelled training words were cut down to a twentieth on some of the tasks [4].
Since most unlabeled documents are available in the internet, and since obtaining labeled data (training data) is expensive and out of reach generally, Nigam and McCallum used augmentation approaches for a small number of labeled training documents together with a large accumulation of unlabeled documents to improve the accuracy of classification. To do that, the author implemented Expectation-Maximization (EM) and a Naive Bayes classifier models [5]. At the beginning of the algorithm training, the model takes in the small number of labeled documents. Then, they label the unlabeled documents with certain probabilities with multiple iterations until convergence. To have improved classification accuracy results, authors used a weighting factor resembling the unlabeled data contribution, in addition to multiple mixture components used per class which proved if used together they reduce texts classification errors by roughly 30% among the unlabeled data [5].
Baker and McCallum are introducing a new method of enhancing documents classification by using Distributional clustering. They used the class labels distribution for each word to cluster words to compress the feature space more efficiently and effectively and scoring high document classification accuracy in the same time. Their experiment resulted in that feature dimensionality could be reduced by three orders of magnitude, but with a big loss of accuracy which is considered a better performance than “Latent Semantic Indexing (class-based) clustering feature selection by mutual information or Markov blanket-based feature selection” [6]. In addition, less effective clustering approaches could improve classification accuracy.
Social media in general exhibits a rich variety of information sources. The results obtained when analyzing texts taken from social media portals cannot be compared which makes it impossible to relate text types and categories to each other. Furthermore, determining the features or the characteristics of the scope of validity for a group of texts is almost impossible. In that regard, Göpferich introduced a tactic towards a pragmatic text typology which can serve as a framework to analyze different text types demonstrated through implications of this typology for translation studies and translation didactics [7].
Available data in social networks, on-line chats, or blogs are considered sources of information. The perception of quality and credibility of information sources are essential to be able to discard low quality and uninteresting content. Low-quality contents usually feature informal characteristics such as emoticons, typos, slang or loss of formatting [8]. The task of identifying high-quality social media textual sites based on user contributions is becoming increasingly important especially with the increase and the availability of such content. Agichtein et al. explored methods for manipulating community feedback for automatic classification of high-quality contents focusing on Yahoo! platform through its diverse, rich, and large interactive community question/answering portal. They introduced a general classification framework for joining the indications and the signals from different information sources. They proved that their system is able to separate excellent high-quality items from the low-quality (abuse, spam) with a human-like level of accuracy [9]. Four years later, Mosquera and Moreda
proposed a novel unsupervised real-time system called SMILE. SMILE helps in assessing user-generated content quality and credibility using informality levels through experimenting on Yahoo! Answers as well. Results show that informality analysis are effective criteria to assess the credibility and quality of Web 2.0 information sources such as Yahoo! Answers [8].
Sokolova and Lapalme introduced 24 performance measures employed in a systematic analysis approach used in Machine Learning classification tasks (i.e., binary, multi-labelled, or hierarchical) where each classification task produces a set of data characteristics’ changes in a confusion matrix that later on moves to a lower level and investigates the types of those changes in another confusion matrix. The resulting confusion matrices remain unchanged allowing for the maintenance of a classifier’s measures evaluation. The final outcome is the “measure invariance taxonomy” resulted from all class distribution variations in the relevant classification problem [9], [10].
2.
LITERATURE REVIEW
Social media in general exhibits a rich variety of information sources. The results obtained when analyzing texts taken from social media portals cannot be compared which makes it impossible to relate text types and categories to each other. Furthermore, determining the features or the characteristics of the scope of validity for a group of texts is almost impossible. In that regard, Göpferich introduced a tactic towards a pragmatic text typology which can serve as a framework to analyze different text types demonstrated through implications of this typology for translation studies and translation didactics [11], [12], [13].
Available data in social networks, on-line chats, or blogs are considered sources of information. The perception of quality and credibility of information sources are essential to be able to discard low quality and uninteresting content. Low-quality contents usually feature informal characteristics such as emoticons, typos, slang or loss of formatting [14]. The task of identifying high-quality social media textual sites based on user contributions is becoming increasingly important especially with the increase and the availability of such content. Agichtein et al. explored methods for manipulating community feedback for automatic classification of high-quality contents focusing on Yahoo! platform through its diverse, rich, and large interactive community question/answering portal.
They introduced a general classification framework for joining the indications and the signals from different information sources. They proved that their system is able to separate excellent high-quality items from the low-quality (abuse, spam) with a human-like level of accuracy [15]. Four years later, Mosquera and Moreda proposed a novel unsupervised real-time system called SMILE. SMILE helps in assessing user-generated content quality and credibility using informality levels through experimenting on Yahoo! Answers as well. Results show that informality analysis are effective criteria to assess the credibility and quality of Web 2.0 information sources such as Yahoo! Answers [14].
matrices remain unchanged allowing for the maintenance of a classifier’s measures evaluation. The final outcome is the “measure invariance taxonomy” resulted from all class distribution variations in the relevant classification problem [16].
However, this swift growth in web content has led to a less standardized language creating related problems like the inability to apply Natural Language Processing tasks “such as Machine Translation, Information Retrieval and Opinion Mining” due to an unsuitable noisy social media texts. Another embedded problem is the inability of English as a Second Language (ESL) people to understand those contaminated texts, and hence no interaction occurs from their side leading to potentially valid information/opinion loss. Therefore, automatically normalizing social media English language is being discussed by researches as an attempt to create various applications for its use.
Clark and Araki tried to solve this issue problem by evaluating the performance of spell checkers applications on data taken from Twitter and measure the extent of accuracy improvement by pre-processing the data with their developed system. They also used specialized database rules and classification system which lead to promising results [17]. As a matter of fact, online social media texts are growing and expanding rapidly everyday with the large amount of user-generated data produced by various social media services. Producers and consumers of information are facing new chances and challenges analyzing those texts for various purposes [18]. For that, artificial neural networks provide excellent text analytics tools which is an effective way to meet users’ diverse information needs
Moreover, numerous discussions have been made about social media text quality and how noisy its statistical outcomes are. Researchers are now becoming more and more interested in finding the percentage of noise in the social media (web user forum posts, blog posts, Wikipedia, Twitter posts, YouTube comments, etc.) texts linguistics. Texts from those sources have been compared with reference corpuses of edited English text by extracting out descriptive statistics such as “the distribution of languages, average sentence length and proportion of out-of-vocabulary words”. After that, they used a linguistically-motivated parser to analyze proportions of grammatical sentences in each descriptive statistic [19]. Social media tools (e.g. Facebook, Twitter) have always attracted businesses and companies whether to provide services or to interact with customers in addition to increasing competitive advantages and effectively assessing the competitive environment of their businesses. Therefore, companies need to screen and analyze customer-generated content on both their own social media sites, and on their competitors’ social media sites as well. In order to achieve a social media competitive analysis tasks, and to convert social media data into knowledge whether to be used by e-marketers or other decision makers, He and Li applied text mining to analyze unstructured text content on Facebook and Twitter sites as an effective technique to extract business values from the vast amount of available social media data [20], [21].
While there is an endless list of purposes why data scientists would want to analyze social media texts’ quality, this study aims for analyzing and classifying Twitter’s text quality for the purpose of research statistical studies validity.
Twelve feature selection methods have been effectively compared and evaluated on terms of their Information Gain against a benchmark of 229 text classification problem instances. For the evaluation process, the authors used accuracy, F-measure, precision, and recall measures. The study showed that 'Bi-Normal Separation' (BNS) performed better than all other methods by far. However, it didn’t perform as well in high class skew that is considered extensive among the text classification problems [22]. Instead of feeding a random labelled training set into a Support Vector Machine (SVM), this paper introduces a new algorithm that undergoes active learning with SVM that can actually choose the future selected instances where the learner has access to a set of unlabeled datasets and can ask for labels for some of those selected datasets [23]. Experiment results show that this active learning method can reduce the urgency of having labeled training datasets whether it is a standard inductive or transductive settings [23].
This paper uses a small domain-specific features’ quantity taken from the Twitter users’ profiles and text messages instead of the huge amount of noisy and random raw data extracted from Twitter feeds. The purpose of obtaining this data is to classify those short text messages for potential interesting statistics. This approach proved to be effective in classifying those small text messages into predefined categories set by the author (e.g. News, Events, Opinions, Deals) [24].
However, this swift growth in web content has led to a less standardized language creating related problems like the inability to apply Natural Language Processing tasks “such as Machine Translation, Information Retrieval and Opinion Mining” due to an unsuitable noisy social media texts. Another embedded problem is the inability of English as a Second Language (ESL) people to understand those contaminated texts, and hence no interaction occurs from their side leading to potentially valid information/opinion loss. Therefore, automatically normalizing social media English language is being discussed by researches as an attempt to create various applications for its use. Clark and Araki tried to solve this issue problem by evaluating the performance of spell checkers applications on data taken from Twitter and measure the extent of accuracy improvement by pre-processing the data with their developed system. They also used specialized database rules and classification system which lead to promising results [25].
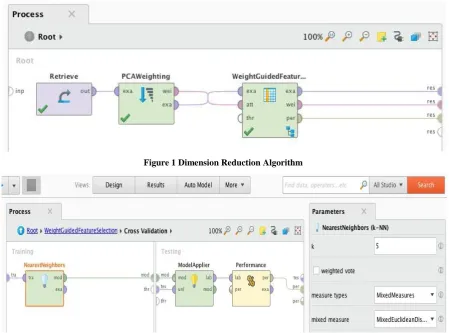
Figure 1 Dimension Reduction Algorithm
Figure 2 Dimension Reduction by K-NearestNeighbor, K=5
Moreover, numerous discussions have been made about social media text quality and how noisy its statistical outcomes are. Researchers are now becoming more and more interested in finding the percentage of noise in the social media (web user forum posts, blog posts, Wikipedia, Twitter posts, YouTube comments, etc.) texts linguistics. Texts from those sources have been compared with reference corpuses of edited English text by extracting out descriptive statistics such as “the distribution of languages, average sentence length and proportion of out-of-vocabulary words”. After that, they used a linguistically-motivated parser to analyze proportions of grammatical sentences in each descriptive statistic [26]. Social media tools (e.g. Facebook, Twitter) have always attracted businesses and companies whether to provide services or to interact with customers in addition to increasing competitive advantages and effectively assessing the competitive environment of their businesses. Therefore, companies need to screen and analyze customer-generated content on both their own social media sites, and on their competitors’ social media sites as well. In order to achieve a social media competitive analysis tasks, and to convert social media data into knowledge whether to be used by e-marketers or other decision makers, He and Li applied text mining to analyze unstructured text content on Facebook and Twitter sites as an effective technique to extract business values from the vast amount of available social media data [27], [28]. While there are endless lists of purposes why data scientists would want to analyze social media texts’ quality, this study aims for analyzing and classifying Twitter’s text quality for the purpose of research statistical studies validity.
3.
METHODOLOGY
3.1
Data to Be Used
The labelled dataset (attached with this proposal) includes around 36,000 Tweets. Those tweets are classified as poor quality, or good quality. Redundancy analysis and missing data handling will be done. This data will be divided as 80% training dataset and 20% testing dataset. Initially, there are 16 features, only the most significant features will be used for training the ANN model.
After cleaning the data by checking for redundancy and missing data, a clustering technique was ran to figure out how many major dimensions are there in the data, and then ran a dimension reduction algorithm by weight called Principal Component Analysis (PCA) Weighting. This algorithm together with the Wight Guided Feature Selection algorithm resulted into 6 most significant features which were used in the implementation.
3.2
Implementation Plan and Technique to
be Explored
An artificial neural network model will be trained to predict the Tweets’ quality classes. R programming language will be used because it has many text processing libraries and simple GUI (RStudio). Python might be use in the final stage as it is more efficient in terms of memory.
3.2.1
Steps Taken to Run the Neural Network
Model
3.2.1.1
Loading data and libraries into the
RStudio platform.
After normalizing the data by taking their z-score, the data is entered into the NN and choose the desired libraries to be used using the below code lines:
// Loading libraries library(neuralnet) library(nnet) library(ggplot2) set.seed(10)
// Read the data
data=read.csv("C:\\bigdata\\text-mining\\data\\text_quality.csv", header=T)
3.2.1.2
Data preprocessing, study and analysis
The target class name will be converted from reg and cont to [1,0] for the sake of data type standardization. The data will also be normalized for the rest of the numeric columns to be in the range from 0 to 1.
class = as.numeric(data$class)-1
keeps = c("no_chars", "no_words", "no_unique_words", "word_difference", "number_hashtags", "number_mentions", "number_urls")
data = data[keeps]
// Creating a vector of columns with values either Max or Min
maxs <- apply(data, 2, max) mins <- apply(data, 2, min)
// The function scale() will be used to convert the matrix
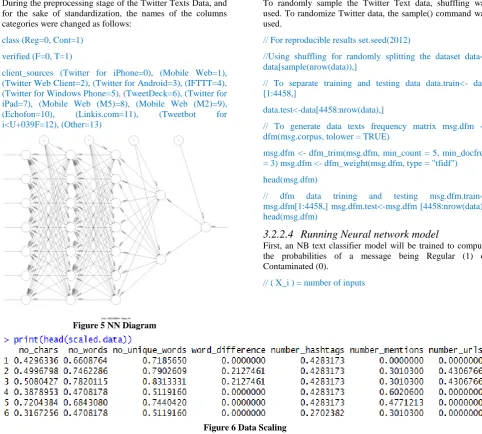
resulted to a frame of data scaled.data <-
as.data.frame(scale(data,center = mins, scale = maxs - mins)) print(head(scaled.data))
// Check out results print(head(scaled.data,2)) class1 = as.data.frame(class)
data1 = cbind(class1,scaled.data)
3.2.1.3
Splitting data into Train and Test sets
Data has to be split into 2 sets, a training set to train the NN model with, and a test set to test and evaluate the efficiency and accuracy of the model results.
// caTools function randomly splits the data into training and testing sets. library(caTools)
set.seed(101)
split = sample.split(data1$class, SplitRatio = 0.70) train = subset(data1, split == TRUE)
test = subset(data1, split == FALSE) samplesize = 0.10 * nrow(data1) set.seed(80)
index = sample(seq_len(nrow(data1)), size = samplesize)
// Create training and test set d_train = data1[index, ] d_test = data1[-index, ]
3.2.1.4
Running Neural network model
When running the NN model, user is actually dealing with a machine learning tool by introducing neuralnetwork() to it.
feats <- names(data)
// Concatenate strings
f <- paste(feats,collapse=' + ') f <- paste('class ~',f)
// Convert to formula f <- as.formula(f)
// running NN model.install.packages ('neuralnet')
library(neuralnet)
nn<-neuralnet(f,d_train,hidden=c(7,7,2),linear output=FALSE)
3.2.1.5
Predictions analysis
compute() function allows testing the built model by evaluating how accurate the predictions are.
predicted.nn.values <- compute(nn,d_test[2:8])
3.2.1.6
Evaluations analysis
The NN model will be evaluated through the analysis of its confusion matrix obtained through the following code line:
predicted.nn.values$net.result<-
sapply(predicted.nn.values$net.result,round,digits=0)Check out net.result
table(d_test$class,predicted.nn.values$net.result)
// Accuracy calculation print (head
(predicted.nn.values$net.result)) print (Accuracy*100)
3.2.1.7
Visualizing the built Neural network
plot(nn) command will be used to visualize the built up NN model results. plot(nn)
After running the NN model, couple of important results came up and documented through the below screenshot figures: Figure 3 & 4 is the NN Prediction where 0 = High Text Quality and -1= Low Text Quality.
Figure 3 NN Prediction Results Confusion Matrix
Figure 4 NN Prediction Results Values
3.2.2
Steps Taken to Run the Naïve Bayes Model
3.2.2.1
Loading Data and Libraries into the
Rstudio Platform.
Implementing Naïve Bayes in R will be done using a package called “quanteda” which is a natural language processing package used for processing text data.
require(quanteda)
?quanteda require(RColorBrewer) require(ggplot2)
// Loading the dataset Data=
read.csv("../Datasets/Data.csv",header=TRUE,sep=",",quote=' \"\"', stringsAsFactors=FALSE)
table(Data$v1) 0 1
3.2.2.2
Data preprocessing, study and analysis
During the preprocessing stage of the Twitter Texts Data, and for the sake of standardization, the names of the columns categories were changed as follows:
class (Reg=0, Cont=1)
verified (F=0, T=1)
client_sources (Twitter for iPhone=0), (Mobile Web=1), (Twitter Web Client=2), (Twitter for Android=3), (IFTTT=4), (Twitter for Windows Phone=5), (TweetDeck=6), (Twitter for iPad=7), (Mobile Web (M5)=8), (Mobile Web (M2)=9),
(Echofon=10), (Linkis.com=11), (Tweetbot for
[image:6.595.52.535.87.521.2]i<U+039F=12), (Other=13)
Figure 5 NN Diagram
3.2.2.3
Splitting data into Train and Test sets
To randomly sample the Twitter Text data, shuffling was used. To randomize Twitter data, the sample() command was used.
// For reproducible results set.seed(2012)
//Using shuffling for randomly splitting the dataset data<-data[sample(nrow(data)),]
// To separate training and testing data data.train<- data [1:4458,]
data.test<-data[4458:nrow(data),]
// To generate data texts frequency matrix msg.dfm <- dfm(msg.corpus, tolower = TRUE)
msg.dfm <- dfm_trim(msg.dfm, min_count = 5, min_docfreq = 3) msg.dfm <- dfm_weight(msg.dfm, type = "tfidf")
head(msg.dfm)
// dfm data trining and testing msg.dfm.train<-msg.dfm[1:4458,] msg.dfm.test<-msg.dfm [4458:nrow(data),] head(msg.dfm)
3.2.2.4
Running Neural network model
First, an NB text classifier model will be trained to compute the probabilities of a message being Regular (1) or Contaminated (0).
// ( X_i ) = number of inputs
Figure 6 Data Scaling
// (Y) = categorical response variable
// (K_j ) = number of class labels
$$C(X)=P(Y=K_j|X_i)=P(X_1|Y).P(X_2|Y)…P(X_i|Y)P(Y= K_j)$$
3.2.2.5
Predictions analysis
After training the NB model, the model will present the Probabilities of the Twitter texts as being Regular (1) or Contaminated (0).
// To train the NB classifier and produce predictions nb.classifier<-textmodel_NB(msg.dfm.train,data.train[,1]) nb.classifier
textmodel_NB.dfm(x = msg.dfm.train, y = data.train[, 1])
3.2.2.6
Evaluations analysis
To evaluate the NB model, the model will have to be tested first using the test dataset. This process will result in the accuracy measures used to decide whether this is a successful model to classify the Twitter texts data or not.
// To test NB Model
pred<-predict(nb.classifier,msg.dfm.test)
// To generate the confusion matrix using pred$nb.predicted to
obtain class labels table(predicted=
pred$nb.predicted,actual=spam.test[,1])
// To calculate the classifier model’s accuracy on a random
and unseen test data mean
(pred$nb.predicted==spam.test[,1])*100
3.2.2.7
Visualizing the built Neural network
quanteda’s corpus() command was used in order to visualize the dataset by building a corpus from the raw data.
?corpus
msg.corpus<-corpus(data$message)
// class labels are fed to the corpus message text using the docvars() command docvars(msg.corpus)<-data$type
// Plotting the word-cloud by generating a document feature
matrix data.plot <- corpus_subset (msg.corpus,
docvar1=="data")
data.plot<-dfm(data.plot, tolower = TRUE, remove_punct = TRUE, remove_twitter = TRUE, remove_numbers = TRUE, remove=stopwords("SMART"))
data.col <- brewer.pal (10, "BrBG") textplot_wordcloud (data.plot, min.freq = 16, color = data.col) title("data Wordcloud", col.main = "grey14")
After running the NB model and the above 7 steps, couple of important results came up and documented through the screenshot-figures 6 to 11. Figure 6 is the results of DFM for the test set using Naïve Bayes, while Figure 7 is the head of the DFM using the most significant 6 features.
Figure 7 DFM for Test Set
Figure 8 Corpus of Test Set
Figure 9 DFM Head
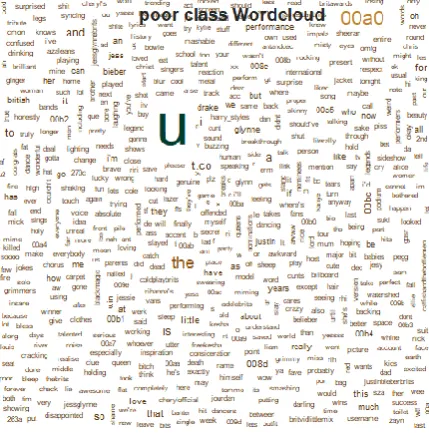
[image:7.595.318.533.73.291.2]Figure 10 is the resulted “good” class word-cloud, while Figure 11 is the resulted “poor” class word cloud. The below-plotted word-clouds are used to know what are the most frequently occurring words that appear in the Twitter dataset.
Figure 10 Good Class Word Cloud
Figure 11 Poor Class Word Cloud
4.
EVALUATION AND VALIDATION
PLAN
The Twitter texts quality classifications’ (ANN models) performance will be evaluated using accuracy measures. It will then be validated using streaming data fed into the model. After applying the Neural Network and the Naïve Bayes, the below confusion matrices resulted:
NN Confusion Matrix: (-1: Poor Class, 0: Good Class)
-1 0
-1 24128 125
0 83 8058
NB Confusion Matrix: (-1: Poor Class, 0: Good Class)
-1 0
-1 19354 4899
0 2675 5466
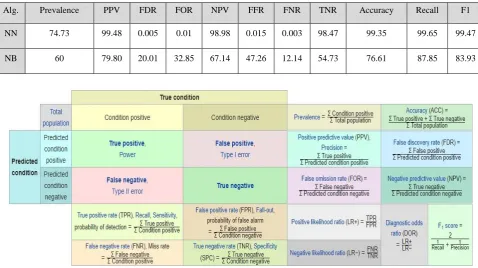
As per Table 1, the overall accuracy is not 100%, this could be due to either of the following:
a) Data is not balanced since there are around 36 thousand records, but only 6 significant features. b) Not enough significant distinguishing features were
reported with the original data.
5.
DISCUSSION AND FUTURE WORK
5.1
Intermediate Form
Complexity with varying degree and intermediate forms are best suits for variable mining purpose. For task like domain specific knowledge discovery, it is important to do the semantic analysis to analyze the relationship between concepts of the documents and the objects of the documents with rich representation. However, the problem that can be faced is the computational complexity.
5.2
Challenge Faced and Future Work
[image:7.595.309.535.77.539.2] [image:7.595.57.280.449.619.2]semantic analysis that can be scalable for very large corpus and efficient enough to do it in less computational time.
5.3
Multilingual Text Refining
The text data used for data analysis was just in English. But the data mining is independent of the language. It involves different languages but not the writing such as Chinese and Japanese. It is important to look for the text refining algorithms which process the different languages documents or database.
Challenges and Future work: The new way of using short forms of the words that means something but to make it relation with the given text corpus is hard. Most of the mining tools are focused on English (that was used) but text mining should be language independent and process all the data that can make language independent intermediate form.
5.4
Domain Knowledge Integration
[image:8.595.57.536.257.525.2]Future work is to cater the domain knowledge which has not yet implemented in text mining tools. This could play an essential role in text mining. In text refining stage, domain knowledge can be used to improve text mining. It will be interesting to see how a domain knowledge can be used to improve the accuracy of the parsing efficiency. The domain information used in the part of knowledge distillation can be seen as well. In a classification or predictive modeling task, domain knowledge helps to improve learning/mining efficiency as well as the quality of the learned model (or mined knowledge) [11], [23]. In the future work, it is essential to investigate how user’s knowledge can be used to make a knowledge structure and produce knowledge discovery more understandable or interpretable.
Table 1 Results Comparison Table
Alg. Prevalence PPV FDR FOR NPV FFR FNR TNR Accuracy Recall F1
NN 74.73 99.48 0.005 0.01 98.98 0.015 0.003 98.47 99.35 99.65 99.47
NB 60 79.80 20.01 32.85 67.14 47.26 12.14 54.73 76.61 87.85 83.93
Figure 1 Conditions Calculation Matrix
5.5
Different Neural Networks
A Neural Network was implemented with 3 hidden layers. The future work of this project will be implementing Genetic algorithm with LSTM and RNN as well as CNN and comparing the results of the new network with the basic neural network and come to the conclusion that why basic neural network perform the best till now and how and when it can will decrease its accuracy.
6.
CONCLUSIONS
In this Project, three different aspects of text mining in twitter data have been discovered:
a) Neural network gives surprisingly good result as compared to Naive Bayes algorithm.
b) With just 3 hidden layer, a network was created which can predict good or bad class.
c) Preprocessing of the data and implementing predictive algorithms takes huge data takes very high computational complexity and time.
Both the algorithm with all the possible comparison in the above table have been compared, and the fact that Neural Network is good even without Dropout layer and convolutional layers have been proved. The accuracy of the Neural Network is 99% and this high accuracy is surprising. The future work suggests what can be improved over this high accuracy and how can the relations between the text corpus and the objects of the documents be shown.
7.
REFERENCES
[1] Wu, Z., & Huang, N. E. (2009). Ensemble empirical mode decomposition: a noise-assisted data analysis method. Advances in adaptive data analysis, 1(01), 1-41. [2] Aggarwal, C. C., & Wang, H. (2011). Text mining in
social networks. In Social network data analytics (pp. 353-378). Springer, Boston, MA.
http://citeseerx.ist.psu.edu/viewdoc/download?doi=10.1. 1.65.9324&rep=rep1&type=pdf
[4] Joachims, T. (1999, June). Transductive inference for text classification using support vector machines.
In ICML (Vol. 99, pp. 200-209).
http://www1.cs.columbia.edu/~dplewis/candidacy/joachi ms99transductive.pdf
[5] Nigam, K., McCallum, A. K., Thrun, S., & Mitchell, T. (2000). Text classification from labeled and unlabeled documents using EM. Machine learning, 39(2-3), 103-134.
https://link.springer.com/article/10.1023/A:10076927130 85
[6] Baker, L. D., & McCallum, A. K. (1998, August). Distributional clustering of words for text classification. In Proceedings of the 21st annual international ACM SIGIR conference on Research and development in information retrieval (pp. 96-103). ACM. https://dl.acm.org/citation.cfm?id=290970
[7] Göpferich, S. (1995). A pragmatic classification of LSP texts in science and technology. Target. International Journal of Translation Studies, 7(2), 305-326.
[8] Mosquera, A., & Moreda, P. (2012, May). Smile: An informality classification tool for helping to assess quality and credibility in web 2.0 texts. In Proceedings of the ICWSM workshop: Real-Time Analysis and Mining of Social Streams (RAMSS).
[9] Agichtein, E., Castillo, C., Donato, D., Gionis, A., & Mishne, G. (2008, February). Finding high-quality content in social media. In Proceedings of the 2008 international conference on web search and data mining (pp. 183-194). ACM.
[10]Sokolova, M., & Lapalme, G. (2009). A systematic analysis of performance measures for classification tasks. Information Processing & Management, 45(4), 427-437. [11]Wu, Z., & Huang, N. E. (2009). Ensemble empirical
mode decomposition: a noise-assisted data analysis method. Advances in adaptive data analysis, 1(01), 1-41. [12]Aggarwal, C. C., & Wang, H. (2011). Text mining in
social networks. In Social network data analytics (pp. 353-378). Springer, Boston, MA.
[13]Göpferich, S. (1995). A pragmatic classification of LSP texts in science and technology. Target. International Journal of Translation Studies, 7(2), 305-326.
[14]Mosquera, A., & Moreda, P. (2012, May). Smile: An informality classification tool for helping to assess quality and credibility in web 2.0 texts. In Proceedings of the ICWSM workshop: Real- Time Analysis and Mining of Social Streams (RAMSS). classification tasks. Information Processing & Management, 45(4), 427-437. [15]Forman, G. (2003). An extensive empirical study of
feature selection metrics for text classification. Journal of machine learning research, 3(Mar), 1289-1305. http://www.jmlr.org/papers/v3/forman03a.html
[16] Sokolova, M., & Lapalme, G. (2009). A systematic analysis of performance measures for classification tasks. Information Processing & Management, 45(4), 427-437. [17] Clark, E., & Araki, K. (2011). Text normalization in
social media: progress, problems and applications for a pre-processing system of casual English. Procedia-Social and Behavioral Sciences, 27, 2-11.
[18] Hu, X., & Liu, H. (2012). Text analytics in social media. In Mining text data (pp. 385-414). Springer US.
[19] Baldwin, T., Cook, P., Lui, M., MacKinlay, A., & Wang, L. (2013). How noisy social media text, how different social media sources? In Proceedings of the Sixth International Joint Conference on Natural Language Processing (pp. 356-364)
[20] He, W., Zha, S., & Li, L. (2013). Social media competitive analysis and text mining: A case study in the pizza industry. International Journal of Information Management, 33(3), 464-472.
[21] Agichtein, E., Castillo, C., Donato, D., Gionis, A., & Mishne, G. (2008, February). Finding high- quality content in social media. In Proceedings of the 2008 international conference on web search and data mining (pp. 183-194). ACM.
[22] Tan, A.-H. (1997). Cascade ARTMAP: Integrating neural computation and symbolic knowledge processing. IEEE Transactions on Neural Networks, 8(2), 237-250. [23] Tong, S., & Koller, D. (2001). Support vector machine
active learning with applications to text classification. Journal of machine learning
research, 2(Nov), 45-66.
http://www.jmlr.org/papers/v2/tong01a.html
[24] Sriram, B., Fuhry, D., Demir, E., Ferhatosmanoglu, H., & Demirbas, M. (2010, July). Short text classification in twitter to improve information filtering. In Proceedings of the 33rd international ACM SIGIR conference on Research and development in information retrieval (pp.
841-842). ACM.
https://dl.acm.org/citation.cfm?id=1835643
[25] Clark, E., & Araki, K. (2011). Text normalization in social media: progress, problems and applications for a pre-processing system of casual English. Procedia-Social and Behavioral Sciences, 27, 2-11.
[26] Hu, X., & Liu, H. (2012). Text analytics in social media. In Mining text data (pp. 385-414). Springer US.
[27] Baldwin, T., Cook, P., Lui, M., MacKinlay, A., & Wang, L. (2013). How noisy social media text, how diffrnt social media sources? In Proceedings of the Sixth International Joint Conference on Natural Language Processing (pp. 356-364).