L
ANCASTER
U
NIVERSITY
D
EPARTMENT OF
E
NGINEERING
Surface Temperature Equalisation
Through Automated Laser Vaporisation of
Thick Film Electrical Heating Elements
Author:
J
OSHUAI
NGHAMSupervisor:
D
R. D
AVIDC
HENELERA thesis submitted in fulfilment of the requirements
for the degree of Master of Research
Dedication
Declaration of Authorship
I hereby declare that except where specific reference is made to the work of others, the contents of this dissertation are original and have not been submitted in whole or in part for consideration for any other degree or qualification in this, or any other university. This dissertation is my own work and contains nothing which is the outcome of work done in collaboration with others, except as specified in the text and Acknowledgements. This dissertation contains no more than 35,000 words including appendices, bibliography, footnotes, tables and equations and has fewer than 150 figures.
Abstract
The increasing proportion of energy used by electric heating devices creates
an ever-growing demand for more efficient heating technology. This research
project investigated the CO
2laser ablation of partially oxidised Ni-Fe-Cr-NiO
flame sprayed electrical heating elements in order to develop an automated
system to optimise the surface temperature profile of thin film electrical
heating elements. The optimisation technique used was the targeted local
resistance change across the surface of a heating element’s film so that the
element temperature profile produced through the joule heating of the
con-ductor is uniform and evenly distributed. Various surface treatment
process-ing methods were developed that were used for the automated treatment of
the element. These processing methods were compared and analysed through
the standard deviation and kurtosis of the element’s surface temperature
distribution, the greatest improvement of all the processing methods showed a
71% reduction in standard deviation of the surface temperature distribution
Acknowledgements
Thank you for the guidance and inspiration from Dr. David Cheneler who kept me on track throughout the project and highlighted what was important.
Thank you to the team from 2DHeat LTD; Marcus Rutherford, John Lewis and Steve Keating, for their unwavering belief, positivity and drive in working with myself on this project and for their funding provided towards the project.
Thank you to Dr. Xingzhong Liang and Dr. Pedro Riviera who trained and allowed myself to use their optical microscopy and polishing facilities in the Departement of Engineering at Lancaster University.
A grateful acknowledgement to Dr. Nathan Halcovitch and Dr. Sara Baldock who provided great assistance using the XRD and SEM in the Department of Chemistry at Lancaster and for their patience with the flurry of questions I asked.
Thank you to Dr. Alex Robson, who provided support and help in the microscopy of the material in collaboration with Lancaster Material Analysis Ltd.
This project was supported by 2DHeat LTD, the Centre for Global Eco-Innovation and is part-financed by the European Regional Development Fund.
Contents
1 Introduction 1
1.1 Background . . . 4
1.2 Motivation . . . 6
1.2.1 Environmental Benefits . . . 6
1.2.2 Technological Benefits . . . 8
1.3 Objectives . . . 10
1.4 Organisation of the thesis . . . 11
2 Literature Review 13 2.1 Flame Sprayed Heating Element Characterisation . . . 14
2.1.1 Characterisation of the Alloy Particles Used for Flame Spray . . . 15
2.1.2 Oxidation of Metals and Alloys . . . 15
2.1.3 Prepared Powder for Flame Spray . . . 16
2.1.4 Morphology of the Spray Material . . . 17
2.1.5 Thermal Properties of the Element Components . . . 21
2.2 The Heat Production through Joule Heating of Plane Conductors . . . 22
2.3 Light Amplification Through Stimulated Emission of Radiation . . . 24
2.6 Laser Ablation of Films . . . 35
2.6.1 Material Change After Laser Irradiation . . . 36
2.6.2 Surface Factors Affecting Laser Treatments . . . 37
2.6.3 Laser Ablation of the Heating Element Film . . . 40
2.6.4 Experimental Literature on the Material After Heat Treatments . . . 42
2.6.5 Justification of the Choice of Laser for Further Experimentation . . . 42
2.7 Model of Targeted Conduction Pathway Reduction of Conductors for Uniform Sur-face Joule Heating of Conductors . . . 44
2.7.1 Laser Ablation for the Increase in Uniformity of Heat Output of the Element. 44 3 Methods 46 3.1 Optical Microscopy . . . 46
3.2 X-ray Techniques . . . 48
3.2.1 X-ray Diffraction . . . 48
3.2.2 Energy Dispersive X-Ray Fluorescence . . . 50
3.3 Scanning Electron Microscopy . . . 51
3.4 Scanning Electron Microscopy with Energy Dispersive Spectroscopy . . . 53
3.5 Optical Scanning Profilometery . . . 55
3.6 Microscopy Sample Preparation . . . 58
3.7 Resistance Measurement through the Four-Probe Method . . . 59
3.8 Statistical Techniques . . . 60
4 Experimental System Design Experiments 64 4.1 Properties of the intrinsic film . . . 65
4.2 Surface Roughness of the Element . . . 66
4.3 Preliminary Ablation Tests . . . 68
4.6 SEM & EDX Microscopy . . . 80
4.6.1 Summary of the Experimental System Design Experiments . . . 85
4.7 Processing Method Design Model . . . 87
5 Implementation of System Design 88 5.1 System overview . . . 88
5.2 Infrared Thermography . . . 90
5.3 Infrared Camera Integration . . . 93
5.4 Infrared Camera Calibration . . . 96
5.4.1 Flat Field Correction to the Thermal Camera . . . 96
5.4.2 Temperature and Emissivity Calibration . . . 96
5.5 Software Implementation . . . 99
5.5.1 Image Acquisition . . . 99
5.5.2 Image Processing . . . 99
5.5.3 Selection of the Region of Interest . . . 101
5.5.4 Image Distortion Calibration . . . 102
5.5.5 Image Scaling . . . 104
5.6 Laser Control Engineering . . . 106
5.6.1 Laser Gantry Control . . . 106
5.6.2 Software Path Control . . . 107
5.7 Laser Processing . . . 108
5.7.1 Laser profile . . . 108
5.7.2 Laser Power Output and Delivery to Worktop . . . 109
5.7.3 Mirror and Lens System . . . 112
5.7.4 Mirror and Lens Radiation Transmission Efficiency . . . 114
5.8.2 Ventilation System . . . 119
5.8.3 Interlock Safety System . . . 120
5.8.4 Element Electrical Connection and Clamping System. . . 121
5.8.5 Mirror Alignment . . . 123
5.9 System Validation and Calibration . . . 124
5.9.1 Depth of Pulsed Spots on the Material . . . 124
5.9.2 Greyscale Pulsed Output Implementation . . . 126
5.9.3 Time to Reach Steady State Investigation . . . 129
5.10 Resistance Experiments . . . 131
5.11 Maintenance of power output as element resistance changes . . . 133
5.12 Laser-Treatment Processing methods . . . 134
5.12.1 Abrasion baseline . . . 134
5.12.2 20% Threshold (20%) Temperature Profile Measurements . . . 137
5.12.3 50% Threshold (50%) Method . . . 139
5.12.4 Greyscale (GS) Method . . . 141
5.12.5 Greyscale-Threshold(GT) Temperature Profile Measurements . . . 143
5.12.6 Greyscale Threshold + Memory (GM) . . . 147
5.13 Processing Method Metrics . . . 148
5.13.1 Resistance Change Through Various Processing Methods . . . 152
5.14 Discussion of the Various Processing Methods . . . 155
6 Conclusion 157 6.1 Further Work to be Done . . . 163
List of Figures
1.1 Image of the element surface produced by 2D Heat Ltd, the grey areas on the edges are silver contact paste, the larger, black region is the flame sprayed element. . . 2 1.2 The surface temperature of the thin film heating element with 3A and 6VDC applied
across the ends of the element. Imaged with the thermal camera used within this project. . . 3
2.1 Ternary Ni-Cr-Fe phase diagrams of an isothermal section (650°C) and a liquidus projection respectively [13] . . . 19 2.2 Fe-Ni-O and Cr-Ni-O pseudo binary phase diagrams [13] [14] . . . 19 2.3 A model of a Gaussian beam width (w(z)) as a function of distance (z) along the beam
with beam waist w0, the depth of focus b, Rayleigh range zR and total angular spread
θ[20]. . . 24 2.4 A Gaussian beam profile, indicating a higher energy density from blue (lowest) to red
(highest). . . 27 2.5 Diagram modelling the laser vaporisation process with plasma formation occurring
at high laser intensities. . . 31 2.6 A diagram showing the internal reflection of light at interfaces of varying refractive
indices . . . 38
3.3 Diagram of a XRD diffraction experiment. . . 49 3.4 A diagram of an electron beam interacting with a material and a visualisation of the
resulting effects. Adapted from [45]. . . 52 3.5 A diagram of a Scanning Electron Microscope in operation to image a sample [46]. . 52 3.6 Surface roughness parameters indicated on a profile plot of an arbitary rough sample. 56 3.7 Diagram of the methodology of the resistance measurements of the element. . . 59 3.8 The plots of various distributions with mean 0, variance 1, and against the excess
kurtosis where 0 excess kurtosis indicates absolute an kurtosis of 3). The normal distribution is labelled with an excess kurtosis of 0 and an absolute kurtosis of 3 as is the definition of the kurtosis [49]. . . 62
4.1 An optical image of the cross section of the film after mounting and polishing. The film thickness was found to be 39±8µm. . . 65 4.2 A 3D re-projection of the profilometer data of the surface heights across an 10x20mm
section of the element compared against a mean level, heights not to scale with the width and length of the element. . . 67 4.3 A matrix of continuous wave carbon dioxide laser irradiation of the flame sprayed
element at various speeds and powers of laser using the PIRANHA system. . . 69 4.4 Tabulation of the effect of the continuous wave laser on the material at various
powers and speeds. . . 71 4.5 Tabulation of the calculation of the fluence ( J/mm2) applied to each spot size
4.6 An optical image of squares of ablation after mounting and polishing the upper surface. The fluence of each is shown in figure 4.5. . . 75 4.7 Optical images of the cross section of the film before ablation at the same
magnifi-cation as 4.8. . . 76 4.8 Optical images of the cross section of the film after ablation. The ablated sections
cut across the lines of ablation with the beam having a slight overlap in each line of ablation. . . 76 4.9 XRD results shown with the miller indices indicated for various shown species.
A:Prepared Pre-flame sprayed powder, B: Flame sprayed element, C: Laser ablated element, D: Heavily laser ablated flake. . . 78 4.10 A SEM image of the raw surface roughness and four EDX elemental maps of the
distribution of Ni O Cr and Fe on the rough sample. . . 81 4.11 A SEM image and four EDX elemental maps of the distribution of Ni,O,Cr and Fe of a
polished sample of a raw element. . . 81 4.12 A SEM image and four EDX elemental maps of the distribution of Ni,O,Cr and Fe of a
continuous laser ablated line at 25W at 300mm/s with a 0.2 mm spot size. . . 82 4.13 A SEM image and four EDX elemental maps of the distribution of Ni,O,Cr and Fe of
two laser ablated rastered lines each at 25W and 300mm/s with a 0.2 mm spot size. . 83 4.14 A SEM image and four EDX elemental maps of the distribution of Ni,O,Cr and Fe of a
polished laser track ablated with a continuous laser at 25W and 300mm/s with a 0.2 mm spot size. . . 84
5.4 Image of the infrared sensor and control circuit which is 2.2x3cm in size. . . 93
5.5 Graph of the pixel value of the sensor against the values measured by the spot thermometer and the Thermocouple with linear fits added. . . 97
5.6 Diagram showing the result and the area of influence of bicubic interpolation on a sample greyscale image. . . 100
5.7 Comparison of the images before and after lens calibration with the corners of the chequerboard indicated by the calibration algorithm. . . 103
5.8 Image showing the transformation of the thermal camera pixel coordinates to the laser coordinates. . . 104
5.9 A graph comparing the positions measured in the laser grid and the positions measured in the thermal image. . . 105
5.10 Laser path and gantry design without worktop placed within, the laser tube is roughly 1m in length with the gantry area encompassing 200x300mm. . . 107
5.11 Laser pulses onto acrylic media in a line set to only just overlap. Each pulse has a width of 0.13mm±0.01 mm which corresponds to the beam width. . . 109
5.12 Graph displaying the power of the laser at various percentages of power selected on the manual power selection knob. Y-axis error bars due to the uncertainty from the power meter recording. . . 111
5.13 Transmission of infrared radiation through a ZeSe lens [58]. . . 113
5.14 Components connected within the coolant system. . . 116
5.15 Components connected within the ventilation system. . . 119
5.16 A labelled diagram of the clamp system in operation. . . 122
5.17 Pulse overlap definitions are shown in the figure to illustrate the difference between the various overlap definitions. . . 124
5.19 A diagram of a greyscale transferred into a pulse map with the corresponding translation between the greyscale and the gap between pulses illustrated. . . 127 5.20 The output of the conversion of the greyscale to a pulse map which is lasered onto
an acrylic sheet. . . 128 5.21 The standard deviation of the temperature profile over time for an element heated
through various heating techniques. . . 130 5.22 Resistance as a function of temperature normalised by the initial resistance. Error
bars result from the uncertainty due to measuring high resistances leading to small voltages with the voltmeter at the range of . . . 132 5.23 The Abrasion method is used to ablate element, contour plots of the surface
temper-ature profile measurements shown after each cycle of ablation. The initial element is seen in the top left plot, reading from left to right in rows the element is ablated in each step, these are marked by numbers in the plots. . . 136 5.24 20% method used to treat element, contour plots of the surface temperature profile
measurements shown after each cycle of ablation. The initial element is seen in the top left plot, reading from left to right in rows the element is ablated in each step, these are marked by numbers in the plots. . . 138 5.25 50% method used to ablate element, contour plots of the surface temperature profile
measurements shown after each cycle of ablation. The initial element is seen in the top left plot, reading from left to right in rows the element is ablated in each step, these are marked by numbers in the plots. . . 140 5.26 Contour plots of the surface temperature profile measurements after each cycle of
5.27 The first repetition of the Greyscale - threshold hybrid (GH) method is shown in the contour plots of the surface temperature profile measurements shown after each cycle of ablation. The initial element is seen in the top left plot, reading from left to right in rows the element is ablated in each step, these are marked by numbers in the plots. . . 144 5.28 The Second repetition of the Greyscale - threshold hybrid (GH) method is shown in
the contour plots of the surface temperature profile measurements shown after each cycle of ablation. The initial element is seen in the top left plot, reading from left to right in rows the element is ablated in each step, these are marked by numbers in the plots. . . 145 5.29 The third repetition of the Greyscale - threshold hybrid (GH) method is shown in
the contour plots of the surface temperature profile measurements shown after each cycle of ablation. The initial element is seen in the top left plot, reading from left to right in rows the element is ablated in each step, these are marked by numbers in the plots. . . 146 5.30 The Greyscale - threshold hybrid method plus memory processing is used to treat the
element. The result is visualised in contour plots of the surface temperature profile measurements shown after each cycle of ablation. The initial element is seen in the top left plot, reading from left to right in rows the element is ablated in each step, these are marked by numbers in the plots. . . 147 5.31 The standard deviation of the element after ablation relative to the unablated element.151 5.32 The kurtosis of each element after each cycle of ablation from various processing
methods. . . 152 5.33 The electrical resistance of the device after ablation by the Greyscale Hybrid method
List of Tables
2.1 Thermodynamic Material Parameters of the Components of the Flame Sprayed Element . . . 21 2.2 Electrical Material Parameters of the Components of the Flame Sprayed Element . . 23
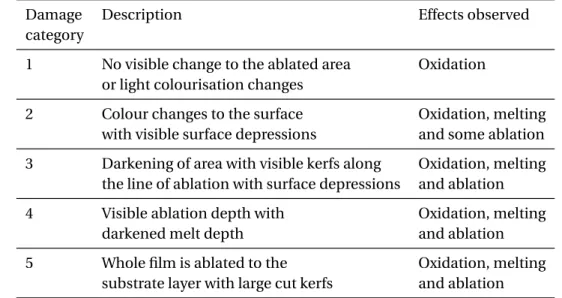
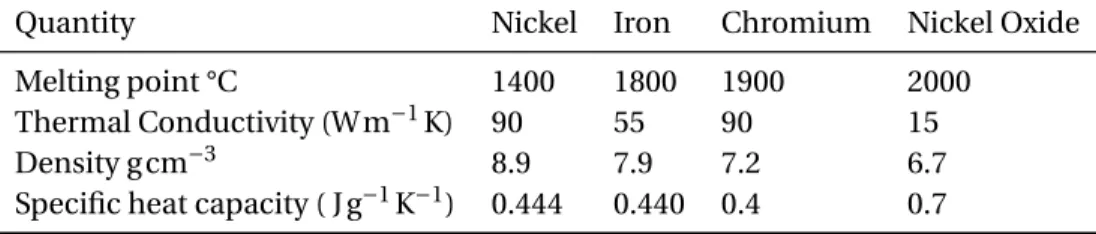
4.1 Scanning probe measurements of the average surface roughness of the unablated element. . . 66 4.2 Characterisation of damage to the film surface from the continuous wave laser
ablation matrix . . . 69 4.3 XRD results summary of the proportion of various compounds on various materials
investigated. . . 77
5.1 Power output data of the laser tube. . . 115 5.2 Average depth of pulses ablated onto the film with various overlaps at 2.26 J cm−2, 30
µs pulse, 0.13mm spot size. . . 125 5.3 Summary of the differences between the processing methods. . . 135 5.4 The performance metrics of the various processing methods used to compare
Chapter 1
Introduction
There is considerable interest into environmental and engineering advantages of improve-ments to conventional electric heaters. 2D Heat Ltd manufacture metal oxide films that are flame sprayed onto surfaces. The film is formed from an Inconel 600 powder through a flame spray process with the main constituents of Ni-Fe-Cr-O. The film as deposited on a stainless steel substrate on top of an aluminium coating is shown in figure 1.1. Due to the flame spray process, the oxidation of the film is much higher than predicted by the initial metallic Inconel 600 powder. This increases the electrical resistance of the film making it suitable for the incorporation in an electrical heating device such as an electric heating element.
Figure 1.1: Image of the element surface produced by 2D Heat Ltd, the grey areas on the edges are silver contact paste, the larger, black region is the flame sprayed element.
The goal of the project is to reduce the hot spot size and increase the uniformity of the heat output of the heating element. Currently, the technology is not integrated within any existing technology. By improving the accuracy, and precision of the heat output of 2D Heat’s thin film heaters the hope is that the technology becomes more attractive to industry, allowing it to be integrated into existing products.
0 10 20 30 40 50 60 70 80 90 100 110 120 130 140 150
mm
0
10
20
30
mm
30 40 50 60 70 80 90 100 110 120 130
Temperature (°C)
Figure 1.2: The surface temperature of the thin film heating element with 3A and 6VDC applied across the ends of the element. Imaged with the thermal camera used within this project.
This piece of work is part of the current paradigm shift to industry 4.0 which signifies the fourth industrial revolution. The first revolution was mechanisation and steam power, second the invention of electricity and mass production, third the automation of processes, and the fourth defined as integration of cyber-physical systems using AI (artificial intelli-gence) to monitor physical processes and making decisions on how to optimise a process without human intervention.
1.1 Background
The panels are produced through a flame spray process, which is a process where the powder to be attached to the surface is heated and oxidised within a flame. Through the high pressure and temperature of the powder flow, it adheres to the surface it is being sprayed upon. Through utilisation and optimisation of this process, 2DHeat LTD produce thick film samples of the film on a variety of sizes and geometries from small rectangles to large squares and cylinders.
The powder used within the flame spray process is a Inconel powder (Inconel 600) with approximately 75wt% Ni, 15wt% Cr, 10wt% Fe (±5%) with particle size 25µm±23µm [2], as the powder is sprayed onto the substrate the powder is atomised by the spray, this leads to an in-homogeneous coating as there is a wide range in particle size and morphology.
Each coating layer is approximately 20 ± 10µm with multiple coatings added to the surface until the desired thickness is reached. This research has been inspired by the technical obstacle that when a load is applied over the heater, there is a variation in the temperature profile of the heater. The general morphology of this profile is a hot spot usually centred over the central region of the element surrounded by a colder region on the periphery of the element.
Initially to reduce the hot spot and increase the uniformity of temperature profile an abrasion technique was developed. This process increases the uniformity of the temperature profile by removing material manually by rubbing abrasive paper along the edges and cold regions of the element. This reduces the thickness of the conductor in that section and as the resistance of a conductor is proportional to its cross-section, the power output and thus temperature profile in that region increases.
The main disadvantage to this process is that it is manually intensive as an experienced technician must analyse each unique temperature profile and the process is time intensive due to the switching on and off of the element and the intermittent time it takes for the element to cool down. It is sought within this research to automate this process of analysis and material removal. It has been specified by the sponsors that a laser treatment is to be investigated to accomplish this goal. The advantages of using a laser machine are it is fast, creates reproducible results, and the element can be kept live whilst being processed. Thus the researchers agree that a laser system is suitable for the automation of this process.
1.2 Motivation
1.2.1 Environmental Benefits
This project’s funding was associated with the research and development of devices that can reduce the emissions of greenhouse gasses. As a result it is pertinent to analyse the environmental benefits of the heating element technology being optimised and how it fits into the general scheme of heating element technology.
In 2017, 75.4% of all energy consumption (excluding transport) was used for the production of heat within the United Kingdom and Northern Ireland [3]. 13% of this heat was produced through electricity, the remainder through a combination of gas (68%), oil (8%), solid fuel(3%), bio-energy and waste(8%) [3]. Electricity is the only component of which a proportion of the energy was derived from low carbon production such as renewable and nuclear energy.
The greenhouse emissions produced through the production of electrical energy de-pend upon mixture of electricity production techniques used to provide power to the grid. In 2017 low carbon generation (nuclear and renewables) accounted for 50.4 % of the overall power generation. Additionally, this was a record proportion of low carbon power generation with the proportion of low carbon generation to be increased in the future [5].
Due to the large amount of energy consumed in heat production, the trend towards a more green mix of electricity generation and the low proportion of electricity currently used to produce heat, there is a growing need within the market for electrical heaters. In order to fill this void, new technologies are required that are more efficient, maintain a low economic and environmental cost of production, and have a high engineering versatility such that they can readily be integrated into and replace existing technologies.
1.2.2 Technological Benefits
Heating elements are usually made from wires or coils of wires and are encased in thermal blocks so heat diffuses from the high temperature wire inside [6]. Due to the high temperature of the wire and its small size it emits heat in a non-uniform fashion and reaches high temperatures (500°C - 1000°C) [6]. Due to the large sizes of the aluminium blocks, it takes a long time for the heater to get to their working temperature (40°C-50°C). Thus consumers then tend to over heat homes through the over driving of the electrical element as the element is slow to reach working temperature and to cool down after deactivation. Furthermore, the temperature of the block needs to be carefully controlled by turning the heater on and off so it does not overheat due to the high temperatures of the wire heater.
2D Heat LTD have produced a thick film coating that, when a power source is connected to either side of its coating, increases the coating temperature through joule heating. The thermal mass is orders of magnitude smaller than existing technology meaning that once the heater is on it is at its operational temperature. As a result, the time to reach working temperature is between 2-4 minutes. This lowers the time needed to get to the working temperature and subsequently is more efficient in switching between the on and off stages resulting in more efficient use of the device.
The heater delivers the heat over a large area and there is a large degree of controlling the element, which means the heater temperature can be selected more accurately. This reduces the energy use of the heater as the temperature of the heater can be selected more accurately. In addition to providing more efficient heat delivery, there has been interest into these devices from companies looking to provide heating processes within their designs. Such interest has been shown from the vacuum beam line, kitchen appliances, and transport industries.
1.3 Objectives
The goals and objectives for this body of research are listed below:
• Research the effect of lasers on the target material’s morphology, resistance, and heat profile.
• To establish the power and duration of laser treatment to improve the heat profile of the heating element.
• To establish techniques of mapping the heat profile of the heating element.
• To create a processing method to alter the heating profile to create a high degree of uniformity of the temperature profile across the element surface.
1.4 Organisation of the thesis
Initially the thesis considers the morphology and composition of the flame sprayed element through analysing its manufacture process and constituents in the context of previous lit-erature on similar or same materials. Then various properties of the elements constituents are analysed with respect to their electrical, thermodynamic and optical properties. Then the theory of how laser beams are produced and the optical engineering of lasers is analysed so that the design of laser systems can be understood. Next the theory of laser-material interactions are investigated with a focus on the laser interaction of carbon dioxide lasers with metal / metal oxides.
Finally the heat production of the heating element due to joule heating is considered with the goal of creating a model of laser-material interaction leading to the local resistance change of the element to produce a uniform temperature profile of the element whilst producing heat through joule heating. A methods section is included that analyses the various microscopy techniques used in the project.
Then a stand along laser-infrared camera system was developed to fit the parameters specified by the processing strategy. The development and verification of this systems functions and capability is thoroughly documented within the thesis. Several processing methods are then constructed to identify the optimal areas and level of treatment to be delivered to the element.
Chapter 2
Literature Review
2.1 Flame Sprayed Heating Element Characterisation
There are two stages in the manufacture of the films, the preparation of the powder and the deposition of the powder. Each stage involves the use of powder within a flame spray process. The preparation stage is where the initial powder is oxidised by a flame spray, quenched and then collected. The second stage is where the powder is deposited onto a substrate using the flame spray[7]. For the utilisation of this flame spray process, the sponsor of this research, 2DHeat Ltd, have developed a primarily nickel/nickel oxide coating. This research will refer to the four forms of the film, namely the base material powder, the prepared powder, the flame sprayed film, and the laser ablated film.
The thermal spray method used for the manufacture of these elements is defined as flame powder spraying. A powder is fed into an oxyacetylene-fuel flame so the powder undergoes melting, oxidation, and atomisation and is carried by a mixture of flame and carrier gases to substrate.
2.1.1 Characterisation of the Alloy Particles Used for Flame Spray
Previous research has been extensively done on the flame sprayed film by Duffield(2017) [2], whose research provides much of the initial theory on the properties of the sprayed powder. A powdered alloy (Inconel 600) is the base material for the manufacture of the films. This alloy, before flame spray, is characterised as a powdered Ni-Cr-Fe alloy (approximately 75wt% Ni, 15wt% Cr, 10wt% Fe) [2].
The material science, whilst very complex, has had some in depth examination through work done by Duffield(2017) on these films and powders . They found the particle size distribution through image analysis of the original alloy particles at 25µm ±23µm. Through X-Ray diffraction (XRD), the initial powder was found to have a majority of alloy phases with a small quantity of NiO formation with a calculated lattice parameter of 4.17 Å. This matches with other research into more pure samples of NiO [8].The base powder used to make the elements in this research is the same powder that Duffield examined, hence their conclusions also apply to this work.
2.1.2 Oxidation of Metals and Alloys
This has been confirmed by Mrowec and Grzesikin (2004) showing that, at temperatures over 1000°C, results within literature generally conform to this model of oxide growth [9]. Through examination of markers at the metal and metal oxide interface, they observed that Ni cations were diffusing outwards throughout the oxide. In addition, experimental parabolic rate constants for nickel oxidation were found to agree with theory.
However, when lower temperatures are considered, the oxidation mechanisms are more complicated. This is due to oxidation no longer following Wagner’s theory of oxidation [10]; in some cases rates were found to be over one hundred times higher than predicted [11].
A hypothesis for this is the grain boundaries and dislocations causing ’short circuits’ of higher areas of oxide formation [11]. This was found experimentally via the use of isotope markers in the range 500-1300°C where violations to the parabolic oxidation law were observed [11]. This provides evidence that within the thermal processes of the laser treatment, the oxidation within the heat affected zone is likely to increase.
2.1.3 Prepared Powder for Flame Spray
The prepared powder is the powder that is used for the flame spray process. This powder is formed from the base alloy after an oxidation step. The preparation of the powdered alloy consists of increasing the oxidation of the original powder. During this process no other powders are mixed into the original powder. It was found to have a size distribution of 36
For this powder, Duffield used XRD to prove this assumption, a value of the lattice parameter of 3.56 Å) for the Nickel Oxide as well as low alloyed Ni (lattice parameter 3.53 Å). The weak peaks Duffield found indicate a small amount of spinel phases (lattice parameter 8.33 Å) present. Through comparing to other work done on thermal spraying processes, this type of in-homogeneous powder is typical for flame spray material [7].
It is reasonable to consider the conclusions of Duffield(2017) to be appropriate for this project as the samples used in this project are similar to the samples Duffield(2017) investigated and produced under similar conditions. In addition, data is compared to Duffield’s data to show where deviations to his data were found.
2.1.4 Morphology of the Spray Material
To characterise the material after flame spray deposition Duffield (2017) used X-ray diffrac-tion and SEM-EDS, which showed a high percentage of Cr and Fe doped NiO as well as the original alloy and low alloyed Ni in addition to a spinel phase. Approximately 62% oxide, 17% metal and 21% voids were recorded by Duffield (2017), using image analysis of the cross section of the film. They then compared the results of the X-ray diffraction patterns to the powder before flame spray, this data suggested that the phases detected in the prepared powder remained present.
Through optical examination of the cross section of the films, they show a variety of morphology in the material. The film has a combination of columnar and equiaxed grain structures cultivated by the temperature difference in flame spray processing [2]. It is characterised as molten particles flattening upon impact and forming columnar grain formations, more solid particles deform less during the deposition process which produces a more equiaxed grain structure in this region[12].
Due to the variance in the processing of the particles in the flame spray process there is a variety of deformation within the film, this is shown most clearly by examining the metallic regions in the film. Due to the variance in the path and temperature experienced by each particle there is a variety of morphology in the film. The particles with a lower temperature at impact and higher metallicity were found to form a spherical morphology in the film. The higher the temperature and the lower the metallicity of the particles, the greater the amount of material that is dispersed upon collision with the substrate.
This led to a more ’milky splat’ as the NiO and metallic regions develop better bonds with the material nearby[2]. In addition to the more macro-microscopic morphology, they found microscopic morphology of oxide particles distributed within the metallic regions, and metallic particles dispersed within an outer oxide shells [12].
Duffield (2017) found that the increased intensity of the metallic diffraction peaks relative to the oxide peaks indicate the preferential accumulation of metallic phases during flame spray. He attributed this difference between the metal and oxide deposition rates to the disparity in the materials’ melting temperatures.
Figure 2.1: Ternary Ni-Cr-Fe phase diagrams of an isothermal section (650°C) and a liquidus projection respectively [13]
After the flame spray of the prepared powder, more phases are detectable by XRD. Duffield (2017) found the dominant phase with a NaCl crystal structure comparable to that of NiO. He calculated the lattice parameter of 4.17 Å which is 0.2% off the NiO data file value of 4.178 Å[8]. Duffield also found regions of Ni,Fe and Cr metallicity as well as a spinel phase in low proportion. Within the initial powder there is a variety of elements present but only the three distinct regions can be separated of metallic regions, oxide regions and spinel phase.
This is due to the similar lattice parameters of the Nickel, Iron, and Chromium. Another reason for a lack of iron oxide and chromium oxide in the XRD diffractogram is that the nickel oxide matrix can integrate appreciable quantities of Fe and Cr at high temperatures. This is evident as the Ni-Fe-O [13] and Ni-Cr-O [14] phase diagrams suggest that NiO integrates large quantities of Fe and Cr at high temperatures within the range of parameters in the flame spray process.
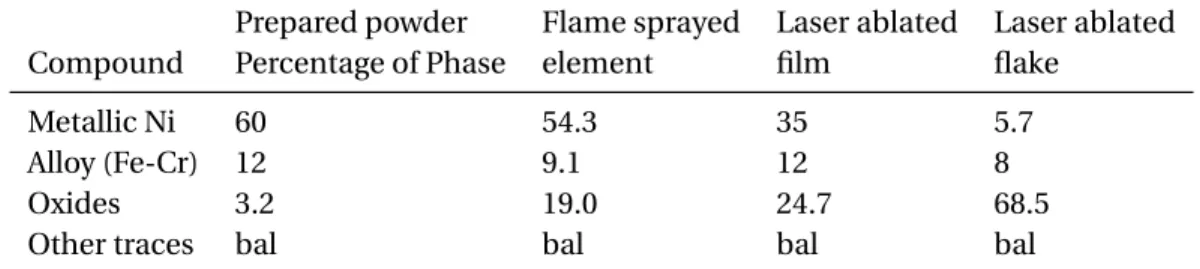
Table 2.1: Thermodynamic Material Parameters of the Components of the Flame Sprayed Element
Quantity Nickel Iron Chromium Nickel Oxide Melting point °C 1400 1800 1900 2000
Thermal Conductivity (W m−1K) 90 55 90 15 Density g cm−3 8.9 7.9 7.2 6.7 Specific heat capacity ( J g−1K−1) 0.444 0.440 0.4 0.7
2.1.5 Thermal Properties of the Element Components
To investigate the thermodynamics of the system, the melting and boiling points, thermal conductivity and density of the various components of the film need to be compared. Table 2.1 compares these parameters. The values for the melting points of the elements and thermal conductivity is given through the Engineering toolbox [16].
This data has been collated from a review of other publications for the use of Engineers and scientists. This allows this research to make qualitative arguments and comparisons of the morphology changes seen later within the thesis. The vast difference between the components is the melting temperature. The metallic Nickel has the lowest melting point with the Iron and Chromium having higher melting points, and the Nickel Oxide having the highest melting point.
2.2 The Heat Production through Joule Heating of Plane
Conductors
The film is designed as a heating element. The projects goal is to increase the uniformity of the heat output of the films when they are used as heating elements. The primary method of heat production of the elements in joule heating in the conductor by a electrical power input. This section considers the theory of how this heating originates and then generates a theoretical model of how with a targeted laser treatment the films heat output uniformity can be increased.
The conduction in solids of electrons in an electric field is given by equation 2.1 where the current densityJis determined by the conductivityδand the applied electric fieldE. The current densityJis defined as the electric current per unit area of the cross section of the current path.
J=σE (2.1)
Where:
σ= 1
ρ (2.2)
Table 2.2: Electrical Material Parameters of the Components of the Flame Sprayed Element Quantity Nickel Iron Chromium Nickel Oxide
Resistivity nΩm 69.3 96.1 125 548
d P dV =J
2ρ (2.3)
This shows that the amount of heat production at a point is proportional to the current density squared times the resistivity. The two primary components of the material under investigation are the metals (Ni,Fe,Cr) and oxides (NiO, Iron Oxide, Chromium oxide).
These follow the conduction law above but will contribute different factors to the conductivity. Table 2.2 shows the resistivity of the various components in the film. The Nickel has the lowest resistivity out of all the components and the Nickel Oxide has a resistivity much larger than the other components.
The lowest resistance is found in the Nickel components. Therefore the nickel com-ponent will have the largest current flowing through it from equation 2.1. The resistance of the Iron and Chromium is much lower than the resistance of the oxides thus they till will have some current flowing through but on a lower relative magnitude than the Nickel component. This means the metallic regions will contribute the greatest amount to the heat production of the element.
Figure 2.3: A model of a Gaussian beam width (w(z)) as a function of distance (z) along the beam with beam waist w0, the depth of focus b, Rayleigh range zR and total angular spreadθ[20].
2.3 Light Amplification Through Stimulated Emission of
Ra-diation
The central component of the lasing process is the laser resonator, also known as the laser tube. This houses the gasses and mirrors used for the lasing process, within a CO2laser, the
main focus of this research, these are CO2N2and He gasses. The CO2laser was the laser
chosen to be incorporated within this project, this is justified as the carbon dioxide laser is one of the most economical lasers on the market currently offering the highest lasing power at low monetary costs [19].
The main component in the tube is the gas chosen for lasing, this is known as the gain medium, for a CO2laser this is an isotope of CO2, this affects the lasing efficiency and the
The initial change in the state of the laser is induced through stimulation by an electric potential between the cathode and anode on the ends of the laser tube. This excites the molecules in the pumping medium (for CO2lasers: N2), subsequent collisions between the
ions and electrons in the discharge current excite further atoms onto various energy levels. The ratio between the Nitrogen to Carbon Dioxide is around 4:1 [22].
Lasing gasses are chosen so that there is a collection of energy levels within the gasses in the laser tube suitable for lasing in the correct proportions to maximise the efficiency of lasing. The basic criteria for this are the following; the need for a higher energy level with a short lifetime, a medium energy level with a long lifetime and a lower energy level with a short lifetime. This makes the inversion of the population of the energy levels by electrons possible, which describes the state when there are more electrons in the medium energy level than the lowest and highest energy level due to the difference in their decay rates.
As the photons are emitted from the medium and are reflected along the silvered mirrors at the edge of the laser tube, the population of the medium energy level is the most populated energy level. These electrons then either fall to the lower energy level or to the ground state emitting photons. This produces monotonic light in parallel rays of high intensity.
2.4 Laser Beam Optics
The laser beam has various optical properties that are important to be considered for the laser system so that it is designed to deliver optimal performance for the laser vaporisation of the element. Throughout this research, the beam is modelled around a Gaussian beam.
A Gaussian beam has the properties of being well approximated by Gaussian functions and the amplitude profile width is determined by the waistw0of the beam [23]. There are
various modes of the laser profile which are variations in the shape of the intensity profile of the laser, the only mode that is Gaussian is the TEM00mode, which is the mode explored
in this theoretical investigation and was used within the project [23].
I(R,Z)= 2P
πw(z)2exp(−2
r2
w(z)2) (2.4)
The equation describing a Gaussian beam is shown in equation 2.4 [19]. The intensity I(R,Z) at depth Z and radius R is proportional to the product of the ratio of the power (P) to area of beam (πw2) which decays exponentially by the ratio of the beam width (w(z) and the squared radial distance from the centre axis of the beam (r)).
The propagation of a Gaussian beam described by equation 2.4 is visualised in figure 2.3 and an image of the energy density of a Gaussian beam in cross section at the interaction with an interface is shown in figure 2.4 [24].
The image in figure 2.3 shows a Gaussian beam width (w(z)) as a function of distance (z) along the beam. The beam waistw0is defined by the distance from centre of the beam to
the point where peak intensity has decreased to 1/e2. The depth of focus b, Rayleigh range
Figure 2.4: A Gaussian beam profile, indicating a higher energy density from blue (lowest) to red (highest).
When focusing the laser through a focusing optical aperture like a lens, the beam profile can change. The minimum width of the beam focused through a lens defined as 2w0 is
given by equation 2.6, where F is the focal length of the lens,λis the wavelength of light and D is the diameter of the beam incident on the lens [19]. When this equation is applied to the 50.8 mm focal length Plano-convex lens, used within this project with a10.6µm beam, the minimum spot size is 0.08 mm.
2w0=
4λ
π
³F D
´
(2.6)
The depth of focus of the lens b is found from equation 2.7. Using equation 2.7 to find the depth of focus for a 50.8 mm focal length Plano convex lens to 10.6µm wavelength of light, gives a range of 2.54 mm with a focused spot size of 0.08 mm. Thus the variance in the work-piece height at the focal point of the lens must vary within this range so that the energy density applied to the surface is constant.
b=2πw0
2.4.1 Definitions of the Energy, Power and Fluence of Pulsed and
Con-tinuous Lasers
Many laser system properties are tuned to their application, a specific quantity of the laser system that is often controlled is the time period of the laser pulse. These can range from femtoseconds (10−13sto nano and micro seconds in the applications in laser ablation treatments [25].
These are generally classed as ultra short for time periods below nanoseconds and short pulses for nanosecond and microsecond pulses. This research will concentrate on short pulsed lasers in the micro second range and continuous laser ablation. Whilst ultra-short lasers are regarded as better suited for laser ablation applications with the ability to interact with areas with a minimised heat affected zone they are also expensive and thus outside the budget of this project.
The energy per pulse of a pulsed beam can be related to the power of the laserPAv using
the repetition rate of the laserRAv through equation 2.8 [19].
E= Pav
RRat e
(2.8)
To compare the energy output within different laser treatments the use of an energy fluence (φ) is usually measured in J/cm2. This is described in equation 2.9 where E is the energy of the laser pulse and A is the cross sectional area of the laser beam defined by the Gaussian beam width [19]. This is usually a circular area and as a result the equation for the area of a circle is used (A=πwo2).
φ=E
Continuous lasers create a continuous beam of energy until the voltage driving the ionisation of the laser tube is stopped. Common applications are the engraving or cutting of metal and surfaces. Instead of considering the pulse time of the laser the time under illumination at each spot the laser irradiates needs to be considered to find how much energy is delivered by the laser in this time frame. This is usually a function of the speed of the laser head raster and the size of the spot of the laser.
For continuous lasers, the energy delivered by the beam to the material is dependent on the dwell time of the laser over that spot. This depends upon the speed of the laser head and the size of the beam. This is described in equation 2.10.
E is the energy delivered in each spot of the laser track with exception to the first half diameter and last half diameter of the laser, some laser systems incorporate a ’punchout’ at the start to account for this. The average power isPavand the dwell time is t which is found
from the speed-distance equation substituted into equation 2.10 where v is the speed of the laser head relative to the work-piece and d is the diameter of the laser beam.
E=Pavt=Pav
d
v (2.10)
Finding the energy applied to the work piece with the continuous laser means the fluence delivered to each spot can be found and compared to the pulsed system. Through using 2.9 the fluence can be derived using the circular symmetry of the beam. This leads to equation 2.11 for the fluence delivered to an area of the material with the beam radius
w0[26]. This provides the ability to compare the energy applied to pulsed and continuous
beam ablation.
φ= 2Pav πwov
2.5 Laser Ablation of Solids
Electromagnetic radiation initially interacts with the electrons inside the metal or alloy since the electric and magnetic fields of the photon only interact with charged matter and the atomic protons are neglected due to their binding in the nucleus [21]. The electrons in the material are excited by the electric field, through collisions with the other constituents of the metal energy is transferred to the lattice.
The lattice will heat up and as the temperature rises, the amount of absorbed light may change depending on the composition, this is due to the change in collision frequency of the electrons. After absorption of the laser energy, the material gains thermal energy and if enough energy is provided the material melts and then vaporises. If further energy is provided, the vapour can be ionised to form a plasma, the whole process with the formation of plasma visualised in figure 2.5.
The figure shows a heat affected zone which is the area where the temperature of material rises and subsequently the material’s properties are affected. The melt depth, which is defined as the depth of material that is melted and reformed after cooling, can be seen closer to the beam and at a higher temperature than the heat affected zone when under illumination. Finally dependant on the energy of the beam a portion of the melted area is vaporised which is refered to as the ablated depth or ablation trench.
2.5.1 Absorption of Laser Radiation
Not to scale
Laser
Melt front
Substrate
Film
z
y
X
Plasma
Figure 2.5: Diagram modelling the laser vaporisation process with plasma formation occurring at high laser intensities.
When radiation is not absorbed or reflected in the surface atoms it is transmitted through the material, this leads to heating in the deeper layers of the surface of the material as more of the material absorbs the laser’s energy. The Beer-Lambert absorption model for laser beams interacting with media states that the intensity of a laser beam decays exponentially with depthz([21],[23]).
The Beer-Lambert law is described in equation 2.12. The optical penetration depth is defined as the inverse of the absorption coefficientα, which is a function of radiation wavelength and material properties. This is defined from equation 2.12, where the definition is that whenz=lαthe intensity Izhas been reduced to 1/e of the initial intensity
I0.
The absorption of infrared radiation by metals largely depends on conductive absorp-tion by free electrons [27]. Therefore the absorptivity can be calculated from data of the electrical resistivity of the film constituents. It has been demonstrated that the absorptivity of various polished metallic surfaces is a linear function of the square root of the electrical resistivity of the respective metals [27].
The proof of this and estimates for the absorptivity and reflectivity can be determined using the Drude model[27]. This is determined using the extinction coefficient, (κ) and refractive index (n) of the material through the equation 2.13.
α=4πκ λ R=
(n−1)2+κ
(n+1)2+k2 (2.13)
The electrons in the material undergo rapid oscillations as the laser impacts the surface, these are known as plasma oscillations[28]. The relation of the plasma frequency,wp
is related to the product of the conductivity ρ and the mean time between electronic collisionsτD and dielectric constant²owhich is described in equation 2.14 [29].
σ=wp2τD²o (2.14)
The plasma frequency equals the angular frequency of light incident upon incidence, the range of electromagnetic waves considered has a angular frequency (ω) much greater than the scattering time thus the expressions in equations 2.13 and 2.14 can be approxi-mated to the equation 2.15.
α=
s
2ωσ
c2²
o
From the equation 2.14, the absorptivity is related to the laser wavelength and resistivity of the material. This is useful as if the film resistivity is well defined the absorption of the laser can be approximated. The total absorptivity is generally proportional to more factors than this such as the laser beam incidence angle, surface roughness and material temperature but this provides a rough enough measure for a qualitative description.
The absorption of photons by a material generally rises as its temperature rises to its melting point, thus the absorption at room temperature is the minimum absorption of radiation of the material. Once the melting point of the system is exceeded the reflectance of the system falls towards zero, with the depth of transmittance decreasing [30].
As the laser provides heating to the area, the heat dissipates outwards due to thermal diffusion through the material. The length of thermal penetration through laser energy is characterised as the thermal penetrationlt h.
The thermal diffusion length characterises the distance over which temperature changes propagate in the time of laser irradiation. The thermal diffusion length is considered as a measure of how far the energy spreads from the region of the laser irradiation within the time of laser irradiation. This is defined in equation 2.16.
lt h=
p
Dτt h) :D=κ/ρcp (2.16)
Whereτt his the time for the pulse or time that the continuous beam illuminates a spot
width length. The effective penetration of the beam can be characterised by equation 2.17.
The total radial sphere topped cylinder, centred at the centre of the beam with radius
le f f, is the area affected by the laser at the immediate illumination of the laser. When the
laser stops illuminating a sample, the heat diffuses from that area. This region of thermal diffusion affected by the laser heating is defined as the heat affected zone (HAZ).
As a result of the rise in temperature in the affected area, the material exhibits a number of significant differences relative to the original material. The estimation of the size, temperature gradient and effects of the HAZ require formalisation of the differential heat equation and study of how the material will change when undergoing heat treatment [21]. This would require the numerical computation of this system to find quantitative results, which is made more difficult by the in-homogeneous surface structures and composition of the film.
The choice of laser wavelength illuminating a sample has a large impact on the optical and thermal penetration depth of the laser by a given material. The parameters of different lasers that alter the penetration depth are their wavelength, beam profile and interaction time.
2.6 Laser Ablation of Films
There are a variety of ablation regimes mainly characterised by the interaction time, fluence, and angle of incidence of the beam considered [32]. Different regimes dominate depending on the combination of process factors contributed by the laser system and the material. As has been previously discussed within the material section the focus of the research is on the laser ablation of the film which has a in-homogeneous composition of Nickel, Iron, Chromium and Nickel Oxide.
Athermal ablation is the induction of bond dissociation provided through photon energy absorption [33]. The bond strengths in Nickel Oxide have been investigated through the photo-luminescence of NiO nanoparticles [34]. It was found in this literature the emission is detectable in UV region from light of 3.72 eV to 3.47 eV indicating the breakdown of Ni-O bonds.
Thus a UV laser emitting energy in this region would at least be required to undergo these changes. Metals have a high binding energy because of their metallic bonding. The greatest photon energy provided by a UV laser is 6.4 eV (l ambd a =193 nm) [19] which is smaller than the binding energy of the metallic bonds making the athermal ablation of the film unachieveable. The wavelength of light of C02lasers is of an energy 5x smaller than this,
Thermal ablation takes place when an area gains energy greater than the combined sum of energy to heat the volume to its melting temperature, the change of state to melt the area and the energy required to vaporise the volume. This balance of energy is displayed by equation 2.18 [25]. Where the energy required to ablate a region is Ev, m is the ablated
mass, N the number of laser pulses,Epul se the pulse energy,∆Hm melting enthalpy,∆Hv
evaporation enthalpy, cp the heat capacity, TV evaporation temperature andT0 ambient
temperature.
Ev=m(cp(TV−T0)+∆Hm+∆Hv) (2.18)
This provides a value of the minimum amount of energy required to ablate a volume of material, in practice due to the reflection of the beam due to the surface and the diffusion of heat through the material the energy used can be much higher than this value.
2.6.1 Material Change After Laser Irradiation
Once the material has absorbed the energy from the laser, there are a variety of other effects that can take place within the material. The material has been shown to have a in-homogeneous composition of metals and metal oxides, this means there is a concentration gradients of oxidation within the material. As reviewed in the material properties section, the diffusion of ions in the material is limited by the fast quench rate in the flame spray process. The heating of the film means that the ion diffusion is no longer limited. The diffusion flux (J) is proportional to the diffusion coefficient (D) times the concentrationφ gradient. this is described in equation 2.19 [35].
The diffusion of metal atoms is a thermally activated process [9] thus the diffusivity can be written in the form of equation 2.20 [35]:
D=D0e−Ed/kbT (2.20)
whereD0 is the diffusion coefficient. Ed is the potential energy barrier height for the
ion motion inside the material,kb is the Boltzmann constant, and T is the temperature of
the ion. Thus it follows from equation 2.19 and 2.20 that the greater the temperature of the material the greater the diffusion of ions within the material. A hypothesis to draw is the metal- metal oxide regions seen in the material section after laser treatment will become lower and more homogeneously oxidised as the oxidised material is the vast proportion of material. In addition the ability for Nickel Oxide to absorb Iron and Chromium ions into interstitial sites means the Iron and Chromium portions will also become associated with the Nickel Oxide matrix.
2.6.2 Surface Factors Affecting Laser Treatments
The main variables in laser surface modification is the power of the laser, beam spot size, beam quality, speed of laser scan, film condition (roughness, temperature and absorptivity), composition, and thermodynamic properties [23]. The understanding and control of these laser processing parameters for the flame sprayed material is important to achieve repeat-ability and an optimum micro-structural change of the film.
Oxide
Metal
Figure 2.6: A diagram showing the internal reflection of light at interfaces of varying refractive indices
Additionally this means that there is an change to the energy distribution of absorbed light. Focusing effects can also take place on the material. When light is incident on a rough surface, the lights momentum must be conserved so the light is likely to be focused onto the bottom of the surface, due to impinging a small angle of incidence with the rough surface, increasing the energy density in that region.
Dependant on the roughness of the sample it is possible that where the average depth of ablation is greater than the thickness of the film the film s ablated completely in this area. As a result the film can be damaged and in an electrical system lead to short circuits, this is why careful control of the laser parameters for the film roughness is determined.
The absorption of light in materials with differing refractive indices and absorption also leads to some changes to the dynamics of transmitted light within materials. The film has been shown through the optical, X-ray microscopy techniques by Duffield (2017), to have an in-homogeneous structure arranged in layers of materials differing in composition and crystal structure. Due to the in-homogeneous structure, discontinuities between the layers of the element can arise.
Within this work, the angle of irradiation is constant throughout the process at 90° and polarisation of the beam is left unpolarised / untested because of experimental limitations. The literature states that lasers impinging on a material at an angle greater or less than 90° have a lower absorbance than impinging perpendicular to the surface [19]. In addition since the beam interacts with the work-piece at an angle the cross section of interaction is changed making the assumption of circular symmetry of the beam and workpiece to be invalid.
The dependence of ablation rates and fluence required for ablation on the number of laser pulses is called incubation [38], this is the process where by the ablation of one area results in the reduction of the threshold fluency of the next pulse.
The origin of incubation is usually attributed to the generation of high-density defects in the material. The subsurface regions affected by void/crack formation are expected to exhibit significantly lower heat diffusion lengths,lt h, than the homogeneous bulk material
2.6.3 Laser Ablation of the Heating Element Film
So far the laser ablation of samples has been very generalised, with only specifics added to the sections for the material under observation. This section compares the use of infrared lasers (CO2) in a pulsed regime for the use of laser ablation of the film.
To review, the film is made from a variety of components with Nickel, Chromium, Iron and Nickel Oxide, the main constituents as verified by the previous work into material science [2]. The primary phase is Nickel Oxide followed by the metallic Nickel, then in small quantities the Iron and Chromium. The metallic sections are held either in small bubbles of metallicity or are arranged in a milky pattern through the oxide matrix. There is the presence of voids within the material as well as a surface roughness of the order of a 10
µm variation in the height of features.
The percentage absorption of infrared lasers on Nickel Oxide samples between wave-lengths of 1 and 10µm was found to be as high as 80% indicating a high absorption of infrared light at the NiO interface can be absorbed[39].
Generally metals have a much higher reflection coefficient than oxides to infrared wavelengths of light [23]. Within the review of the film material properties it was found that, due to the high temperature of deposition in the flame spray process, the film has a layer of oxidation on its surface. This means this reflection coefficient value of 80% to infrared light is likely accurate for the whole film for the initial ablation of the film.
It was also found that the absorption coefficient rises steeply above 3.5 ev to be plateauing at a value of 106cm−1at 4 ev [40]. The NiO within the material has been found to have a high presence of impurities [2], thus the value of the absorption coefficient could be larger than 105cm−1to CO2radiation.
Other work done has found the absorption spectrum for NiO at a range of laser wavelengths, this is shown in appendix item A1. At 1.5 ev the absorption coefficient is 54000
cm−1thus the effective penetration depth, the depth at which the beam power is reduced to
1
e, is 0.185 micro m. This agrees with the value obtained through other literature, so seems
a reasonable value for this parameter.
The thermal penetration depth varies with the pulse or interaction time. Within the range of laser pulse or interaction time available, the interaction must be 0.01µsec or longer to have a thermal interaction size greater than the optical penetration depth, at this point half of the beams energy will be dissipated outside of the optical penetration depth.
Other material properties that are important for the heating of matter are its thermal diffusion and heat capacity. The heat capacity of NiO and semiconductors increases as they are heated due to the increase in conduction electrons. When metals melt their heat capacity increases but the difference between their melting point and vaporisation temperature is small [29].
2.6.4 Experimental Literature on the Material After Heat Treatments
To gain data for how the material could change after laser ablation a comparison cna be made to Duffield’s work on the heat treatment of Nickel Oxide flame sprayed films. Duffield (2017) heated the film at 800°C for 66 hours. He found that XRD showed the spinel 311 peak relative to the NiO 111 and 200 peaks increased notably during the process.
He found that the decomposition of the doped NiO was initiated at 600°C. He hypoth-esised that the spinel structure growth is due to the Cr and Fe metallic integration into the spinel structure while the Ni remains mainly in the oxide matrix. This provides some indication of the effect that a thermal laser treatment will have on the element surface and can be tested through other XRD and EDS experiments.
This indicates that in the heat affected zone of the laser interaction with the material it is possible for changes to the oxidation and crystalline structure to take place. Since the heating time is much smaller and the quench rate higher in laser treatments this should not effect a large proportion of the film but would be localised to the immediate areas of laser irradiation.
2.6.5 Justification of the Choice of Laser for Further Experimentation
This project, as most projects are, had a limitation on the amount that could be spent upon all the components in the project. Through comparing the cost of lasers per amount of output optical power the CO2 laser showed the greatest amount of optical power per
CO2lasers are currently available for purchase with combined gentry, control software
and safety features pre-installed. This has the added benefit of improving the reliability of the laser system as its design was already validated and tested prior to the inclusion in the project.
In addition, the relevant mirrors and lenses for the CO2laser are available at a cost point
within the budget of this project. The operation of a carbon dioxide laser is arguably the safest high energy laser due to the low laser frequency and respective low photon energy and the accessible range of absorbing materials for the construction of safety enclosures.
Through the flame spray deposition there exists a high surface roughness, oxidation, variance in constituents and general inhomgenity. This means that the detailed and specific micro machining of these structures is not possible and the use of a laser as specific and powerful a UV laser would not offer the advantages it has over a CO2system because
the film is too inhomgenous.
The CO2 laser wavelwngth has been shown in the literature to be absorbed by the
2.7 Model of Targeted Conduction Pathway Reduction of
Conductors for Uniform Surface Joule Heating of
Con-ductors
Since the material is made from multiple components there is a difference in the current density within the components. It is hypothesised that the metallic regions contribute the primary conduction medium. Thus the lines of conduction spread through the material like tree roots in the ground. If the volume of these current paths are reduced the cross section of the current flow will decrease and the current density will increase if the current flowing stays the same. If there is a larger current density the heat production will increase per voltage applied as shown through equation 2.3.
Since the voltage is applied across the whole element and the electrical resistance has increased within that area the heat production within that area will increase and the heat production within other areas will decrease as the proportionally higher resistance area gains a larger proportion of the energy.
2.7.1 Laser Ablation for the Increase in Uniformity of Heat Output of the
Element.
The oxidised nickel has a resistivity 10 times that of metallic nickel. This means for every area that is ablated the same area that is oxidised contributes 10x as much to the resistivity change. For this reason the analysis and observation of the device oxidation change is undertaken to understand these changes.
In addition the change in thickness of the conductor means there is less material for the element to heat and thus reaches a higher temperature this is given from the heat equation given in 2.21. This states that the amount of heat a mass of material m takes to heat a difference in temperature∆T is proportional to the product of the mass, temperature change and specific heat capacity (cp).
Q=mcp∆T (2.21)
The greater the amount of mass that is required to be heated the more energy is needed, thus if the ablation process is removing material the amount of energy required to heat the ablated region to the same temperature is decreased leading to a higher temperature.
![Figure 2.1: Ternary Ni-Cr-Fe phase diagrams of an isothermal section (650°C) and a liquidus projection respectively [13]](https://thumb-us.123doks.com/thumbv2/123dok_us/9303464.430947/39.918.182.821.164.447/figure-ternary-diagrams-isothermal-section-liquidus-projection-respectively.webp)
![Figure 2.3: A model of a Gaussian beam width (w(z)) as a function of distance (z) along the beam with beam waist w0, the depth of focus b, Rayleigh range zR and total angular spread θ [20].](https://thumb-us.123doks.com/thumbv2/123dok_us/9303464.430947/44.918.153.686.99.372/figure-gaussian-function-distance-depth-rayleigh-angular-spread.webp)

![Figure 3.2: Visualisation of the constructive interference of X-rays by an atomic lattice [42].](https://thumb-us.123doks.com/thumbv2/123dok_us/9303464.430947/68.918.275.558.734.899/figure-visualisation-constructive-interference-x-rays-atomic-lattice.webp)