© 2015 WIT Press, www.witpress.com
ISSN: 2041-9031 (paper format), ISSN: 2041-904X (online), http://www.witpress.com/journals DOI: 10.2495/SAFE-V5-N3-266-279
MAPPING COMMUNITY KNOWLEDGE OF
VULNERABILITY OF VALUE: A CASE STUDY IN THE UK
N. BHATTACHARYA-MIS & J. LAMOND University of West of England, UK.
ABSTRACT
Commercial property value can be vulnerable to risk exposure, economic effects of risk on property and perception of usefulness of the property in the market. The processes of decision making in risk reduction can generate differential exposure to risk making some organisations more vulnerable than others. This research deals with understanding exposure of property value to flood risk in a selected case study area in Wakefield, England. The work constitutes identification of variables that analyses the business vulnerability of organisations and presenting them through an operational framework. The operational framework is then practically tested in the field using the questionnaire survey method. The results from the survey show the differential attitude of respondents with varying levels of knowledge and occupational experience towards specific factors associated with flooding that may affect property value. However, a tendency can be observed for flooding and its effects to be taken more seriously in peoples’ perception. It was difficult to observe direct evidence of effect of flooding on commercial property price or rent, but it can be noticed that respondents from all flood hazard zones recognised flooding as an issue of concern and emphasised problems of ‘loss of income’ and the requirement for ‘cheap and easily available insurance’.
Keywords: conceptual framework, flood, perception, risk, vulnerability, value
1 INTRODUCTION
The degree to which organisations are vulnerable towards hazard does not wholly depend on the proximity to the potential source of threat. The determination of vulnerability of proper-ties in itself is a complex combination of characteristics and factors derived from their physical, social and economic environment. Most disaster research studies which primarily focus on pure economic damage assessment are limited in use for estimation of social, eco-nomic and environmental vulnerability for present and future. Therefore, some disaster literature emphasise the usefulness of examining disasters through the lens of vulnerability. They highlight that this provide real insights into the long-term socio-economic influence of disaster especially at a time when both frequency and magnitude of impacts are escalating [1]. It has also been pointed out in literature that holistic approaches which take into account the dynamic aspects of vulnerability should be included in research to understand the causal factors of vulnerability at different levels of hazard. Factors like development in flood plains and the subsequent increase in the density of infrastructure; unfamiliarity with existing risk due to increased mobility; and increased number of people living at risk make the population potentially more vulnerable towards existing flood risk [2].
There are about 300,000 business properties in the UK which are at risk of multiple sources of flooding indicating the significance of the problem to society. This subject, how-ever, has long been overlooked in research [6,7]. Over the last two decades, a body of literature has developed which shows the effect of natural disasters on businesses in terms of crisis prevention, response and recovery [8]. These researches are mainly concentrated in the US with some exceptions in Australia and the UK. Much of this research focussed on direct damage of property, and a smaller subset focussed on business interruption losses. However, it was challenging to derive a robust conclusion from these studies due to the complications in assumptions of modelling, methods of loss estimation and limitation of data.
Researchers have noted that the interdependency between different factors are not straight forward, for example, business interruption losses stem not only from the organisation itself but also from interdependencies between suppliers, producers, consumers, business owners and the relevant stakeholder environment [9,10]. These interdependencies between different stakeholders involve higher level of physical, economic and social complexities in relation to adaptation to risk which in other words exposes their damage potential in the form of vulner-ability [11]. The multitude of exposed forward looking factors are such that the vulnervulner-ability of an organisation is intertwined with its exposure to differential level of hazard, the organi-sation’s susceptibility to the probability and magnitude of flooding and the ability to respond to the crisis, or resilience, depending on interaction within and among different involved stakeholders.
Despite all the potentially influential factors, a major deciding influence is the presence or otherwise of a business owner’s sense of ‘responsibility’ to take appropriate action [12]. As Priest suggested in the context of flood insurance, the result of the perceived risk triangle is that human behaviour is vastly affected by knowledge and experience of flooding; awareness of risk; and expectation of flood management [13].
The level of acceptable risk depends on balancing business priorities one against the other to decide how much effort is appropriate to spend on hazard reduction. Businesses may not be inclined to take up actions to reduce environmental risk by investment of significant amount of money leading to financial stress.
2 OPERATIONAL FRAMEWORK
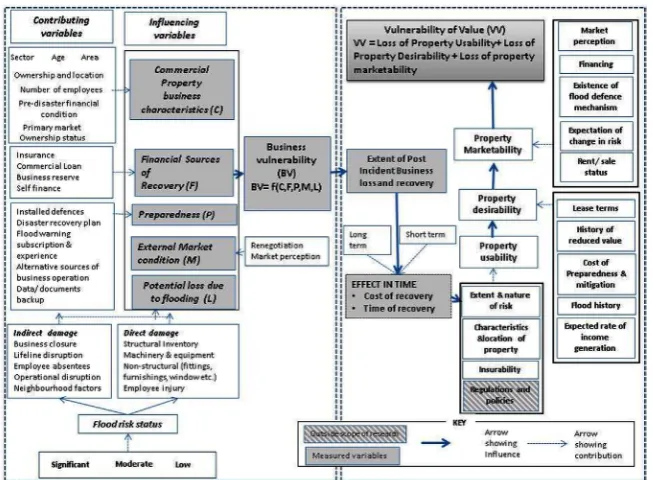
The method of analysis and understanding was guided by an operational framework, which was developed through a stepwise design from a generic conceptual model. The conceptual model was based on extensive review of the extant body of literature [15,16]. Knowledge gaps were identified and many conceptual challenges were integrated into the model to cap-ture fuller understanding of the issues related to valuation of commercial properties and how vulnerable the properties are to the changing status of the flood risk. The initial model was refined based on experts view and internal verification by the process of revisiting the research needs [16]. The process of operationalisation of the model to develop a measurement frame-work is a transition stage between theoretical model development and application of the static model for further systematic dynamic modelling to represent the real-world scenario. The measurement framework led way to development of questionnaires and further analysis of research. The operational framework was systematically developed and related in a coherent manner the various components of the conceptual model. Figure 1 depicts the operational framework designed and developed for the research indicating the relationship between vul-nerability of business and value of business property.
The framework identifies the underlying determinants of business vulnerability and their eventual effect on loss of income and marketability of commercial property. The potential impact on value is expected to be caused initially by environmental risk which depends upon the source of hazard, exposure of the elements at risk; and also by economic risk which affect the income generation and eventually by the loss of marketability of property in course of time. The framework presented here emphasises the relationship between causal factors and measurable factors and also points out the factors outside the scope of this research. The main motivation behind selection of vulnerability assessment was its appropriateness in identifying the forward looking variables without the need for extensive market transaction data for com-mercial properties and also to involve participation of relevant stakeholders [15]. The left-hand side of the framework indicates the level of business vulnerability of the property by incorpo-rating the five potential influential factors of loss due to flood occurrence, sources of recovery, characteristics of the property (physical and economic), level of preparedness against flooding and external market condition. These factors were identified from extensive literature review [16]. It is important for any business organisation to recommence the flow of income as soon as possible and that is dependent on how soon a business can reopen after having been affected by direct or indirect effects of flooding. Each of the factors for business vulnerability derives from finer components of the measurement variables, which are indicated as changing varia-bles and constant variavaria-bles in the figure. The speed at which business recovers from any environmental disaster and their vulnerability depends not only on the exposure towards level of hazard but also on the effectiveness of mitigation and preparedness taken before the disas-trous event. The business characteristics such as age, sector, ownership, size and primary market affect their rate of recovery and continuity of business. For example, large businesses have potentially higher chances of getting back to business sooner than smaller businesses [17]. This also indicates their access to financial sources (self-funding, loan or insurance), which enable them to recover quickly. Similarly, flood experience and higher level of prepar-edness can also help businesses to recover faster by limiting damage [18,19].
devaluation of property value. However, if the existence of hazard results in changing percep-tion of risk in the property market or increase operating cost for running business or incur extra cost or investment to reduce its effect on business, then that might have some devalua-tion effect on the property. To understand this, further marketability of property is divided into two aspects: property utility and property desirability. The three factors are interrelated in a way that the effect of disaster on utility of property results in lack of desirability in the market, which subsequently affects the marketability of the property [14].
The variables that are identified for measuring the above-mentioned influencing factors are illustrated with separate boxes, which feed into the respective factors. Finally, the expression of vulnerability of value can be indicated by the formula
Vulnerability of value (VV) = loss of property utility + loss of property desirability + loss of property marketability
which illustrates how cost of loss of income from utility of property and resultant desirability and marketability of property can affect the total exposed value (vulnerability of value) of property to environmental hazard.
3 METHOD OF DATA COLLECTION
3.1 Methodology selection
To operationalise the conceptualisation of the theory discussed in the previous section, a sur-vey approach was adopted. Based on the operational framework, data gathering instruments for the survey were developed. No definitive rules can be found in research methodology
[image:4.496.87.414.69.309.2]literature for when to use questionnaires in quantitative research. The decision depends on the type of information to be gathered and the availability of resources. Therefore, postal survey of questionnaires was determined to be appropriate and advantageous over other survey meth-ods such as face-to-face interviews and online surveys for this research. Options were provided to the respondents but very few cases they were opted. The suitability of postal questionnaires for this research was based on the following criteria:
•
The spatial distribution of data in different geographical locations and flood risk zones.•
The need to collect data from a large variety of respondents with diverse educational, so-cial and economic background.•
The methodology incorporated the participatory approach which enables participation of population from the selected area of survey to rank the potential factors affecting vulner-ability of property value. This process seemed appropriate and less time consuming if performed through postal questionnaire distribution.•
The questionnaire provides freedom from social or peer pressure so the respondents may answer honestly.•
The cost of data collection through questionnaire is relatively lower than other modes of survey like face-to-face interview or focus group participation.•
In order to reach to a larger sample of population affected by flooding with no specific data set specifying exact sample set flooded population, postal questionnaire was considered to be the most appropriate to incorporate a large sample in most economic manner.There are, however, certain limitations of using self-administered questionnaires, primar-ily that of low response rate [21]. Low response rate is a common feature in disaster-related studies; therefore, several measures were taken to enhance the response rate. Reminders for the questionnaire after 2 weeks were sent to increase the number of responses. A cover letter with all relevant information about the research project using official letterhead was attached to the questionnaire so that the respondents could make informed choice to respond to the questionnaire. The cover letter also included information about ethical issues and protection of the privacy of their responses.
3.2 Questionnaire themes for data collection
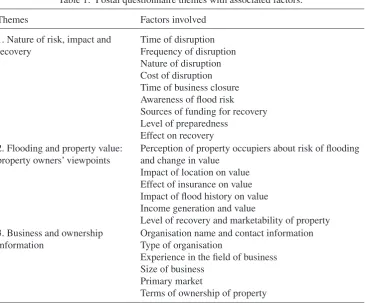
Postal questionnaires were designed to collect data from business property occupiers. The questionnaire was divided into three major themes, which feed into the measurement criteria illustrated in the operational framework (Fig. 1). Table 1 illustrates broadly the themes and the factors associated with the postal questionnaire.
3.3 Structure of the survey
A two-stage survey was performed involving distribution of postal questionnaires. Postal questionnaires were sent to 1830 respondents in all three flood risk zones (significant, mod-erate and low) delineated by the Environment Agency. The questionnaires were circulated paying attention that there will be a control population for comparative purposes.
return rates are generally low, and particularly where complex concepts are being tested that require novel insights, a large sample was selected in order to maximise the number of responses. Out of 1830, 126 were returned and, of these, 24 were considered unfit for use due to item non-response errors [22]. Therefore, 102 questionnaires were used for the analysis. Using descriptive statistics assisted in the analysis of the collected data.
4 SELECTION OF SURVEY LOCATION
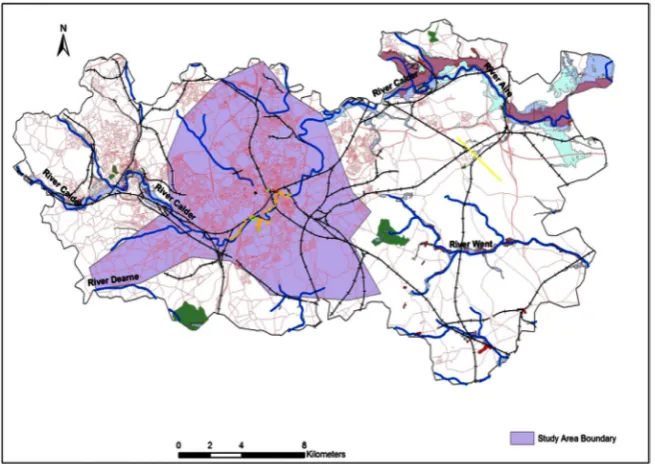
Wakefield, West Yorkshire, England was chosen as a suitable survey location for the research. Significant lengths of rivers (Calder, Aire and Dearne catchments) and watercourses exist in the study area, which had given rise to flood risk problems in the past. Different sources of flooding, for example, sediment accumulation in the Calder, surface water flooding, sewer flooding and flooding from mixed sources in the built-up area also exist [23].
According to the strategic flood risk assessment published by Wakefield City Council, central Wakefield and its surrounding areas are affected by a high risk of flooding. Therefore, five postcodes in central Wakefield (Fig. 2) were selected for the in-depth study.
There are about 794 business properties at high risk of flooding [23]. In the last few years, some community-level flood defences have been installed in this area; however, their condi-tions until very recently were ‘discontinuous’ and ‘mixed’.
Table 1: Postal questionnaire themes with associated factors.
Themes Factors involved
1. Nature of risk, impact and recovery
Time of disruption Frequency of disruption Nature of disruption Cost of disruption Time of business closure Awareness of flood risk Sources of funding for recovery Level of preparedness
Effect on recovery 2. Flooding and property value:
property owners’ viewpoints
Perception of property occupiers about risk of flooding and change in value
Impact of location on value Effect of insurance on value Impact of flood history on value Income generation and value
Level of recovery and marketability of property 3. Business and ownership
information
Organisation name and contact information Type of organisation
Experience in the field of business Size of business
Primary market
[image:6.496.67.433.82.385.2]Therefore, the expectation was to get comparative response from the selected sample pop-ulation with observable change in risk of flooding and its impact on businesses vulnerability. The questionnaires were used to measure perception of the absence or presence of factors identified previously through literature review.
5 CASE STUDY AND DISCUSSION
5.1 Demography of sample survey
The postal survey of the questionnaires generated answers from all sectors of the commercial property, and the respondent’s role and experience helped in achieving credibility in the research findings. While 24% of the total respondents chose to remain anonymous, 57% were directors and senior manager of companies, 14% were middle management staffs and 6% were operational and other staffs. The summary of respondent’s years of experience in the field of relevant business also shows the robustness of the data. The mean year of experience in the respective industries is around 16 years. The respondents are distributed in different business types. The highest number of respondents (33%) is involved in service sector fol-lowed by wholesale and retail (29%), other (20%) and manufacturing (15%). The response rate was lower than ideal for survey analysis but they are not unusual for disaster research. Literature stresses that a small response rate does not necessarily mean large response bias; neither does a large response always guarantee a representative sample [24]. Given that no incentive is provided to the respondents and the sizeable sample of over 100 responses is distributed among all flood risk zones (low risk – 51%, moderate risk – 12% and significant risk – 37%) may indicate that bias due to non-response is minimal.
[image:7.496.85.413.70.302.2]5.2 Response from property occupiers
Out of the total responses from the commercial property occupiers, 24% were flood affected and 76% were not affected by direct impact of flooding. Among those who were flooded, 42% indicated that they were flooded only once, 33% were flooded twice, 17% flooded three times and 8% were flooded more than thrice in the last 15 years. The main source of flooding in the area indicated by respondents was rain (35%) followed by mixed sources (33%), over-flowing drains and roads (15%), river (12%) and other sources (5%). Therefore, the effect of surface water flooding was given more emphasis by the respondents. About 46% of the total respondents affected by flooding suffered from single source of flooding while the rest suf-fered from two or more sources of flooding (27% each) draws our attention to the fact that multiple sources of flooding introduces varied hazard source therefore making preparedness measures particularly difficult to adopt.
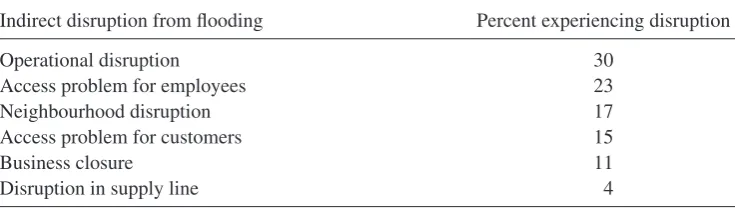
Construction period of the properties who responded to the question in the survey site were pre-1920s (23%), 9% of the buildings were built between 1946 and 1979, 18% were built from 1980 onwards. The concentration of properties constructed in pre-1920s era in the sam-ple survey may reflect the city centre location of the survey. However, about 50% of the respondents were unaware of the construction period of their occupied properties. The terms of occupancy was evenly balanced between rented and owned properties (51% and 49% of respondents). The type of direct and indirect flood damage experienced by the flood affected respondents are summarised in Table 2.
The responses from the flood affected respondents show that in case of indirect damage, operational disruption was most frequently experienced followed by access problem to employees as well as neighbourhood disruption issues. Comparing the results of this study
Table 2: Indirect and direct damage and disruption (as % of flood affected respondents). Indirect disruption from flooding Percent experiencing disruption
Operational disruption 30
Access problem for employees 23
Neighbourhood disruption 17
Access problem for customers 15
Business closure 11
Disruption in supply line 4
Direct disruption from flooding Percent experiencing disruption
Damage inside building (windows, doors, furnishings, fittings)
28
Physical damage of machinery and equipment 19
Physical damage outside of building 19
Other damages 13
Physical damage to stocks 12
[image:8.496.64.432.406.511.2]with a recent similar study on SME’s [25] showed some contrasting results indicating travel difficulties for customers to be of highest inconvenience while in this study access problem for customers came much lower in order. The neighbourhood problems are evident from the responses of flood affected property occupiers such as refurbishment and repair works; obstructions in access due to disruption in neighbouring properties can have higher (17%) impact on the recovery and business continuity process. When direct effect of flooding was analysed, damage caused inside the building (28%) emerged as to have the most frequent effect followed by physical damage of machinery (19%) and structural damage of building (19%). The results revealed that indirect impact of flooding rather than direct impacts have more frequent effect on flood affected businesses.
When respondents were asked to rank factors that cost them highest amount of money and time during recovery period, property clean-up cost and loss of sales were among the highest ranked items (2.56 and 2.28 on a scale of 1–5) for incurring cost, and recovery from non-struc-tural damage and property clean-up (ranked 2.80 and 2.6 out of 5) ranked highest in terms of longest time taken to recover from disruption. These problems were, however, generalised as short-term issues and were resolved soon after the flood event. The length of business closure was mostly between 1 and 7 days with one specific exception of 60-day period closure.
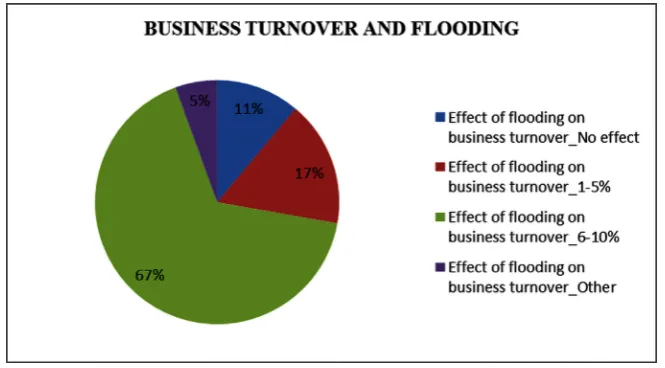
The survey also identified that in terms of effect on business operation, 47% of flood affected respondents reported that their business was slightly affected, 26% reported of seri-ous disruption and 16% indicated business closure. Although the percentage of business closure of properties may seem pretty high (16%) but as described earlier, the total term of closure was short and the effect of this short-term closure lingered on to affect their annual average turnover illustrated in Fig. 3.
The impact of operational disruption on the total annual turnover of business (67% of flood affected respondents accounted between 6 and 10% of annual business turnover); 17% of the respondents indicated between 1 and 5% effect on annual turnover; only 11% indicated almost no effect on their business operation. Furthermore, responses on questions of aware-ness of risk of flooding in their respective properties revealed that only a mere 18% of the
[image:9.496.82.415.440.624.2]flood affected respondents were fully aware of the risk of flooding in their properties when they first moved into the property, while 55% had no knowledge and 27% had some primary knowledge about their potential flood risk.
Results from the level of preparedness responses revealed that 23% of the flood affected respondents took preparatory measures before the specified event, 37% introduced some pre-paratory measures after the flood event and 40% took no measures at all even after suffering from the flood event. This reflects the level of susceptibility of the affected population towards risk of future flooding as well as their negligent attitude towards existing risk.
5.3 Perception of risk and property value
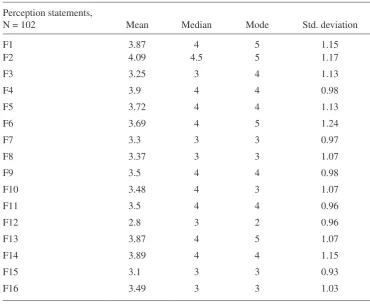
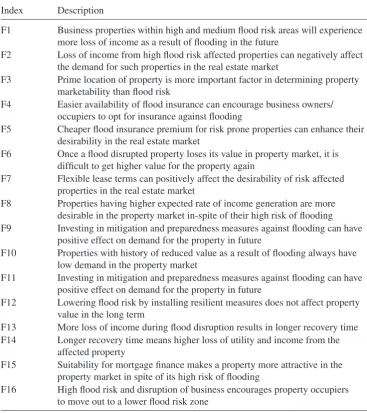
The perception of all commercial property respondents towards risk of flooding and its sub-sequent impact on property value was revealed from their level of agreement to a list of statements provided in the questionnaire. Table 3 provides a detailed view of their under-standing of risk perception and its interrelationship with property value of all flood plain respondents through different descriptive statistical analysis of data. The scale of agreement ranged from 1 to 5 where 1 indicated strong disagreement, 3 being neutral and 5 of strong agreement. Table 4 shows the corresponding index for the perception statements.
Table 3: Respondents’ risk perception.
Perception statements,
N = 102 Mean Median Mode Std. deviation
F1 3.87 4 5 1.15
F2 4.09 4.5 5 1.17
F3 3.25 3 4 1.13
F4 3.9 4 4 0.98
F5 3.72 4 4 1.13
F6 3.69 4 5 1.24
F7 3.3 3 3 0.97
F8 3.37 3 3 1.07
F9 3.5 4 4 0.98
F10 3.48 4 3 1.07
F11 3.5 4 4 0.96
F12 2.8 3 2 0.96
F13 3.87 4 5 1.07
F14 3.89 4 4 1.15
F15 3.1 3 3 0.93
[image:10.496.61.432.325.629.2]Table 4: Statement index.
Index Description
F1 Business properties within high and medium flood risk areas will experience more loss of income as a result of flooding in the future
F2 Loss of income from high flood risk affected properties can negatively affect the demand for such properties in the real estate market
F3 Prime location of property is more important factor in determining property marketability than flood risk
F4 Easier availability of flood insurance can encourage business owners/ occupiers to opt for insurance against flooding
F5 Cheaper flood insurance premium for risk prone properties can enhance their desirability in the real estate market
F6 Once a flood disrupted property loses its value in property market, it is difficult to get higher value for the property again
F7 Flexible lease terms can positively affect the desirability of risk affected properties in the real estate market
F8 Properties having higher expected rate of income generation are more desirable in the property market in-spite of their high risk of flooding F9 Investing in mitigation and preparedness measures against flooding can have
positive effect on demand for the property in future
F10 Properties with history of reduced value as a result of flooding always have low demand in the property market
F11 Investing in mitigation and preparedness measures against flooding can have positive effect on demand for the property in future
F12 Lowering flood risk by installing resilient measures does not affect property value in the long term
F13 More loss of income during flood disruption results in longer recovery time F14 Longer recovery time means higher loss of utility and income from the
affected property
F15 Suitability for mortgage finance makes a property more attractive in the property market in spite of its high risk of flooding
F16 High flood risk and disruption of business encourages property occupiers to move out to a lower flood risk zone
[image:11.496.63.431.83.497.2]This can also be noticed that median and mode values are generally the same as to mean ratings indicating good fit for data.
This is also observed that the factors like ‘easy’ and ‘cheap’ insurance (F4 and F5) availa-bility and ‘longer recovery time resulting in higher loss of property utility’ (F13 and F14) have also gained higher levels of agreement. This can also be observed that respondents are completely neutral about factors like flexible lease terms (F7), higher expected rate of income generation (F8) and suitability of mortgage finance (F15) having impact on property value. Respondents showed neutralities towards installation of resilient measures and high flood risk and desirability to move out of the business properties as a result of flood risk. This is most likely a reflection of the dis-interest observed among business property occupiers in adopting to flood resilient measures.
It is evident from the survey result that respondents are not so concerned about direct physical damage; however, it is the loss of income from indirect effects of flooding that they are worried about. Also, emphasis on easier and cheaper availability of insurance implies that this might encourage people at risk of flooding to take up more insurance cover and enhance resilience. With increased level of resilience, it is evident that the rate of recovery will be faster resulting in reduced level of loss of income and property utility. In contrast, the lower level of agreement (average 2.8) for resilience measure and how it does not affect property value in the long run gives an impression that the understanding of residual risk and how to cope against it is still lacking among the commercial property occupants.
CONCLUSION
The paper presents survey-based evidence of property occupiers’ experience, views and per-ception on impacts of flooding, level of risk recovery and impact on property value.
The concept was based on analysing the level of vulnerability of commercial properties and understanding subsequently its effect on value by analysing perception of occupiers. It is a comprehensive descriptive analysis, which was obtained through collection of data by using postal questionnaire from occupiers of property in different levels of flood risk. The survey confirmed that flood risk is seen as important but not given priority as other factors that affect property value. Occupiers are more concerned about disruption of income, which is most likely to be caused by impact on property utility. Utility is, however, related to property desir-ability and marketdesir-ability in the long run, which can effectively have impact on value of property.
The analysis of vulnerability of value is a novel research and has potential to be developed further. The theoretical base for vulnerability has been strongly grounded in disaster research and it is necessary to attain such robustness in valuation research as well. This study is pio-neering in validating the theoretical base through practical application of survey research. This approach can be useful for all stakeholders related to the business property sector; there-fore, participatory approach among relevant stakeholders’ understanding of existing flood vulnerability to help them in informed decision making and enhancing resilience is recom-mended by this research.
REFERENCES
[1] Bankoff, G., Frerks, G. & Hilhorst, D., eds., Mapping Vulnerability: Disaster,
Develop-ment and People, Earthscan: London, 2004.
[2] Mileti, D., Designing Future Disasters: An Assessment and Bolder Course for the
[3] Adair, A., Hutchison, N., MacGregor, B.D., McGreal, S. & Nanthakumaran, N., An analysis of valuation variation in UK commercial property market. Journal
of Property Valuation and Investment, 14(5), pp. 34–47, 1996. doi: http://dx.doi. org/10.1108/14635789610154271
[4] Office of National Statistics, United Kingdom National Accounts: The Blue Book. Office of National Statistics: Cardiff, 2012.
[5] Paul Mitchell Real Estate Consultancy, Property data Report 2012, Paul Mitchell Real Estate Consultancy: London, 2012.
[6] RICS, A Clear Guide to Flooding for Property Owners, RICS: London, 2012.
[7] RIBA, Flooding. Sustainability and climate change 30.12.2012]; Available from: http:// www.architecture.com/FindOutAbout/Sustainabilityandclimatechange/Flooding/ FloodingExplained.aspx.
[8] Powell, F. & Hardin, A., Business Recovery and the Rebuilding of Commercial prop-erty. Shaken Up: Proceedings of a Workshop on Recovery Following the Gisborne
Earthquake, Opus International Consultants: Gisborne, 2009.
[9] Rose, A. & Lim, D., Business interruption losses from natural hazards: conceptual and methodological issues in the case of the Northridge earthquake. Environmental
Hazards, 4(1), pp. 1–14, 2002. doi: http://dx.doi.org/10.3763/ehaz.2002.0401
[10] Tierney, K.J., Impacts of recent U.S. disasters on businesses: the 1993 midwest floods and the 1994 Northridge Earthquake, Disaster Research Centre, University of Delaware: Newark, DE, 1995.
[11] Bhattacharya, N., Lamond, J., Proverbs, D., Hammond, F. & Searle, D., A framework for participatory assessment of vulnerability of commercial property values to flooding in the UK, Flood Recovery Innovation and Response (FRIAR) III, eds. D.G. Proverbs, S. Mambretti, C.A. Brebbia, D. Wrachien de, WIT Press: Dubrovnik, Croatia, pp. 243– 250, 2012. doi: http://dx.doi.org/10.2495/friar120201
[12] Treby, E.J., Clark, M.J. & Priest, S.J., Confronting flood risk: Implications for insur-ance and risk transfer. Journal of Environmental Management, 81(4), pp. 351–359, 2006. doi: http://dx.doi.org/10.1016/j.jenvman.2005.11.010
[13] Priest, S.J., Clark, M.J. & Treby, E.J., Flood insurance: the challenge of the uninsured.
Area, 37(3), pp. 295–302, 2005. doi: http://dx.doi.org/10.1111/j.1475-4762.2005.00633.x
[14] Wilson, A., Emerging approaches to impaired property values. Appraisal Journal,
64(2), pp. 155–170, 1996.
[15] Bhattacharya, N., Lamond, J. & Proverbs, D., Flood vulnerability and hazard adjust-ment for UK commercial sector. International Conference on Disaster Resilience, Srilanka, 2011.
[16] Bhattacharya, N., Lamond, J., Proverbs, D. & Hammond, F., Development of concep-tual framework for understanding vulnerability of commercial property values towards flooding. International Journal of Disaster Resilience in the Built Environment, 4(3), pp. 334–351, 2013 (forthcoming). doi: http://dx.doi.org/10.1108/ijdrbe-08-2012-0024
[17] Wedawatta, G., Ingirige, B. & Proverbs, D., Adaptation to flood risk: the case of busi-nesses in the UK. International Conference on Building Resilience, Dambulla, Srilanka, 2011.
[19] Rose, C., Proverbs, D.G., Booth, C. & Manktelow, K.I., Three times is enemy action - flood experience and flood perception, Flood Recovery, Innovation and Response III, 2012.
[20] Tim, R. & Richard, T., Valuing contaminated land and property: theory and practice.
Journal of Property Valuation and Investment, 14(4), pp. 6–17, 1996. doi: http://dx.doi. org/10.1108/14635789610153434
[21] Robson, C., Real World Research: A Resource for Social Scientists and Practitioner
Researchers, 2 edn, Blackwell Publishers: Oxford, 2002.
[22] Sutrisna, M., Developing a Knowledge Based System for the Valuation of Variations in
Civil Engineering Works, University of Wolverhampton: Wolverhampton, 2004. [23] JBA Consultant, Strategic Flood Risk Assessment, City of Wakefield Metropolitan
District Council: City of Wakefield, 2009.
[24] Lamond, J.E., The Impact of Flooding on the Value of Residential Property in the UK, University of Wolverhampton: Wolverhampton, 2008.
[25] Ingirige, B., Proverbs, D. & Wedawatta, G., Impact of Flooding on SME’s and Their