Abstract—Capacitive type humidity sensor was fabricated on CMOS technology by lithography process base on silicon p-substrate with Nitride passivation layer and designed on interdigitage electrodes (IDEs). This paper proposed the influence of various stock graphene oxide (GO) concentrations on humidity sensor responses behavior by drop coating method. The Raman spectroscopy is demonstrated for GO presence and scanning electron microscope (SEM) is exhibited the GO surface morphologies. The capacitance value is examined under different relative humidity (RH) ranges at 0.30% to 80% RH. The IDEs capacitive humidity sensor shows linear, polynomial and exponential responses behaviors for high, medium and low stock GO concentrations, respectively. The high stock GO concentration is significantly improved all dominant humidity sensor properties, especially the sensitivity at low RH (10%, 20%, 30% and 40% RH) which is improved up to 6683.65%, 2097.27%, 1984.91% and 1465.93%, respectively. Furthermore, it shows linear responses behavior by 0.991 for coefficient of determination of wide RH. Moreover, the IDEs capacitive humidity sensors are comparatively examined response/recovery times, hysteresis as well as repeatability. Finally, high stock GO concentration of humidity sensor is exhibited under various temperature operating ranges (20-50 degree Celsius). It clearly demonstrates for alternative applicability to use on humidity sensor applications.
Index Terms— GO concentration, interdigitage electrodes, CMOS technology, high sensitivity
Manuscript received December 03, 2018; revised March 24, 2019. This work was supported in part by the Electronics research center of King Mongkut’s Institute of Technology Ladkrabang, Bangkok Thailand.
S. Pongampai is with the Electronics Engineering Department, Faculty of Engineering, King Mongkut’s Institute of Technology Ladkrabang, Bangkok, Thailand. (e-mail: [email protected]).
P. Pengpad is with the Microelectronics research and development Department, Thai Microelectronics Center, Chachoengsao, Thailand (e-mail: [email protected]).
R. Meananeatra is with the Microelectronics research and development Department, Thai Microelectronics Center, Chachoengsao, Thailand (e-mail: [email protected]).
W. Chaisriratanakul is with the Microelectronics research and development Department, Thai Microelectronics Center, Chachoengsao, Thailand (e-mail: [email protected]).
W. Thitirungraung is with the Electronics Engineering Department, Faculty of Engineering, King Mongkut’s Institute of Technology Ladkrabang, Bangkok, Thailand. (e-mail: [email protected]).
R. Muanghlua is with the Electronics Engineering Department, Faculty of Engineering, King Mongkut’s Institute of Technology Ladkrabang, Bangkok, Thailand. (e-mail: [email protected]).
I. INTRODUCTION
umidity control is dominant importance on various field applications such as semiconductor, meteorology, medical equipment, biotechnology, smart home or comfortable life as well as agriculture [1-3]. Humidity measurement is mostly used in term of relative humidity (RH) which is defined as a ratio of moist quantity of air to saturate humidity level that the air can hold at a same given temperature and pressure [2]. There are various types of humidity sensor which them have been developed over a year [4]. Generally, humidity sensor is classified into two major categories base on electrical properties. It is resistive and capacitive type humidity sensors [5]. These humidity sensors each type differently shows advantageous characterization, especially capacitive type humidity sensor. It dominantly responds on low RH range (10-40%RH) as well as rapidly respond and short recovery times than resistive type of humidity sensor [2]. Furthermore, the capacitive type humidity sensor shows linear responses and precise control better than resistive type humidity sensor [6, 7].
Graphene (GN) is two dimensional monolayer of sp2 -bonded which including the carbon on single layer by hexagonal lattice of carbon atoms arrangement [8]. It uniquely exhibits the mechanical [9], thermal [10] and electrical properties [11]. Graphene oxide (GO) base on sensing layer is obtained by treating graphite with strong oxidizer. It exhibits more hydrophilic functional groups, such as carboxyl, epoxy and hydroxyl groups at the surface. It enables water molecules (H2O) diffusion (in and out) of
GO layer during humidity changes [12]. Although, GO has been discovered over century [13] and it has been developed for sensing layer of humidity sensor applications afterwards. Currently, GO still highly attended and develop for high sensitivity sensing layer due to it inexpensive material and facile preparation.
This paper proposed the influence of various stock GO concentrations on IDEs capacitive humidity sensor responses behavior, including low stock GO concentration, medium stock GO concentration, and high stock GO concentration, respectively. Each stock GO concentration shows different responses behaviors. Moreover, the high stock GO concentration exhibits advanced humidity sensor performances, especially high sensitivity and high linear responses behavior on wide ranges RH (0.30%-80% RH). Finally, the humidity sensor properties are comparatively
Influence of Graphene Oxide Concentration on
IDEs Capacitive Humidity Sensor Response
Behavior
SatanaPongampai, PuttaponPengpad, RattanawanMeananeatra, WoraphanChaisriratanakul, WisutThitirungraung and RangsonMuanghlua, Member, IAENG
examined and presented in this paper. II. EXPERIMENTAL
The IDEs capacitive humidity sensor was fabricated on CMOS technology. It was designed on IDEs by lithography process and deposited nitride onto IDEs for passivation layer. The simulation diagram of IDEs capacitive humidity sensor fabrication process is shown in Fig. 1
Generally, the IDEs capacitive humidity sensor capacitance is obtained as follow equation
Cnoslt/d (1)
where n is number of IDEs, o and s are free space
permittivity and RH dielectric constant, respectively. l is length of IDEs, d is interspacing of IDEs. The dominant IDEs humidity sensor capacitance is depended on sensing material or sensing film which is absorbed and desorbed water vapor (H2O) in the ambient environment. The IDEs
capacitive humidity sensor dimension is 10 mm by 15 mm consist of 15 metal finger electrodes and distance between two IDEs is 30 m. The finger IDEs length (l), width, and thickness (d) are 2.3 mm, 70 m, and 1000 angstrom, respectively.
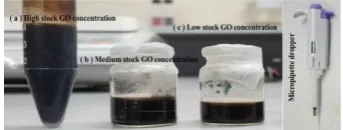
The stock GO concentration (2 mg/ml) was synthesized via oxidative treatment of ordinary graphite by the Hummer’s method [14]. The GO was exfoliated to GO fiber or sheet by ultrasonicating graphite oxide suspension for 30 minutes. Afterward, GO 2 mg/ml concentration was diluted with DI water (1:5 and 1:7) and subsequently performed sonication into water for 1h. The stock GO conditions and micropipette dropper are shown in Fig. 2.
Afterward, the IDTs humidity sensor was performed oxygen plasma treatment for hydroxyl group creation. Then, aminosilanes ((3-Aminopropyl) triethoxysilane, APTES) solution was used for adhesive layer between GO and IDEs. It was deposited by soaking method subsequently dried
under 45 degree Celsius, 30 minutes. Finally, micropipette was used to drop GO and drying under 60 degree Celsius for 1h. The experimental diagram for sensing layer treatment and material preparation are illustrated in Fig. 3.
The IDEs capacitive humidity sensors were comparatively examined on RH ranges 0.30% to 80% RH including IDEs capacitive humidity sensor with high stock concentration, medium stock GO concentration and low stock GO concentration, respectively. Furthermore, the IDEs capacitive humidity sensor was investigated and exhibited sensitivity, response/recovery times, hysteresis, repeatability as well as influence of temperature. The experimental diagram for humidity investigation is shown in Fig. 4
The IDEs capacitive humidity sensor investigation system is controlled by A LabVIEW (National Instruments) programing via computer. Humidifier and pressurized air are generated wet and dry air conditions, respectively. The RH condition is controlled by standard humidity sensor (785-HIH9120-021-001S, Honeywell Humidlcon). The Agilent B1500A measurement tooling is used to monitor and collect capacitance values at frequency 10 kHz.
III. RESULT AND DISCUSSION
[image:2.595.343.529.107.200.2]The Raman spectroscopy analysis was exhibited the GO presence. The GO Raman spectra shows D and G band peaks indication [15], respectively. The Raman spectra peaks shows in Fig. 5.
Fig. 1. Simulation diagram of IDEs capacitive humidity sensor fabrication process
Fig. 2. Visual inspection of stock GO concentration (a) high stock GO concentration (b) medium stock GO concentration (c) low stock GO concentration and micropipette dropper
Fig. 3. Experimental diagram for sensing layer treatment and material preparation
[image:2.595.78.259.156.319.2] [image:2.595.338.533.356.464.2] [image:2.595.87.259.625.690.2]Fig. 6 shows scanning electrons microscope (SEM) and high power scope characterization. It exhibited the GO surface morphology. The high stock GO concentration shows GO fibers or functional groups more than medium and low GO concentrations, respectively.
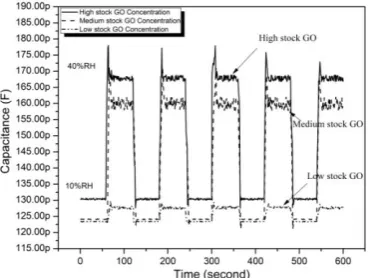
Fig. 7 shows the IDEs capacitive humidity sensor responses comparison of high, medium, and low stock GO concentrations. The IDEs capacitive humidity sensor of high stock GO concentration shown ultrahigh sensitivity (approximate to 3057.94% at 10% to 40% RH). It obviously demonstrates that high stock GO concentration can be improved response behavior and sensitivity at low RH.
Regarding to response behavior of high stock GO concentration shows ultrahigh sensitivity than the others stock GO concentrations because the strong hydrophilic functional groups at the surface and the edge of GO. Fig. 8 shows hydrophilic functional groups and schematic of humidity sensing on GO fibers sensing. The strong hydrophilic functional groups easily enhanced the water molecules absorption and desorption in GO fiber.
For low and high RH, the available process for electrical relations are first and second physisorbed water layers, respectively. At low RH, the protons hopped transfer between adjacent hydroxyl groups from double hydrogen bonding. At high RH, the electrical conductivity changing due to hydronium ions (H3O+) produced via single hydrogen
bonding on the hydroxyl groups as the Grotthuss chain reaction (+++) which led to quite high sensitivity. The sensitivity of IDEs capacitive humidity sensor is obtained as follow
SensitivityC40C104010 (2)
where C40 and C10 are capacitance values at high and low
RH, respectively. The sensitivity of high, medium, and low stock GO concentrations show 1.248, 1.185, and 0.097 pF/%RH, respectively.
Fig. 9 shows IDEs capacitive humidity sensors response characterization of high, medium, and low stock GO concentrations. The high stock GO concentration shows linear response behavior by 0.991 for coefficient of determination which suitable of humidity sensor characterization. It demonstrates that high GO concentration can be lifted sensitivity responses at low RH (10-40 %RH) as shown in table I.
Fig. 10 exhibits IDEs capacitive humidity sensor response and recovery time comparison of high, medium, and low stock GO concentrations. The all IDEs capacitive humidity sensors show a little response (10sec) and recovery (7sec) times which suitable of humidity sensor.
Fig. 5. Raman spectroscopy of graphene oxide on IDEs capacitive humidity sensor
Fig. 6. Visualization and SEM characterization of stock GO, (a) high concentration, (b) medium concentration, and (c) low concentration
Fig. 7. IDEs capacitive humidity sensor responses comparison of high, medium, and low stock GO concentrations
Fig. 8. Hydrophilic functional groups of graphene oxide and schematic of humidity sensing at GO fiber
Fig. 9. IDEs capacitive humidity sensors response characterization of high, medium, and low stock GO concentrations
Table I. IDEs capacitive humidity sensor sensitivity comparison
RH
High GO Sense (pF/%RH)
Medium Go Sense (pF/%RH)
Low GO Sense (pF/%RH)
Improved (%)
10%RH 0.72 0.09 0.01 6683.65
20%RH 1.54 0.36 0.07 2097.27
30%RH 40%RH
2.92 4.44
1.35 3.65
0.15 0.30
Fig. 11 shows IDEs capacitive humidity sensors hysteresis comparison of high, medium, and low stock GO concentrations. The hysteresis was examined at 10% to 40% RH and continuously examined 40% to 10% RH. The hysteresis is obtained as follow
HysteresisCmaCmdCmaxCmin (3)
where Cma and Cmd are capacitance values of center line best
fit through adsorption and desorption lines, respectively. Cmax and Cmin are maximum and minimum capacitance value
at intercept of absorption and desorption lines, respectively.
The IDEs capacitive humidity sensor hysteresis of high, medium, and low stock GO concentrations show 1.1%, 8.8%, and 2.2%, respectively. Fig. 12 exhibits IDEs capacitive humidity sensor repeatability. It is examined between humidity ranges 10% to 40% RH for 5 cycles.
The IDEs capacitive humidity sensor repeatability clearly demonstrates that it not significantly changes all 5 cycles of IDEs humidity sensor examination.
Fig. 13 shows effect of temperature on IDEs capacitive humidity sensor of high stock GO concentration. It not significantly changes on temperature operating ranges which suitable of humidity sensor characterization.
IV. CONCLUSION
The influence of stock graphene oxide (GO) concentration on humidity sensor responses behavior by drop coating method is obviously demonstrated for IDEs capacitive humidity sensor improvement. The stock GO concentrations on IDEs capacitive humidity sensor shown various response behaviors (linear, polynomial, and exponential) which it can be used with specific RH ranges detection for humidity sensor. Especially, high stock GO concentration clearly exhibited for suitable wide RH detection ranges (0.30%-80% RH). It shows high sensitivity and linear responses by 0.991 for coefficient of determination. Moreover, IDEs capacitive humidity sensor shows a little hysteresis (1.1%), fast response (10sec) and recovery (7sec) times. Furthermore, the IDEs capacitive humidity sensor repeatability and temperature dependence are not significantly changed. It clearly demonstrates for alternative sensing material of humidity sensor applications.
ACKNOWLEDGMENT
This work was supported by Thai Microelectronics center (TMEC) and Western Digital Thailand (WD). We also would like to thank TMEC and WD cleanroom process staff for kindly providing the measurement facilities.
REFERENCES
[1] Chen, Z. and C. Lu, Humidity Sensors: A Review of Materials and Mechanisms. Vol. 3. 2005.
[2] Farahani, H., R. Wagiran, and N.M. Hamidon, Humidity Sensors Principle, Mechanism, and Fabrication Technologies: A Comprehensive Review. Sensors, 2014. 14(5).
[3] Lee, C.W., et al., Capacitive Humidity Sensor Tag Smart Refrigerator System using the Capacitive to Voltage Converter (CVC). Vol. 36. 2011.
[4] Lee, C.-Y. and G.-B. Lee, Humidity Sensors: A Review. Vol. 3. 2005. 1-15.
Fig. 10. IDEs capacitive humidity sensor response/recovery times comparison of high, medium, and low stock GO concentrations
[image:4.595.82.268.54.195.2]Fig. 11. IDEs capacitive humidity sensors hysteresis comparison of high, medium, and low stock GO concentrations
[image:4.595.337.531.104.243.2]Fig. 12. IDEs capacitive humidity sensor repeatability comparison of high, medium, and low stock GO concentrations
[image:4.595.86.280.359.497.2] [image:4.595.84.272.603.742.2][5] Fenner, R. and E. Zdankiewicz, Micromachined water vapor sensors: a review of sensing technologies. IEEE Sensors Journal, 2001. 1(4): p. 309-317.
[6] Nenov, T. and Z. Nenova, Multi-objective optimization of the parameters of TiO2-based ceramic humidity sensors. Ceramics International, 2013. 39(4): p. 4465-4473.
[7] Zhang, D., et al., Humidity-sensing properties of hierarchical ZnO/MWCNTs/ZnO nanocomposite film sensor based on electrostatic layer-by-layer self-assembly. Vol. 27. 2015.
[8] Perrozzi, F., S. Prezioso, and L. Ottaviano, Graphene oxide: from fundamentals to applications. Journal of Physics: Condensed Matter, 2015. 27(1): p. 013002.
[9] Novoselov, K.S., et al., Two-dimensional atomic crystals. Proceedings of the National Academy of Sciences of the United States of America, 2005. 102(30): p. 10451-10453.
[10] Balandin, A.A., et al., Superior Thermal Conductivity of Single-Layer Graphene. Nano Letters, 2008. 8(3): p. 902-907.
[11] Novoselov, K.S., et al., Electric Field Effect in Atomically Thin Carbon Films. Science, 2004. 306(5696): p. 666.
[12] Schedin, F., et al., Detection of individual gas molecules adsorbed on graphene. Nature Materials, 2007. 6: p. 652.
[13] Dimiev, A.M., L.B. Alemany, and J.M. Tour, Graphene Oxide. Origin of Acidity, Its Instability in Water, and a New Dynamic Structural Model. ACS Nano, 2013. 7(1): p. 576-588.
[14] Hummers, W.S. and R.E. Offeman, Preparation of Graphitic Oxide. Journal of the American Chemical Society, 1958. 80(6): p. 1339-1339.
[15] Ferrari, A.C., Raman spectroscopy of graphene and graphite: Disorder, electron–phonon coupling, doping and nonadiabatic effects. Solid State Communications, 2007. 143(1): p. 47-57.
REVISED DESCRIPTION
1) Date of modification: 8 May 2019 2) Brief description of the changes