Special
Article
Burton P. Drayer 1
Received June 6. 1981; accepted after revision July 14, 1981.
This work was supported by a grant-in-aid from the American Heart Association with funds con-tributed by the North Carolina Heart Association. 'Department of Radiology, Duke University Medical Center, Durham, NC 27710.
AJNR 2:495-510, November/December 1981 0195-6108/81/0206-0495 $00.00 © American Roentgen Ray Society
Functional
Applications of
CT of
the Central
Nervous
System
495
Although CT has developed as a morphologic technique, its anatomic specificity may be used to map physiologic events. Using intravenously infused iodinated contrast media, CT offers unique analysis of the integrity of the blood-brain barrier. If the barrier is not disrupted, the same iodinated indicators may be used to estimate vascular transit time and cerebral blood volume. Nonradioactive xenon, a freely diffusible indicator, enhances the brain substance and may be used to evaluate both cerebral blood flow and tissue integrity in well defined anatomic locales. However, these functional deter-minations have distinct limitations. Future use of CT, including providing more sophis -ticated tissue characterization, indicator development, and advances in scanner tech-nology, are discussed.
Transmission computed tomography (CT) was initially developed as a nonin-vasive morphologic technique from which functional information could sometimes
be indirectly surmised. However, the contrast sensitivity, spatial resolution, and temporal resolution provided by present scanners makes CT a unique imaging method for characterizing, in vivo, physiologic or metabolic events with anatomic
specificity.
Although recent interest in these applications has been keen, we must remain cognizant of various pitfalls when drawing physiologic conclusions from CT-derived information. Some key problems involve the quantitative accuracy of the derived CT numbers, the need for multilevel scanning, signal to radiation dose compromises, and the requirement for contrast media that truly reflect metabolic
events while providing sufficient enhancement at nontoxic doses.
This review attempts to summarize the developments that have occurred over
the past few years in functional CT imaging of the brain. The present limitations of these new techniques are brought out and suggestions are offered that would enhance the application of CT to functional assessment of the central nervous system.
Applications of Dynamic CT
Blood-Brain Barrier
The initial and most widely used physiologic application of CT scanning
involves an analysis of alterations in the blood-brain barrier. The normal barrier is essentially impermeable to intravenously infused iodinated contrast media. With certain pathologic processes (e.g., neoplasm, abscess, infarctions), the barrier is damaged causing leakage of iodine with resultant abnormal "contrast enhancement" on CT.
The normal blood-brain barrier. Current concepts concerning the barrier [1-4]
496 DRAYER AJNR:2, November/December 1981
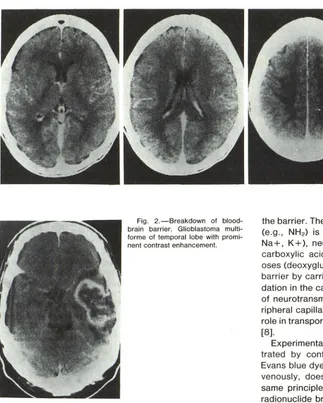
Fig. 2.-Breakdown of blood-brain barrier. Glioblastoma multi-forme of temporal lobe with promi-nent contrast enhancement.
separating the endothelial cells and tight junctions from the extracellular brain space and glial foot processes. Move-ment across the normal barrier occurs by either lipid-me-diated transport of lipid-soluble compounds or carrier-me-diated transport of water-soluble substances [5]. Specific regions of the brain, the circumventricular organs (area postrema, median eminence of the hypothalamus, organ vasculosum of the lamina terminalis, subfornical organ, pin-eal, and the lines of attachment of the choroid plexus), possess no such endothelial barrier and presumably provide information to the brain concerning the chemical environ-ment of the rest of the body.
Substances cross the barrier with variable ease depen-dent predominantly on lipid solubility, but also on polarity, molecular size, and enzymatic degradation. Water and gases (C02, O2, Xe, Kr, volatile anesthetics) rapidly diffuse
across the intact barrier. Since diffusion across the barrier is directly correlated to lipid solubility, highly lipid-soluble substances (ethanol, iodoantipyrine, thiopental) readily pass
Fig. 1.-Normal brain with iodinated contrast medium (nondiffusible indica-tor). Prominent enhancement in gray matter capillary bed highlights distinc-tion between gray and white matter. Gray matter has about four times the capillary density and perfusion as white matter.
the barrier. The passage of nonionized lipophilic substances (e.g., NH2) is pH dependent. Simple charged ions (e.g., Na+, K+), neutral, basic, and acidic amino acids, mono-carboxylic acids, amines, purines, nucleosides, and hex-oses (deoxyglucose, d-glucose but not I-glucose) cross the barrier by carrier-mediated transport [5]. Enzymatic degra-dation in the capillary endothelium may retard the transport of neurotransmitter precursors [1, 6-8]. In contrast to pe-ripheral capillaries, pinocytosis normally plays only a minor role in transport but may be important in the diseased barrier [8].
Experimentally, the integrity of the barrier may be illus-trated by confirming that a nondiffusible indicator (e.g., Evans blue dye, horseradish peroxidase) [2], injected intra-venously, does not cross the barrier into the brain. This same prinCiple, when applied in vivo, forms the basis for radionuclide brain scanning using nondiffusible technetium or gallium derivatives and CT scanning using the nondiffu-sible iodinated contrast media.
If the barrier is intact, a focal accumulation of nondiffusible indicator will not be found in the brain substance, although contrast enhancement may be apparent in brain regions not protected by the barrier. Increased density on CT is often prominent in the large intracranial vascular channels and the capillary bed of the gray matter (fig. 1) in the initial period after indicator infusion [9-13]. On a delayed scan at 45 min after infusion, the intracranial density has returned to baseline.
[image:2.612.55.378.81.484.2] [image:2.612.57.419.88.268.2]hy-AJNR:2, November/December 1981 FUNCTIONAL CT OF CNS 497
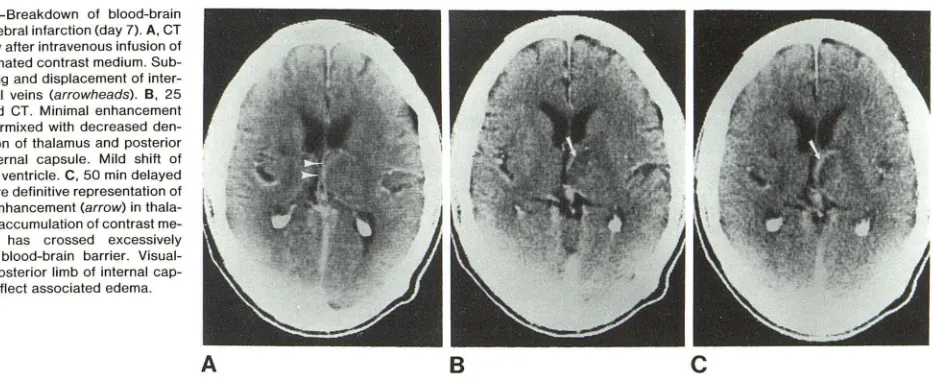
Fig. 3.-Breakdown of blood-brain barrier, cerebral infarction (day 7). A, CT immediately after intravenous infusion of
42 g of iodinated contrast medium.
Sub-tle stretching and displacement of inter-nal cerebral veins (arrowheads). B, 25 min delayed CT. Minimal enhancement (arrow) intermixed with decreased
den-sity in region of thalamus and posterior limb of internal capsule. Mild shift of posterior III ventricle. C, 50 min delayed
CT. Far more definitive representation of abnormal enhancement (arrow) in tha la-mus due to accumulation of contrast
me-dium that has crossed excessively permeable blood-brain barrier. Visual-ization of posterior limb of internal cap -sule may reflect associated edema.
A
percapnia, acidosis, concussion, markedly elevated intra-cranial pressure, and even the intracarotid infusion of con-centrated iodinated contrast media [4, 17-20]. Various the-ories have been proposed to explain the barrier breakdown including stimulation of pinocytosis, opening of tight junc-tions, and endothelial proliferation. In fact, the mechanism may differ depending on the disease process.
In most individuals, the intravenous infusion of 42 g of iodine in a 150 or 300 ml volume is sufficient to detect a barrier abnormality using CT imaging. Some have suggested that larger doses of contrast media will improve diagnostic accuracy [21-23], but controversy exists concerning the increased potential for adverse reactions (renal [24] and/or cerebral toxicity). Most agree that by obtaining a delayed CT scan at 30-90 min after the infusion of contrast material, additional information concerning the presence and extent of blood-brain barrier damage becomes available (fig. 3). Although clinical history, patient age, anatomic locale, and associated edema pattern [25, 26] may assist the clinician in making an accurate "educated guess" concerning the ultimate pathologic diagnosis, the actual pattern and degree of breakdown have not yet proven consistently disease specific.
The contrast-enhancement ratio (CER) seems the most direct measure of barrier integrity of disruption, and early CT studies did not define any ratio that was specific for a pathologic process [14, 15].
~ CT# Brain
(Enhanced, time T - Baseline) CER = - -
-~ CT# Blood
(Enhanced, time T - Baseline)
Dual kilovoltage techniques [27-29] (analysis of changes in effective atomic number) have been used in an attempt to distinguish various tumor types, but the overlap among the different groups makes the use of this strategy tenuous at present, particularly when making the vital and potentially devastating diagnostic and therapeutic decisions that are necessary when treating cerebral neoplasms.
B
c
Reversible opening of the blood-brain barrier. By infusing hyperosmotic mannitol or arabinose into the internal carotid artery, Rapoport and associates [4, 19, 30-32] confirmed that the normal barrier may be transiently disrupted with subsequent return to normal within a few hours. Unfortu-nately, the degree of barrier openi~ is variable even when using the same dose and infusion rate of a hyperosmotic material [4, 32]. When ultimate tissue analysis has been performed in vitro, Evans blue, horseradish peroxidase, 14C sucrose [30, 32], and 14C deoxyglucose [33] have been used to quantitate the degree of opening. Similar estimations have been performed in vivo using both radionuclides and iodinated contrast media [34, 35] (fig. 4). Higher contrast-enhancement ratios have signified more extensive disrup-tion of the barrier. The major potential applications of hyperosmotic barrier opening include: (1) facilitating greater passage of contrast medium through a barrier only mildly damaged, thus permitting earlier recognition of disease, (2) allowing entry into the brain of a radiopharmaceutical (e.g., labeled antibody or drug) that will define a specific brain function but would not normally cross an intact blood-brain barrier, and (3) permitting greater access of a chemothera-peutic agent or other drug to an area of diseased brain [36-38]. Before use of this technique in man, further studies should be performed to define the toxicity of hyperosmotic barrier opening and the effects of greater direct access of iodinated contrast media to the brain substance.
Transit Time and Cerebral Blood Volume (fig. 5)
[image:3.612.92.558.86.277.2]498 DRAYER AJNR:2, November/December 1981
A
B
c
74, . - - - , 72
70 68 66
Righi CarOlld Mannitol
IntrQvenous Reno 60 jf 3631
.
.
' .', ....Idealized
Normal BBB Fig. 4.- Transient opening of blood-brain barrier (BBB), intracarotid mannitol. A, Coronal CT scan in dog 5 min
after intravenous infusion of 1.25 ml/kg bw of Renografin-60 and 15 min after carotid infusion of 150 ml of 25% mannitol to transiently open BBB. B, Same level 20 min after contrast medium infusion. Increasing enhancement bilaterally in deep and cortical gray matter reflecting barrier leakage. Square cursor is in parietal gray matter opposite side of carotid mannitol infusion. C, Same level 60 min after intravenous contrast medium (70 min after mannitol). Persistance of brain enhancement. D, Graphical representation of contrast enhancement in these scans
in left vs. right parietal lobe after BBB disruption with intracarotid mannitol.
D
o 10 20 30 40 50 60 70 80 90
TIME Im,,1
INTRAVASCULAR INDICATOR
GRAY
CAPILLARY
I
WHITE
I
e
.
g
.
Iodine
T
=A
I
H
r
C
BV
=[L1CT
#
Brain
lr
OO
/
l
LL1
C
T
#
Plo
s
moJL
/
l
OO-NJ
r
C
BF
=r
C
BV
I
t
Fig. 5.- Summary of intravascular indicator applications. Currently used intravenously infused iodinated contrast media remain in vascular bed and pass into brain in only negligible amounts if blood-brain barrier is intact. Using dynamic CT, mean transit time (f) can be estimated from area (A) and height (H) of time-density curve. From static CT image of brain and venous blood in plastic syringe, regional cerebral blood volume (rCBV) can be approximated. Central volume principle as derived by Meier and Zierler states that mean transit time is directly proportional to volume of distribution (rCBV) and inversely proportional to regional blood flow (rCBF).
analysis of cerebrovascular transit times (fig. 6). Such stud-ies have used principles developed in nuclear medicine imaging while exploiting the more precise anatomic locali-zation provided by CT.
The technique used by most groups for analyzing cerebral transit time involves the rapid (5-10 sec) intravenous (brachial vein) injection of about 50 ml of a high-concentra-tion iodinated contrast medium. Consecutive CT scans at a chosen brain level are then performed every 1 -5 sec with the scan sequence begun before contrast material enters the cerebral vasculature so that a baseline (nonenhanced) numerical CT value is available for comparison with the subsequent enhanced scans. Regions of interest in selected brain and vascular locales are then chosen for quantitation by arbitrary visual or defined computerized methods. By plotting the change in CT number (Ll CT #) over a given time interval (time-concentration curve), transit time can be estimated by a variety of methods (fig. 7).
The currently popular strategy for estimating the mean transit time uses the first moment (center of gravity of the shape) of the time-concentration capillary curve obtained from gamma variate curve fitting of the CT derived data [39]. This is based on the theories that the first moment of the draining venous concentration of the contrast medium after a bolus arterial injection most closely represents flow, and
Fig. 6.-Dynamic CT scanning of nondiffusible indicator. After rapid intravenous injection of 49 ml (7 ml/sec for 7 sec) of Renografin-60, serial CT scans were obtained using a 4.8 sec scan time and a 1.0 sec interscan delay in patient with large cerebral infarction (arrows) in distribution of middle cerebral artery. Data obtained from these scans were used for mean transit time calculations in figure 7.
that the residual indicator in the intravascular (e.g., brain capillary bed) space as measured by CT will exactly equal (perfect mixing) the concentration in the draining vein. How-ever, mixing is not perfect; this method provides only a relative or approximate transit time which can be useful for comparisons within a given patient but not for calculating actual mean transit time for comparisons among different patients.
[image:4.615.55.445.80.181.2] [image:4.615.49.298.276.356.2] [image:4.615.316.560.278.527.2]AJNR:2, November/December 1981 FUNCTIONAL CT OF CNS 499
A
Fig. 7.-Dynamic CT, transit time analysis. A, Delayed transit iodinated contrast medium through cerebral infarction(s) in distribution of middle cere -bral artery as compared to uninvolved contralateral brain vasculature (c). Mathematical analysis of transit time in this figure was developed at University of California, San Francisco in conjunction with General Electric Corporation.
B
a dispersed bolus, such as intravenous infusion of larger
quantities of contrast medium, a correction is necessary for
the prolonged input. Axel [39] suggested that by directly
subtracting the mean injection time from the observed
cap-illary bed transit time, the same mean transit time is obtained
as would have been estimated using an instantaneous
ca-rotid injection. The mean injection time is determined using
a histogram-based region of interest that includes large
vessels but excludes gray and white matter capillary beds.
Unfortunately, a small region of interest around a major
artery on a very thinly collimated scan section would be necessary to avoid significant partial volume averaging
when estimating mean injection time. This type of analysis
is cumbersome and is limited to small thicknesses of the
brain for a given infusion if one wants to calculate an
absolute rather than a relative mean transit time.
Another method for circumventing some of the problems
created by a dispersed bolus would be to directly infuse
(instantaneous bolus) iodinated contrast material into the
internal carotid artery at angiography [42-46]. A traditional
analysis of the area (A) of the time-concentration residue
detection curve divided by the maximum height (H), with a
small correction for indicator recirculation, permits the c
ir-culation of the mean transit time
d):
t =
(A/H) min. Thisestimation contains error particularly of curve maximum
height, as the detecting device (CT scanner) might not
initially see the entire bolus when a 5-10 ml volume of
iodinated contrast medium is infused over 1-2 sec. More
importantly, the obvious advantage of the relatively
nonin-Chosen region of interest (s) exhibited fastesl transil time in infarction, while many other regions showed negligible if any increases in CT number. B, Transil through thalamic capillary bed (posterior cerebral artery distribution) was symmetric bilaterally (R and L). Transit times were also estimated (not shown here) for occipital regions and were symmetric bilaterally.
vasive intravenous infusion is lost using the intraarterial
method.
It is important to recognize that mean transit time is not a
measure of regional cerebral blood flow (rCBF) unless the
local blood volume is constant. This has been called the
central volume principle and the basic equation as derived
by Meier and Zierler [47] states that the mean transit time
(t)
is directly proportional to the regional volume of distri-bution of the indicator (V) and inversely proportional to
regional blood flow (F):
t
= V/F. When a nondiffusibleiodinated contrast medium is used, V is approximately equal
to regional cerebral blood volume (rCBV). As variations of
more than 100% may exist between the volume (V) of an
engorged vs. a collapsed vascular system [42], major diffi-culties in quantitating rCBF in absolute rather than relative
terms using nondiffusible indicators seem apparent.
The estimation of rCBV using CT is relatively
straightfor-ward [48, 49]. Intravascularly infused iodinated contrast
media are confined to the plasma compartment. rCBV is
calculated by dividing the change in the derived CT number
from a selected intracranial region of interest by the change
in the derived CT number from a simultaneous venous blood
sample drawn in a heparinized plastic syringe and placed in a scanning phantom. Using a stimulated x-ray fluorescence technique, Phelps et al. [50] observed that the time lapse
between the rapid intravenous infusion of contrast medium
and brain/blood scanning is not critical when calculating
rCBV.
500 DRAYER AJNR:2, November/December 1981
calculating rCBV. Since iodinated contrast media do not penetrate the red blood cells, a correction is necessary for the ratio of the cerebral to large vessel hematocrit. Most authors use a value of 0.85 derived from average values (range, 0.80-0.92) found in the literature [48, 50, 51]' In addition, after the injection of an iodinated contrast medium, there is a decrease in hematocrit (blood dilution factor, OF) to correct for and a final negligible correction is made for the density (g) of brain tissue (1.04 g/ml). The final opera-tional equation for calculating rCBV is as follows:
(CT# enhanced - CT# baseline) Brain X 0.85 X 100
rCBV = ml/100 g
(CT# enhanced - CT# baseline)
Blood X OF X g
The vein of Galen provides a potential substitute for periph-eral venous blood; however, partial volume averaging pre-sents a potential error unless thin collimation is used.
Although the rCBV values derived using these CT strate-gies seem to correlate reasonably well with those obtained using other methods, shortcomings exist that limit consistent quantitation in disease states in man [9, 52, 53]. (1) About
70% of cerebral vascular contrast medium probably resides
in venules with only 20% in the capillary bed [43], making perfusion (nutritional flow) assumptions uncertain. This problem is exemplified by the "luxury perfusion" phenom-enon [54] where vasoparalysis results in increased arterio-venous perfusion as reflected by regional high density on CT, yet the brain tissue does not receive or benefit from this increased vascular transit (i.e., non-nutritional flow). (2) Significant changes occur in the cerebral circulation after infusion of contrast material [55-58] including alterations in autoregulation, blood pressure, blood volume, and blood flow. (3) A major assumption when using a nondiffusible
indicator is that the blood-brain barrier is intact. However,
in many pathologic states the barrier is damaged with in-creased accumulation of contrast medium in the brain while
the blood enhancement remains unchanged [9, 53]. (4) The
ratio of cerebral to large vessel hematocrit may also be
altered with certain pathologic processes and with
hypervis-cosity. (5) Even large intravenous doses of contrast material produce only limited enhancement in the brain capillary bed. Thus, the error in the derived CT numbers (about
±
1.0 CT units) may be a significant percentage of the ultimate cere-bral vasculature enhancement [53]. (6) Patient movement may occur, particularly with rapid intravenous infusion, mak-ing comparison of baseline to enhanced regions of interest difficult.Although the limitations of transit time and blood volume CT determinations must be recognized, relative values may prove clinically useful in understanding the normal brain as well as certain disease processes that do not significantly damage the blood-brain barrier:
Transient ischemic attacks have been studied [13] with
the suggestion that four patterns might be shown if the two cerebral hemispheres are compared: (1) normal arterial
(arterial transit time) and normal mean capillary transit time
(capillary minus arterial transit time); (2) normal arterial with
delayed mean capillary transit suggesting impaired tissue perfusion with normal arrival (normal arrival might suggest symmetry or patency of arteries proximal to region of inter-est vessel); (3) delayed arterial and capillary transit to an equal degree suggesting adequate tissue perfusion but de-layed arrival, and (4) delayed arterial to a lesser degree than delayed capillary transit suggesting delayed arrival as well as impaired tissue perfusion.
Cerebral infarctions present a reasonably consistent
dy-namic CT transit time picture [10-12]. Hypoperfusion is
usually reflected by delayed mean transit time and
de-creased maximum height (~ CT #) on time-density curve
(figs. 6 and 7). Hyperperfusion as indicated during the first pass together with a normal stable distribution image (at
5-10 min after contrast infusion) may be predictive of recovery
[12]. It thus seems clinically reasonable to obtain information
concerning both transit time (rapid sequence dynamic im-ages) and blood-brain barrier integrity (delayed stable dis-tricution image).
Cerebral edema shows a pattern of normal or delayed
transit, reduced maximum CT enhancement, and diminished
regional cerebral blood volume (rCBV) [9, 12].
Arteriovenous malformations may have a relatively short
transit time with an increased maximum curve height [9,11].
Cerebral neoplasms have components of increased
vas-cularity and barrier disruption which may be differentiated using the combination of rapid and delayed CT imaging [1
0-
12,591-Chronic degenerative diseases (e.g., Alzheimer disease)
may be better understood with CT studies of transit time and regional cerebral blood volume, as they do not show evi-dence of significant barrier damage. Such studies have yet to be performed.
Circulatory arrest as in brain death is suggested by the
absence of any large vessel or capillary bed enhancement on either rapid sequence or stable distribution scans after a confirmed successful intravenous infusion of sufficient doses of iodinated contrast material [9, 26, 60, 61].
Therefore, rapid sequence scanning may prove useful in defining relative abnormalities as long as its definite short-comings are understood and rigid quantitations are not expected. Probably the most useful application of dynamic CT using nondiffusible indicators is not functional but ana-tomic. The improved and sequential definition of large blood vessels permits the potential distinction of intra- from ex-traaxial neoplasms [59], better visualization of feeding ar-teries and draining veins in vascular malformations, and more accurate distihction of an isodense extracerebral he-matoma from underlying large vessels and the cortical cap-illary bed. In addition, when rapid scanning is used In conjunction with rapid table movements, multilevel imaging with multi plane reformatting and three-dimensional recon-struction can be performed to morphologically analyze the carotid bifurcation [62], the supraclinoid carotids, and even
the intracranial vasculature (fig. 8). This application,
how-ever, may decline in importance with the emergence of
AJNR:2. November/December 1981 FUNCTIONAL CT OF CNS 501
Fi9. 8.-Normal vascular anatomy using CT and iodinated contrast me -dium. Coronal reformatting of consecutive 4 mm scans (2 mm scan overlap) performed during continuous intravenous infusion of iodinated contrast me-dium displays internal carotid. anterior cerebral. and middle cerebral arteries.
01 FFUSI BlE
1
N OICATOR
e.g., xenon
J
T -K·(T-u)Ci(T) = AiKi 0 Ca(u)e I du
GRAY
CAPILLARY
·
rCBF= AiKiA. _ 6CT # Brain (equil)
I - 6CT # Blood (equil)
Fig. 9.-Summary of diffusible indicator applications. Diffusible indicator (e.g .. xenon) freely crosses intact blood-brain barrier to distribute initially in relation to blood flow (gray> white matter for xenon) and in relation to brain-blood ·partition coefficient at equilibrium (white> gray matter for xenon). C,(T)
= concentration of xenon in chosen brain locale. (;) at chosen time (Tl; A, =
brain-blood partition coefficient; K, = flow rate constant; C. = arterial concentration of xenon; rCBF = regional cerebral blood flow.
Cerebral Blood Flow, Diffusible Indicator Methods (fig. 9)
Radionuclide methods for the estimation of regional cere-bral blood flow (rCBF) have involved the use of radioactive inert gases, xenon-133 and krypton-85 [42, 54, 67-71]. These techniques have had basic limitations because of poor anatomic specificity and the necessity for using fixed partition coefficients. Emission CT analyses of blood flow are limited at present by high cost, poor spatial resolution, and slow scanning speed [72]. For these reasons, the se-quential CT imaging of inhaled nonradioactive xenon [73-78] (figs. 10 and 11) has been developed to provide a high resolution, in vivo, neuroanatomic map of tissue perfusion (nutritional blood flow) [79-83] and brain-blood partitioning [76,79-82]. Xenon, an inert gas that readily diffuses across the blood-brain barrier, has a k-edge similar to that of iodine, permitting imaging with x-rays. Due to its inertness and diffusibility, useful measurements of brain blood flow and brain-blood partition coefficient have been obtained with this gas.
A brief review of the theoretical concepts underlying this calculation of rCBF is offered to facilitate the understanding of the relatively straightforward data obtained using x enon-enhanced CT scanning. This discussion draws on the re-views of Siesjo [84] and Lassen and Ingvar [42]. A detailed analysis of the mathematical principles has been amply analyzed in previous studies and is beyond the scope of this review.
As stated earlier, the equation of Meier and Zierler (f = V/F) is the basis for measuring cerebral blood flow [47]. The equation is derived from the principle of conservation of matter and states that indicator particles introduced into
B
c
D
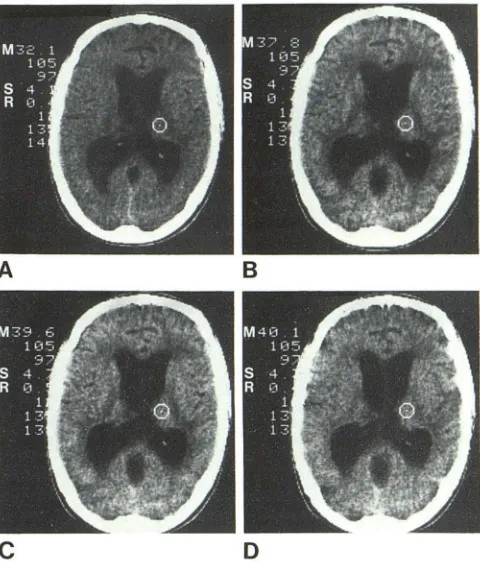
Fig. 10.- Xenon-enhanced CT. buildup analysis of normal thalamus. A. Baseline scan iust before xenon inhalation; region of interest (ROI) cursor in thalamus. M = mean CT number for chosen ROI; S = standard deviation; and R = root mean square deviation. B. Scan at 2 min at same level during xenon (32%) inhalation. Preferential enhancement of gray matter and high -lighting of posterior limb of internal capsule (white matter) which enhances less at this early phase of inhalation. CT number has increased 5.7 units (U) (ie .. 32.1 to 37.8) in thalamic ROI and would be used for C, in formula in figure 9. C. 6.5 min. Greater enhancement in thalamus (7.5 CT U) and other brain structures as xenon inhalation continues. D. 10.5 min. Thalamic gray matter essentially equilibrated with blood at this phase of xenon inhalation. Equilibration confirmed by similar degree of enhancement at 6.5 (7.5 CT U) and 10.5 (8.0 CT U) minutes of inhalation. Posterior limb of internal capsule (white matter) no longer sharply defined. as white matter has not equilibrated and continues to increase in density. If inhalation of xenon were continued for 20-30 min. white matter structures would also equilibrate and become denser (about 15.0 CT U) than gray matter (8.0 CT U).
a perfused organ must be cleared from it. Kety [67] was the first to understand the superiority of inert gases as diffusible indicators for blood flow measurements. He noted that inert gases dissolve physically in all brain compartments, have similar solubility in brain as in blood, are essentially unaf -fected by large changes in local cerebral blood volume, and at equilibrium are distributed passively according to s olubil-ity properties (partition coefficient).
In his inert gas method, Kety applied the Fick principle to a nonsteady state situation. Since inert gases are not me -tabolized by the brain, the amount of gas taken up by the brain (OJ) (; representing a selected tissue compartment) in a given time interval (T) is the difference between the arterial input (0.) and the venous outflow (Ov): O,{ T) = Oa( T) -Ov(T). If arterial inflow equals venous outflow, for any given instant the equation can be written: (dC;jdt) = (Fj/V) (Ca
-Cv), where C. is the arterial concentration and Cv the venous
[image:7.612.318.558.86.368.2] [image:7.612.54.298.88.148.2]502 DRAYER AJNR:2, November/December 1981
A
B
c
D
E
flow rate times the arterial concentration (Oa = Fax Ca), the venous effluent equals the venous flow rate times the venous concentration (Ov = Fv X Cv), and the regional tissue
con-centration (Cj ) equals the quantity of tracer (Q;) taken up by
the brain divided by the volume of tissue (Vj): C, = O;/V,.
The regional cerebral blood flow (Fj) can then be obtained.
A requirement of a truly regional blood flow method is that the flow rate can be calculated even if venous blood is not
available. To do this, the assumption must be made that the
inert gas comes into essentially instantaneous diffusion
equilibrium between capillary blood and perfused tissue and
therefore Cv = C;/A;. A; is the partition coefficient or solubility ratio of the inert gas between a region of brain and blood.
By substituting for Cv in the previous equation: dC;/dt = (F;/
V,) (Ca - C,/A;). Finally, by assuming that the flow in the selected region of brain (e.g., gray matter) is homogeneous,
the prior equation may be integrated and solved for Cj (the indicator concentration in a local homogenous region of brain or spinal cord) at any chosen time (T):
where Kj is the flow rate constant (per unit weight), Ca the
arterial concentration of indicator, and Fj = AjK j.
The accuracy of this direct tissue saturation technique for calculating rCBF has been extensively validated in labora-tory experiments [85-88] and has therefore been applied in many of the in vivo xenon studies [80, 81]' To integrate the arterial concentration Ca(u) over a time interval, multiple sequential arterial blood samples are drawn from the femoral or radial artery and either scanned [79-81] or quantitated
F
Fig. 11.-Xenon-enhanced CT, buildup analysis of normal periventricu-lar white matter. A, Baseline scan before xenon (32%) inhalation with region of interest cursor in periventricular white
matter. B, 1 min. Mean increase in
den-sity (M) somewhat greater than expected for white matter in early stage of inhal a-tion. Good example of difficulties in-volved in using data from single scan to
calculate blood flow, particularly when
degree of enhancement is small. C, 2.0
min. White matter enhancement less
than at 1.0 min, suggesting inaccuracy in 1.0 min scan quantitation due to slight patient movement. 0, 4.5 min. Enhance -ment in gray matter continues to exceed
that in white matter, and its symmetry is
apparent on even visual analysis. E, 8.5 min. Increasing enhancement continues in white matter (4.8 CT U, i.e., 30.6 -25.8) while gray enhancement is
un-changed (equilibrated). F, 12.5 min.
White matter has not yet approached
equilibrium even after 12.5 min of xenon inhalation. If inhalation were continued for 20-30 minutes, xenon concentration
in white matter would equilibrate and
enhancement would be almost double
that in gray matter structures.
in some manner such as fluorescent excitation analysis. A noninvasive method would obviously be superior for clinical purposes and is possible by continuously measuring the end-tidal xenon concentration, if pulmonary function is in-tact, using a mass spectrometer or xenon thermoconductiv-ity analyzer [82, 83]. The CT clearance profile of inhaled
xenon also permits derivation of rCBF in an analogous manner.
Using CT, direct determination of the partition coefficient (A) in a given tissue compartment (i) can be made by dividing the brain enhancement by the arterial blood enhancement at equilibrium [42,79-81] with a neglible correction for the
specific gravity of brain to obtain flow in the usual units of
ml/100 g/min.
CT # Brain (at equil)
- CT # Brain (baseline)
A
=-, CT # Blood (at equil)
- CT # Blood (baseline)
The solubility ratio between brain and blood (A) determines the distribution of xenon per gram of tissue. Another useful method for calculating A has been described using Ostwald
solubility coefficients [76]. Using this method, it is not nec
-essary to draw arterial blood, since the end tidal xenon
concentration at equilibrium may be used:
!1CT # 5.15 X 8xe X C (%)
(Blood) f.L';;' I f.L~e X 1 00
set-AJNR:2, November IDecember 1981 FUNCTIONAL CT OF CNS 503
Fig. 12.- Xenon-enhanced CT, buildup analysis of spinal cord. A,
Base-line non enhanced CT scan of cervical spinal cord in dog. B, 1.5 min. Mild en -hancement of cord, but no distinction of gray from white matter (closed system, 50% xenon). C, 5.0 min. Greater e n-hancement of spinal cord with continued xenon inhalation. Derived CT numbers from spinal cord had fairly large
devia-tions making errors fairly large (50%
range) when calculating regional spinal cord blood flow and partition coefficient.
A
8
A
Fig. 13.- Xenon CT, cerebral infarction. A, Normal anatomy of baboon at level of sequential xenon study (B-O). B, 1.5 min Highlighted measure mode
display. Decreased enhancement in large area of cerebral infarction (I) produced by surgical cauterization of ipsilateral lenticulostriate branches of the middle cerebral artery. Additional regions of diminished xenon enhan
ce-ment in homologous contralateral basal ganglia (BG), adjacent opercular cortex (FPC), and ipsilateral occipital lobe (OL). Striking clinical findings included prominent contralateral weakness and homonymous hemianopsia.
tings. This ability to directly calculate the A of xenon with morphologic specificity is a major advantage of CT com -pared to the radionuclide method, but there are limitations.
The major uncertainty of the xenon CT technique is
bio-physical [75, 80, 81]. In essence, the question boils down
to what effect on mentation and blood flow a 30%-40%
xenon concentration will have, while producing sufficient
signal for accurate CT quantitation. Another problem is the
difficulty of selecting anatomic regions that sufficiently
con-form with the basic assumption of homogeneity of flow. To
date, all regions of cortical or subcortical gray matter ex -amined in vivo seem to have some, though possibly
unim-portant, inhomogeneity [80, 89]. Another nontrivial difficulty
concerns isolating purely gray from purely white matter with a reasonable CT slice thickness and at the same time accounting for minor patient movement that might occur
during the course of the examination. Finally, constant
com-promises must be made involving radiation exposure, spatial
resolution vs. contrast sensitivity, and anatomic precision vs. improved statistical accuracy (e.g., a smaller region of
8
c
c
D
C, 2.5 min. little change. 0, 6.5 min. Area of infarction (I) better defined and did not change in density with 14 min of inhalation. Both rCBF and A are
therefore severely decreased in this dead tissue. Contralateral basal ganglia (BG), adjacent opercular cortex (FPC), and occipital lobe (OL) have now enhanced and almost reached equilibrium concentration of xenon confirming
normal tissue integrity as reflected by A but decreased cerebral metabolism as reflected by flow rate constant and rCBF.
interest gives improved anatomic specificity yet larger error
in the derived CT number).
The regional cerebral blood flow and partition coefficient derived from the in vivo "autoradiographic" technique
cor-respond to those determined in vitro. High flow rates with
definite regional variation (60-110 ml/100 g/min) have
been found in cortical and subcortical gray matter [80-82].
Perfusion rates in white matter have been about 25% those
in gray matter (10-25 ml/100 g/min) as expected. Xenon
CT measurements have shown anticipated variations in
rCBF with changing Paco2 [90]. The directly calculated A
for gray (G) and white (W) matter were also consistent with
experimentally derived values (AG
=
0.8 to 1.0 and Aw=
1.4 to 1.7). As inhaled xenon will also increase the density
of the spinal cord, attempts have been made to calculate
spinal cord blood flow and A [91 ,92] (fig. 12). Unfortunately
artifact and quantitation difficulties arise when analyzing
such a small object surrounded by a bony mass.
To date, most studies with xenon-enhanced CT in either
rc-504
DRAYER
AJNR:2, November/December 1981tion. The technique has confirmed that both the blood flow and the blood-brain partition coefficient are decreased and heterogeneous within a seemingly homogeneous region of cerebral infarction [81, 83]. The heterogeneity is of thera-peutic importance in that the areas with lesser alteration may represent potentially reversible edema or ischemia as opposed to infarction. In addition, a morphysiologic map of flow and
A.
may be derived for the rest of the cortical, subcortical, and white-matter structures ipsilateral to the infarction and in the contralateral hemisphere. In this man-ner, areas of the brain that are not directly involved by infarction yet are also hypoperfused may be distinguished(fig. 13). CBF thereby directly reflects brain metabolic activ
-ity.
It is important ot recognize that xenon CT studies.analyze two distinct yet highly intertwined processes, that is, nutrient blood flow or perfusion of tissue (rCBF) and tissue integrity
(A.). Blood flow is derived from the initial, rapidly changing part of the time density buildup or clearance curve, while
A.
is estimated from the delayed, stable, equilibrium part of the curve (figs. 14 and 15). In xenon CT studies of demyelinating disease (multiple sclerosis), no definite abnormalities were noted [78]. However, the white matter may require 25-30A
B
Fig. 14.-Xenon CT, cerebral infarction, primate. A, Nonenhanced. B, 5 min of xenon inhalation (40%) greatly improves visualization of cerebral infarction, as normal brain enhances and cerebral infarction does not. Xenon may therefore be used to improve morphologic definition on static CT study in addition to its use as blood flow marker.
A
B
c
min to equilibrate. The prolonged inhalation study necessary to precisely analyze tissue integrity in this condition has not yet been performed. Others have affirmed the varying
A.
in central nervous systems neoplasms [93, 94], but could not differentiate tumor from infarction. Xenon enhancement of the normal cortical mantle may assist in distinguishing an isodense extracerebral hematoma from underlying brain [77]. Studies are also in progress to characterize rCBF andA.
in Alzheimer disease, normal aging, and transient ischemicattack. Xenon-enhanced CT has also been used to better
define cervical syringohydromyelia [91].
A minimally invasive, reasonably accurate method for performing xenon CT of selected gray matter at multiple levels with acceptable radiation doses is as follows (figs. 16 and 17). Xenon (35% concentration) is inhaled for 6.5 min and the end-tidal xenon (Ca) is continuously monitored. Obrist et al. [71], in xenon-133 inhalation studies, confirmed
that the end-tidal xenon correlates with the arterial xenon concentration if pulmonary function is normal. Using the
dy:namic scanning mode with rapid table incrementing, three or four levels (4-10 mm collimation) of brain are scanned before enhancement. These same sections are then re-scanned during nonradioactive xenon inhalation at 1.5-2 min, 4.0-4.5 min, and 6.0-6.5 min time intervals. The serial
scans are then used to measure tissue concentration Cj(T). This scan sequence is the minimum required; more images during the maximum buildup and equilibrium phases would
provide more accurate blood flow data. The partition coe
f-ficient for gray matter
(A.
G
)
is calculated by dividing the enhancement derived from the 6.0-6.5 min scan of the brain by the concentration of xenon (in CT units) in a venous blood sample. The venous concentration has esentiallyequilibrated with the arterial concentration by 6.5 min if
pulmonary function is intact. If the density (i.e" I:l. CT #) of a given selected gray matter region on the 4.0-4.5 min
scans is about equal to that on the 6.0-6.5 min scan, the important theoretical assumption of homogeneity is
con-firmed. In areas where saturation is not achieved in the inhalation period, curve fitting based on a multivariable analysis can be used to derive both K and
A.
.
At present,Fig. 15. -Xenon CT, cerebral infar c-tion, human. A, Baseline scan. Area of infarction adjacent to circular sulcus
poorly demarcated and might even be
missed. B, After 2 min of xenon (30%) inhalation. Infarction better seen. C, 10 min of inhalation. Previously subtle
in-farction becomes grossly apparent (ar-rows). rCBF essentially 0 ml/1 00 g/min
[image:10.613.52.296.352.481.2] [image:10.613.53.417.554.737.2]AJNR:2, November/December 1981 FUNCTIONAL CT OF CNS 505
XENON
ENHANCED CT,
rCBF:
C{TI~l;K~
/
I
I
Solve for K;I
-Inlegrale muiliple-Single scan lime T (Aula radiog raphy) -Multiple scans
(Curve Analysis) -Homogeneous
lissue
-Direcl lICT Brain (equll) lICT Blood (equil) -Oslwald Solubilily,
Coefficienl
orlerlol, orlerialized venous, or end-lido I xenon concenlralions - Imparlance of
Pulmonary Func"on
Fig. 16.-Xenon CT, protocol for data acquisition. Basic autoradiographic
formula and summary of acquisition of data points.
1I CT
# Gray
CEREBRAL
BLOOD FLOW
3
Time (min) 4
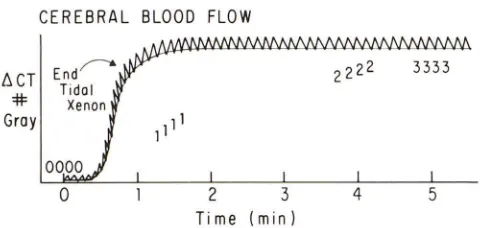
Fig. 17.-Sample of derived data for arterial input function (end tidal xenon represented in CT units) and enhancement from chosen region of gray
matter at four different brain levels. 0000 = baseline scans at four levels: 1111 = maximum buildup phase scans at four levels; 2222 = approaching gray matter equilibrium scans at four levels; 3333 = gray matter equilibrium
scans at four levels.
relatively simple methods have been used to calculate flow, but more precise methodologies based on more than one
image are now being developed [95].
Future Implications
Tissue Characterization and Metabolism
CT will be extremely difficult to surpass as the dominant
anatomic imaging method for the central nervous system,
Its morphologic specificity permits measurement of various
physiologic functions as well. Nevertheless, these
suc-cesses have highlighted a new challenge, that of
investigat-ing brain metabolism with anatomic accuracy. Both emission
computed tomography and nuclear magnetic resonance (NMR) carry enormous diagnostic and therapeutic potential
for in vivo metabolic imaging.
Can CT compete in this important clinical sphere? Gross tissue analysis is a basic feature of nonenhanced CT scan-ning as we distinguish gray matter, white matter,
cerebro-spinal fluid, water, bone, calcium, blood, fat, tumor, and
devitalized brain by the percentage of photons they
atten-uate. Both visual [26] and quantitative [96] attempts have
been made to characterize brain edema and distinguish
intra-from extracellular brain water. CT scanning may also
be used to determine the effective atomic number of a
specified structure using dual kilovoltage imaging [27-29].
It has been used with limited success for analyzing the
degree of enhancement to differentiate various tumor types
[29]. However, its promise for improved in vivo tissue
char-acterization in both health and disease has not been fully
developed.
Unique and currently unavailable contrast materials might
permit CT to compete as a true metabolic imaging method.
Such material should cross the blood-brain barrier (i.e.,
having high lipid solubility), provide sufficient contrast for
CT imaging, remain in the extravascular brain space for a
sufficient time at equilibrium concentration after the
intra-vascular component has cleared, define a characteristic
metabolic event, and cause no or negligible adverse
reac-tions. These are obviously difficult requirements and call for
a redirection of our thoughts about iodinated contrast media
and the blood-brain barrier.
The inert gas xenon, with a k-edge and atomic number
similar to that of iodine, freely passes the barrier, enhances
the brain substance, and selectively localizes in lipid-rich
structures (e.g., white matter) at equilibration. Its differential
solubility is reflected in the calculation of the brain-blood A.
Unfortunately, none of the other inert gases seem to provide
sufficient enhancement for practical CT imaging nor do they
appear to selectively define any metabolic function. There are pharmaceuticals that have been synthesized
with radioactive iodine that cross the blood-brain barrier and
remain in the brain for a sufficient time to permit equilibrium
imaging. These include iodobenzene [97], iodoantipyrine
[88, 98], paraiodiamphetamines [99], and iodinated
dia-mines [100], and they may define nonspecific or
incom-pletely characterized metabolic functions. Iodinated
radio-nuclides have also been developed to characterize specific binding to the brain muscarinic cholinergic receptor
(iodo-quinuclidinylhydroxybenzilate) [101], beta adrenergic
re-ceptor, (iodohydroxypindolol) [102], and opiate receptor
(iodoenkephalin) [103]. Unfortunately, the toxicity of the
large doses of metabolic indicator or ligand required to
achieve statistically acceptable x-ray CT enhancement is
quite formidable. An example of this type of labeling/toxicity
problem was apparent in attempted measurement of rCBF
and A using iodoantipyrine [104]. However, many of these
iodinated pharmaceuticals should prove of value using 123
1
labeling and single-photon-detection emission computed
to-mography [101, 105, 106] even if the CT approach is
unsuccessful. None of the experimental iodinated contrast
media that have recently been developed for hepatic and
gastrointestinal CT imaging [107-109] seem capable of
crossing the blood-brain barrier or delineating specific brain
processes. Another approach might involve the use of
ele-ments with atomic numbers in the 58-66 range to utilize the
effective x-ray energy used in present CT scanners [110].
If a safe and function-specific contrast medium is
devel-oped which will not however sufficiently penetrate the
blood-brain barrier when infused by the intravascular route, several
potential approaches exist to circumvent the barrier. The
contrast material may be injected intrathecally as transport will normally occur across the CSF-brain barrier [111, 112]
[image:11.612.53.297.76.208.2] [image:11.612.54.294.253.367.2]506 DRAYER AJNR:2, November/December 1981
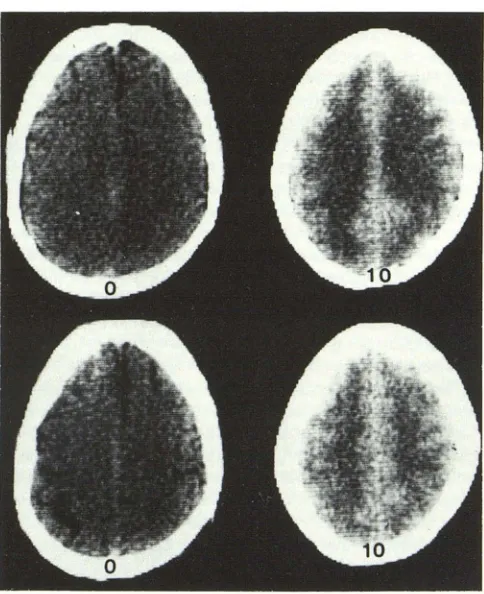
Fig. 18.-lntrathecal metrizamide enhancement, brain "blush." CT scans before (0) and 10 hr after (10) intrathecal introduction by lumbar puncture of
metrizamide. At 10 hr, metrizamide readily crosses CSF-brain barrier to enter brain substance. Intrathecal route may be used diagnostically to elucidate
abnormality by absence of brain blush or to provide access to brain for large, lipid insoluble indicator. Passage of hydrosoluble, non ionic contrast medium from CSF into brain also accounts for delayed appearance of adverse CNS
reactions after myelography.
vivo when delayed scans are performed after intrathecal
administration of metrizamide [113, 114]. Unfortunately, many of the adverse reactions related to metrizamide or other iodinated water-soluble contrast media are also likely
to be related to this brain penetrance. Another technique
for promoting passage of a tissue-specific contrast medium across the barrier involves the use of hypertonic mannitol or arabinose to produce transient opening of the barrier as
described above [30-37]. This procedure is experimental;
neither its acute nor chronic toxicity has been characterized
in large animals or man. Attempts might also be made to
manipulate the arterial carbon dioxide levels [11 5] in order
to facilitate transport across the normal or partially damaged
barrier.
Advances in Scanner Technology
Although major advances in CT technology may be few in the coming decade, certain modifications could greatly
ad-vance the applications of CT for functional imaging.
Improve-ments in contrast sensitivity with reduction in noise would
certainly enhance the statistical accuracy of the limited signal often provided by nontoxic doses of contrast
materi-als. CT noise, generally expressed as the standard deviation
(SO), has three basic origins: quantum noise, detector
effi-ciency, and mathematical reconstructions. A level of 0.15%
noise (i.e., SO of 1.5 on a
+
1 000 to -1000 scale) wouldassist the interpretation and quantitation of functional
im-ages if the sacrifice in spatial resolution were minor. The easiest means of decreasing the statistical
fluctua-tions of photon flux is to increase the flux (e.g., increase
mA, increase scanning time). However, this requires a
greater radiation dose and is of particular concern when
serial scans are necessary in younger individuals. Higher
exposures would also require an x-ray tube with a larger
heat capacity if multiple consecutive scans are necessary.
On the other hand, the prolonged scanning time would preclude its use for dynamic, nondiffusible indicator, transit
time studies. Greater detector efficiency will also decrease
noise. The major materials currently used for CT detectors
(bismuth germinate, xenon, cadmium tungstate) have
limi-tations of suboptimal efficiency, nonlinearity of response, or
afterglow.
Whatever the compromises, scanning flexibility would be
enhanced by simple, operator-controlled variation in
kilo-voltage, amperage, time, and collimation. Further, the ability
to readily manipulate the mathematical reconstructions or
filter functions should provide the operator the opportunity
to select either noise reduction or improved spatial resolu-tion depending on the type of funcresolu-tional study being per-formed.
Other potentialities for improving the accuracy of
quanti-tative CT imaging are also available. By calculating the
effective atomic number of a tissue rather than its derived
CT number with dual kilovoltage methods, a truer
represen-tation of tissue composition is obtained [27 -29]. Moreover,
as CT quantitation is dependent on comparing enhanced
scans to a previous baseline scan, precise repositioning of
regions of interest in the x, y, and z axes is essential.
Computerized selection of a specified, density-defined
re-gion of interest would assist in selection of a more homo-geneous region of interest and in eliminating
operator-in-duced bias.
The scanning of several brain levels simultaneously would provide important additional anatomic coverage during a
single functional study. It would be of even greater value to
concomitantly scan the carotid artery and thus more readily
define the important arterial input function. Accurate
meth-ods will need to be developed to superimpose single-photon
emission computed tomographic (SPECT) or positron
emis-sion tomographic (PET) images on CT images. In this
man-ner, the superb anatomic information provided by CT can
be used to better localize the important metabolic and pharmacologic data derived from these radionuclide stud-ies.
Conclusions
Using the unique anatomic specificity of x-rl?-y CT, a
[image:12.612.56.298.81.378.2]AJNR:2, November/December 1981 FUNCTIONAL CT OF CNS 507
spatial resolution and rapid scanning time (1-10 sec) are important advantages of x-ray CT over other imaging meth-ods, particularly when analyzing cerebral perfusion, Rea-sonably accurate in vivo quantitation of blood-brain barrier integrity (delayed iodinated contrast media enhanced CT), regional cerebral blood flow (xenon-enhanced CT), and
tissue characterization or lipid content (xenon-enhanced CT, equilibrium stage) in a well defined brain locale is possible using CT imaging.
It would be of major public health and basic scientific importance if the widely distributed CT scanners now avail-able in almost all major health centers in this country could
be used to characterize tissue metabolism in addition to their currently established anatomic and physiologic func-tions. To achieve this, a new class of contrast media will need to be developed. These substances must meet very stringent requirements. They must be of appropriate size and chemical composition to cross the intact blood-brain barrier, yet retain their initial labeled structure. They will need to define a specific biochemical, pharmacologic, or immune characteristic of the central nervous system. Most importantly, these function-specific contrast substances must have minimal toxicity at the doses necessary to provide a sufficient signal for CT quantitation. Due to recent ad-vances in PET scanning technology with improvements in both anatomic specificity and chemical syntheses, it may prove extremely difficult for x-ray CT to compete in this functional sphere. Rapid developments in NMR suggest that
these systems may also compete on both a metabolic and a morphologic level.
X-ray CT is a powerful neurodiagnostic tool. Functional applications are natural extensions of this anatomically pre-cise technique. The critical questions are whether in-depth biochemical information can be obtained, and whether this
functional information will improve our understanding and treatment of disease or merely provide additional superflu-ous data. Further experience with currently available meth-ods as well as future developments in contrast media and CT technology will provide the answer to these important questions.
REFERENCES
1. Bertler A, Falck B, Rosengren E. The direct demonstration of a barrier mechanism in the brain capillaries. Acta Pharmacol Toxico/1964;20:317-321
2. Reese TS, Karnovsky MJ. Fine structural localization of a blood-brain barrier to exogenous peroxidase. J Cell Bioi
1967;34:207-217
3. Westergaard E, Brightman MW. Transport of proteins across the normal cerebral arterioles. J Comp Neuro/1973;152: 17-44
4. Rapoport SI. Blood-brain barrier in physiology and medicine.
New York: Raven, 1976
5. Pardridge WM. Transport of nutrients and hormones through the blood-brain barrier. Diabetologia 1981 ;20: 1-9
6. Bertler A, Falck B, Owman C, et al. The localization of nonaminergic blood-brain barrier mechanisms. Pharmacol Rev 1966; 1 8: 369-385
7. Van Gelder NM. A comparison of y--aminobutyric acid
metab-olism in rabbit and mouse nervous tissue. J Neurochem 1965;12: 239-244
8. Hardebo JE, Owman C. Barrier mechanisms for neurotr
ans-mitter monoamines and their precursors at the blood-brain interface. Ann Neuro/1980;8: 1-11
9. Drayer BP, Heinz ER, Dujovny M, Wolfson SK, Gur D. Patterns of brain perfusion: dynamic computed tomography using in
-travenous contrast enhancement. J Comput Assist Tomogr
1979;3: 633-640
10. Heinz ER, Dubois PJ, Osborne, D, et al. Dynamic computed
tomography study of the brain. J Comput Assist Tomogr
1979;3: 641-649
11. Dobben GD, Valvassori GE, Mafee MF, Berninger WHo Eval
-uation of brain circulation by rapid rotational computed to-mography. Radiology 1979; 1 33: 1 05-111
12. Traupe H, Heiss WD, Hoeffken W, Sulch KJ. Perfusion p
at-terns in CT transit studies. Neuroradiology 1980;19: 181-191
13. Norman D, Axel L, Berninger WH, et al. Dynamic computed
tomography of the brain. Techniques, data analysis, and applications. AJNR 1981;2: 1-12
14. Gado MH, Phelps ME, Coleman RE. An extravascular com
-ponent of contrast enhancement in cranial computed
tomog-raphy. I. The tissue-blood ratio of contrast enhancement.
Radiology 1975;117: 589-593
15. Gado MH, Phelps ME, Coleman RE. An extravascular com
-ponent of contrast enhancement in cranial computed tomog
-raphy. II. Contrast enhancement and the blood-tissue barrier.
Radiology 1975; 117: 595-597
16. Norman D, Stevens EA, Wing SD, Levin V, Newton TH. Quantitative aspects of contrast enhancement in cranial
com-puted tomography. Radiology 1978;129: 683-688
17. Rapoport SI, Levitan H. Neurotoxicity of x-ray contrast media. Relation to lipid solubility and blood brain barrier permeability.
AJR 1974;122: 186-193
18. Sage MR, Drayer BP, Dubois PJ, Heinz ER, Osborne DO.
Increased permeability of the blood-brain barrier after carotid Renografin 76. AJNR 1981;2:272-274
19. Rapoport SI, Hori M, Klatzo I. Testing of a hypothesis for
osmotic opening of the blood-brain barrier. Am J Physiol
1972;223: 323-331
20. Raporport SI. Opening of the blood-brain barrier by acute hypertension. Exp Neuro/1976;52: 467 -4 79
21. Davis JM, Davis KR, Newhouse J, Peister RC. Expanded high iodine dose in computed cranial tomography: a preliminary report. Radiology 1979;131 :373-380
22. Hayman LA, Evans RA, Hinck VC. Rapid-high-dose contrast computed tomography of isodense subdural hematoma and cerebral swelling. Radiology 1979;131 : 381-383
23. Hayman LA, Evans RA, Bastion FO, Hinck VC. Delayed high dose contrast CT. Identifying patients at high risk of massive
hemorrhagic infarction. AJNR 1981;2: 139-147
24. Older R. Contrast-induced renal failure: a radiological prob-lem and a radiological diagnosis. Radiology 1979;131: 553
-554
25. Fishman RA. Brain edema. N Engl J Med 1975;293: 706-711
26. Drayer BP, Rosenbaum AE. Brain edema defined by cranial computed tomography. J Comput Assist Tomogr 1979;3:
317-323
27. Rutherford RA, Pullan BR, Isherwood I. Measurement of
effective atomic number and electron density using an EMI scanner. Neuroradiology 1976;11 : 15-21
508 DRAYER AJNR:2, November/December 1981
WHo Estimation of chemical composition and density from
computed tomography carried out at a number of energies.
Invest Radiol 1977; 1 2: 1 89-1 94
29. Latchaw RE, Payne JT, Loewenson RB. Predicting brain
tumor histology: change of effective atomic number with
contrast enhancement. AJR 1980;135: 757-762
30. Rapoport SI, Ohno K, Fredericks WR, Pettigrew KD. Regional
cerebrovascular permeability to (14C) sucrose after osmotic
opening of the blood-brain barrier. Brain Res 1978;150:
653-657
31. Brightman MW, Hori M, Rapoport SI, Reese TS, Westergaard
E. Osmotic opening of tight junctions in cerebral endothelium.
J Comp Neuro/1973; 152: 317 -326
32. Chiueh CC, Sun CL, Kopin IJ, Fredericks WR, Rapoport SI.
Entry of eH) N orepinephune, (,251) albumin and Evans blue
from blood into brain following unilateral osmotic osmotic
opening of the blood-brain barrier. Brain Res 1978;145:
291-301
33. Pappius HM, Savaki HE, Fieschi C, Rapoport SI, Sokoloff L.
Osmotic opening of the blood-brain barrier and local cerebral
glucose utilization. Ann Neuro/1979;5: 211-219
34. Neuwelt EA, Maravilla KR, Frenkel EP, Rapoport SI, Hill SA,
Barnett PA. Osmotic blood-brain barrier disruption. J Clin
Invest 1979;64: 684-688
35. Drayer BP, Schmeckel D, Hedlund L, Lischko M, Sage M,
Goulding P. An in vivo CT analysis of transient osmotic
opening of the blood-brain barrier. Radiology (in press)
36. Neuwelt EA, Frenkel EP, Diehl J, Vu LH, Rapoport SI, Hill S.
Reversible osmotic blood brain barrier disruption in man:
Implications for the chemotherapy of brain tumors.
Neurosur-gery 1980;7 :44-52
37. Hosegawa H, Allen JC, Mehta BM, Shapiro WR, Posner JB.
Enhancement of CNS penetration of methotrexate by
hy-perosmolar intracarotid mannitol or carcinomatous
meningi-tis. Neurology 1979;29: 1280-1286
38. Barranger JA, Rapoport SI, Fredericks WR, et al. Modification
of the blood-brain barrier: increased concentration and fate
of enzymes entering the brain. Proc Natl Acad Sci 1979;76:
481-485
39. Axel L. Cerebral blood flow determination by rapid-sequence
computed tomography. Radiology 1980;137: 679-686
40. Zierler KL. Equations for measuring blood flow by external
monitoring of radioisotopes. Circ Res 1965;16: 309-321
41. Oldendorf WH, Kitano M. Radioisotope measurement of brain
blood turnover time as a clinical index of brain circulation. J
Nucl Med 1976;8: 570-587
42. Lassen NA, Ingvar DH. Radioisotope assessment of regional
cerebral blood flow. Progr Nucl Med 1972;1 :376-409
43. Nylin G, Silverskiold BP, Lofstedt S, Regnstrom 0, Hedlund
S. Studies on cerebral blood flow in man using
radioactive-labelled erthrocytes. Brain 1960;83: 293-336
44. Fazio C, Fieschi C, Agnoli A. Direct common carotid injection
of radioisotopes for the evaluation of cerebral circulatory
disturbances. Neurology 1963;13: 561-574
45. Coin CG, Chan YS. Computed tomographic arteriography. J
Comput Assist Tomogr 1977;1: 165-168
46. Hacker H, Becker H. Time controlled computed tomographic
angiography. J Comput Assist Tomogr 1977;1 :405-409
47. Meier P, Zierler KL. On the theory of the indicator dilution
method for measurement of blood flow and volume. J Appl
Physio/1954;6:731-743
48. Ladurner G, Zilkha E, Iliff LD, DuBoulay GH, Marshall J.
Measurement of regional cerebral blood volume by
comput-erized axial tomography. J Neurol Neurosurg Psychiatry
1976;39: 1 52-158
49. Penn RD, Walser R, Kurtz D, Ackerman I. Tumor volume,
luxury perfusion and regional blood volume changes in man
visualized by subtraction computerized tomography. J
Neu-rosurg 1976;44: 449-457
50. Phelps ME, Grubb RL, Ter-Pogossian MM. In vivo regional
cerebral blood volume by x-ray fluorescence: validation of
method. J Appl Physio/1973;35: 741 -747
51. Kuhl DE, Reivich M, Alavi A, Nyary I, Staum MM. Local
cerebral blood volume determined by three-dimensional
re-construction of radionuclide scan data. Circ Res 1975;36:
610-619
52. Eichling JO, Gado MH, Grubb RL, Larson KB, Raichle ME,
Ter-Pogossian MM. Potential pitfalls in the measurement of
regional cerebral blood volume. In: Harper M, Jennett B,
Miller D, Rowan J, eds. Blood flow and metabolism in the
brain. Edinburgh: Churchill Livingstone, 1975: 7.15-7.19
53. Phelps ME, Kuhl DE. Pitfalls in the measurement of cerebral
blood volume with computed tomography. Radiology
1976;121 :375-377
54. Hoedt-Rasmussen K, Skinhoj E, Paulson 0, et al. Regional cerebral blood flow in acute apoplexy. The "luxury perfusion
syndrome" of brain tissue. Arch Neuro/1967;17: 271-281
55. Wolff HG, Forbes HS. The cerebral circulation. IV. The action of hypertonic solutions. Arch Neurol Psychiatry 1928; 20:
73-83
56. Kagstrom E, Lindgren P, Tornell G. Circulatory disturbances
during cerebral angiography. An experimental evaluation of
certain contrast media. Acta Radiol (Stockh) 1960;54: 3-16
57. Sako Y. Hemodynamic changes during arteriography. JAMA
1963;83: 253-256
58. Grubb RL, Hernandez-Perez MJ, Raichle ME, Phelps ME.
The effects of iodinated contrast agents on autoregulation of
cerebral blood flow. Stroke 1974;5:155-160
59. Dubois PH, Drayer BP, Heinz ER, et al. Rapid sequence
cranial computed tomography in tumor evaluation.
Neurora-diology 1981 ;21 : 79-86
60. Radberg C, Soderlunkh S. Computer tomography in cerebral
death. Acta Radiol [Suppl] (Stockh) 1975;346: 119-1 29
61. Drayer BP, Dujovny M, Wolfson SK, et al. Xenon and iodine
enhanced CT of diffuse cerebral circulatory arrest. AJNR
1980; 1 : 227 -232
62. Heinz ER, Dubois PJ, Drayer BP, et al. Intravenous carotid
imaging utilizing the third dimension (abstr). AJNR 1980;1 :
363
63. Nudelman S, Roehrig H, Seeley G. Intravenous angiography
using digital video subtraction. X-ray imaging system. AJNR
1980;1 :387-390
64. Nudelman S, Roehrig H. Intravenous angiography using
dig-ital video subtraction. Intravenous cervicocerebrovascular
an-giography. AJNR 1980;1 :379-386
65. Strother CM, Sackett JF, Crummy AB, et al. Clinical
applica-tions of computerized fluoroscopy. The extracranial carotid
arteries. Radiology 1980;136: 781-783
66. Meaney TF, Weinstein MA, Buonocore E, et al. Digital
sub-traction angiography of the human cardiovascular system.
AJR 1980; 135: 11 53-11 60
67. Kety SS. The theory and applications of the exchange of inert
gas at the lungs and tissues. Pharmacol Rev 1951 ;3: 1-41
68. Kety SS. Measurement of local blood flow by the exchange
of an inert, diffusible substance. Methods Med Res 1960;8:
228-236
69. Lassen NA, Hoedt-Rasmussen K, Sorenson SC, et al.
Re-gional cerebral blood flow in man determined by Krypton-85.
Neurology 1963;13:719-727
determina-AJNR:2, November/December 1981 FUNCTIONAL CT OF CNS 509
tion by 133Xe inhalation and external recording: the effect of arterial recirculation. Clin Sci 1966;30:353-369
71. Obrist WD, Thompson HK, Wang HS, Wilkinson WE. Regional cerebral blood flow estimated by 133Xenon inhalation. Stroke
1975;6: 245-256
72. Kanno I, Lassen NA. Two methods for calculating regional cerebral blood flow from emission computed tomography of inert gas concentrations. J Comput Assist Tomogr 1979;3: 71-76
73. Winkler SS, Sackett JF, Holden JE, et al. Xenon inhalation as an adjunct to computerized tomography of the brain