With 9 figures
m*rinted in Great Britain
THE COCKROACH DCMD NEURONE
II. DYNAMICS OF RESPONSE HABITUATION AND CONVERGENCE OF SPECTRAL INPUTS
BY DONALD H. EDWARDS, JR.*
Department of Biology, Yale University, New Haven, CT. 06520 (Received 20 July 1981 - Accepted 4 February 1982)
SUMMARY
1. The projections and response properties of a bilateral pair of large visual interneurones in the cockroach Periplaneta are described. The cells are shown to be analogous to the DCMD neurones of locust (Rowell, 1971a).
2. The organization of the afferent input to the cockroach DCMD was explored by examining the response to different types of visual stimuli. The afferent input is organized into an array of parallel channels. Response habitutation occurs within each channel independently of habituation in other channels.
3. The dynamics of habituation and recovery from habituation were examined. A simple model based on these data is proposed that can predict the DCMD response to repetitive stimuli having a wide range of inter-stimulus intervals. The relation of this model to models of synaptic depres-sion is discussed.
4. Both u.v.-sensitive and green-sensitive photoreceptors in the eye pro-vide input to the DCMD, but this cell remains unable to detect colour.
INTRODUCTION
The ventral nerve cord of the cockroach Periplaneta atnericana contains a bilateral pair of visual interneurones that are shown in this paper to be analogues of the DCMD neurones in the locust. The responses of these neurones have been used in the preceding paper (Edwards, 1982) to study lateral inhibition among the afferent neurones. In this paper the responses of the DCMD are used to study three aspects of the organization of the afferents: the spatial organization of response habituation, the kinetics of response habituation, and the convergence of spectral inputs.
MATERIALS AND METHODS
Adult male cockroaches (Periplaneta atnericana) from a laboratory colony were used in all experiments. Spikes from the DCMD axon were recorded extracellularly from the thoracic connectives of the ventral nerve cord as in the preceding paper (Edwards, 1982).
Two types of light sources were used in these experiments: a tungsten incandescen lamp provided all white light stimuli, while a mercury vapour lamp provided monochromatic light stimuli. The light from the mercury lamp was spectrally filtered with a grating monochromator (Bausch and Lomb, Inc., no. 33-86-40) to select monochromatic lights from the line spectra of the mercury fluorescence. Both white and monochromatic lights were filtered by a pair of adjustable quartz neutral density wedges (Eastman Kodak) which provided up to 5 log units attenuation. The light was focused onto the tip of a plastic fibre optic light guide (Edmund Scientific Co.) 2*5 mm in diameter, the opposite end of which provided a light stimulus. The in-tensity of the light stimulus was measured with a calibrated photodiode (United Detector Technology, PIN IO/UV).
The light guide was moved at a constant velocity in either direction along a linear, 15 cm path by a specially fabricated carriage. The speed could be varied continuously between 0-5 and 10 cm/s. A potentiometer was attached to the carriage drive so that a d.c. voltage could be measured that would vary with the position of the light guide. The carriage housing was arranged so that only the moving tip of the light guide could be seen by the animal.
The animal was positioned as described in the preceding paper (Fig. 1 b, Edwards, 1982), so that the stimulus path length subtended 500 at the eye, and the tip of the light guide subtended about 2°. The animal was oriented so that the longitudinal body axis was at 6o° to a line perpendicular to the centre of stimulus path. The path of the light guide was in the same horizontal plane as the long axis of one of the animal's eyes. This orientation brought the stimulus through the centre of the DCMD's receptive field, which corresponds to the dorso-lateral part of the eye, 6o° lateral from dorsal (Fig. 3). The other eye and the ocelli were covered with opaque wax.
Responses of the DCMD were measured as the number of spikes evoked during the period of stimulation minus the number that occurred spontaneously during an identical period immediately prior to stimulation. These spikes were identified by a window discriminator circuit (VV-P Instruments, Hamden, Conn.) and counted electronically.
All experiments were performed at room temperature (20° ± 2° C) on animals that were adapted to normal fluorescent room light conditions. The light power density reaching the animal from these lights was about 150 microwatts/cm2 (Tektronix J-16 digital photometer, with a J6512 irradiance head).
RESULTS
Evidence for analogy between a cockroach visual interneurone and the locust DCMD
neurone
Left pro/mesothoracic connective
Peduncle of right optic lobe
[image:3.451.91.344.79.239.2]Oscilloscope A ^^m triggered , ,m
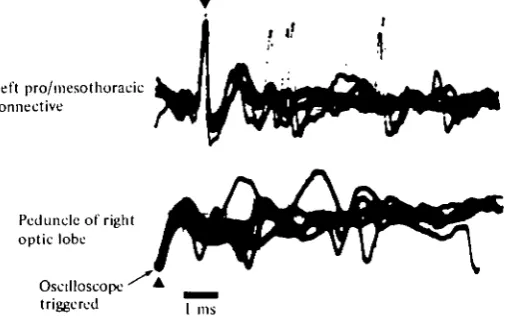
Fig. 1. Simultaneous extracellular recordings of the DCMD spikes in the peduncle of the optic lobe of the right eye (lower trace, filled triangle) and in the left pro-mesothoracic connec-tive of the ventral nerve cord (upper trace, filled triangle). The spikes were evoked by a 2° spot of light moving in the visual field of the right eye. The oscilloscope sweeps were repeatedly triggered simultaneously by the negative peaks of the DCMD spikes in the right optic lobe (lower trace); the exact superposition of the multiple traces of spikes in the ventral nerve cord indicates that the peak-to-peak latency between spikes in the two locations is a constant 1-25 ms. The other five large spikes in the top trace also appear to be DCMD spikes; they follow, at a constant latency of 1-25 ms, peaks of negativity in the bottom trace.
ventral nerve cord. Spikes are recorded one-for-one at the two sites with a constant latency of 1-25 ms, which, given a distance of less than 9 mm to travel, yields a conduction velocity of about 7 m/s. Both the constant latency and the high conduction velocity [approaching that of the cockroach abdominal giant fibres (Roeder, 1967)] suggests that what is functionally a single axon connects the two recording sites.
The cockroach neurone's spike is readily identifiable in extracellular recordings from the ventral nerve cord. The spike is large, and the cell responds with a character-istically rapid, bursty discharge to the movement of small light or dark targets against a contrasting background. Such a discharge can be seen in Fig. 2: the small dots following each spike are from pulses emitted by the window circuit which is adjusted to detect only the spikes of the visual interneurone.
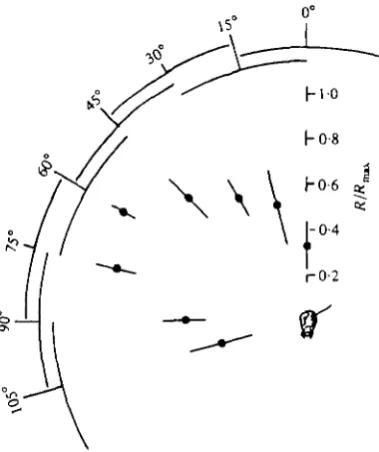
The visual field of the cell encompasses the whole of one compound eye. The cell can be excited everywhere within that field by motion stimuli as well as by on and off stimuli, but not by stationary patterns of light. The responsiveness of the cell to moving stimuli varies with the position of the stimulus in the visual field. This is seen in Fig. 3, in which normalized responses of the DCMD are plotted as a function of the angular position of the stimulus along an arc in the dorsal/lateral part of the visual field. A 2° spot of white light was moved at io°/s through each of a series of paths that subtended 30° in the visual field. The stimulus paths were in a plane that con-tained the long axis of the head and both eyes. Their centres were positioned in this plane at 15° intervals from directly dorsal to 1050 lateral from dorsal. At least eight responses were recorded at each position from each of three animals. The responses from each animal were normalized to the maximum response recorded from that
20 ms
Fig. a. A portion of the characteristically bursty DCMD response to movement of a 2° light spot at io°/8 through the visual field of one eye. The spikes were recorded from the contra-lateral pro-mesothoracic connective. The traces are continuous and relate the bursts of DCMD spike responses that occurred during 320 ms of a 5 s period of stimulation. The small dots following each DCMD spike are pulses from a window descriminator circuit. The spike3 in this photograph have been retouched.
Fig. 3. The normalized responses of the DCMD to a moving 2° spot stimulus plotted as a function of the stimulus position in the visual field. The stimulus paths (indicated by overlap-ping arcs) each subtended 300 at the eye and were positioned along an arc in the donal/lateral region of the visual field of the eye. Their centres lay in a plane at 150 intervals from directly
[image:4.451.125.315.303.529.2]B
nimal, and the normalized data were pooled. Fig. 3 presents the mean and standardeviation of the normalized responses at each position. It is apparent from Fig. 3 that the DCMD is most responsive to moving stimuli in this plane when they are in an area that is between 40° and 8o° lateral from dorsal. Motion stimuli for all subsequent experiments were always centred around this region of peak responsiveness in the visual field of the cell.If a moving stimulus passes repeatedly over the same path in the visual field, the cell's response to successive stimuli wanes, and only recovers if stimulation in that part of the visual field ceases for several minutes. The cell has no consistent directional preference for moving stimuli, but as in the locust (Rowell, 1971a), a pseudo-directional preference can be induced by response habituation, when one direction (rather than its opposite) is chosen to begin a series of to-and-fro stimulus movements along the same path.
Many of these properties have also been found to characterize the response of the locust DCMD cell (Rowell, 1971 a). The similarity of the response properties of these identifiable locust and cockroach interneurones, and their similar projections to the contralateral thoracic connective (O'Shea et al. 1974), suggest that they are analogous, and perhaps homologous, cells.
The habituating effects of repetitive stimulation
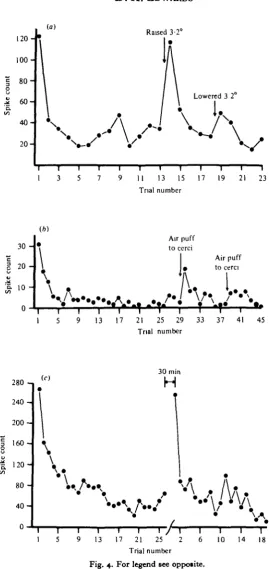
Repetitive presentation of either moving stimuli or 'on' and 'off' stimuli in the visual field of the DCMD caused the cell's response to decline with successive pre-sentations. In Fig. 4 (a), the number of DCMD spikes evoked by the motion of a small spot of white light through the visual field is plotted versus the number of the stimulus presentation. The spot subtended 2° at the eye, and moved at io°/s over a 50° path during each presentation. The interstimulus interval (ISI) was 45 s. The response fell rapidly from its initial value with the first few stimulus presentations, and approached a plateau that was about 20 % of the initial response. This decline is identical to the response habituation of the locust D CM D described by Rowell (1971a).
Localization of habituation to stimulated parts of the visual field
Response habituation of the cockroach DCMD is localized to that part of the visual field directly stimulated by the habituating stimulus. During the 13th ISI of the experimental series of Fig. 4(a), the path of stimulus motion was shifted 3-2° to a new path parallel to the first. The initial response after the shift was four times the habitu-ated response. Subsequent responses habituhabitu-ated at a rate comparable to the rate of habituation to stimuli presented along the original path. After five stimulus presenta-tions along the raised path, the stimulus was returned to the original path. A slightly enhanced response was evoked by the first stimulus following this return, while sub-sequent stimuli evoked responses that returned to the earlier habituated level. Similar increases in the DCMD response occurred in each of five other preparations when the stimulus path was shifted at least 30 away from the position where the DCMD response had become depressed during repetitive stimulation.
Each of these experiments was performed on a light-adapted animal (Methods). Cockroach photoreceptors have been found to have an acceptance angle of about 2-5°
1 2 0
1 0 0
-1 8 0
-o
•i «H
a. 4 0
2 0
-I -I \ f 1 I 1 II 13 15 17 19 21 23
Trial number
30
-Spi
k
o
(ft)
\
Air puff to cerci
Air puff to cerci
* - ^
k
I I I T
13 17 21 25 29 33 37 41 45 Trial number
280
240
2 0 0
1 6 0
80 4 0
-30 min
H
13
1
/ I 25 2 17 21
[image:6.451.107.377.68.638.2]Trial number
Fig. 4. For legend see opposite.
^when light-adapted (Butler & Horridge, 1973). The interommatidial angles in the P&rection of the shift of stimulus position have been found to be from 30 to 40 (Butler, 1973), and so the 30 shift should have caused the 2° stimulus to excite some ommatidia previously excited by the stimulus along the former path, as well as other ommatidia not previously excited by the stimulus. The significant increase in the response that occurs when the path of the stimulus is shifted implies that response habituation is restricted to the part of the peripheral visual nervous system that is directly excited by the habituation stimulus, and does not spread laterally to parts having adjacent visual fields. Distal to the site of habituation, therefore, the visual system of the cockroach, like that of the locust (Rowell, 1971 b), appears to be organized in a set of separate, parallel afferent channels that have visual fields comparable to that of a single ommatidium.
Dishabituation of a habituated DCMD response
The response of a previously habituated cockroach DCMD neurone can be in-creased by other methods than shifting the path of the stimulus in the visual field. If the animal is presented with a novel and sudden stimulus, either visual or non-visual, the next visual stimulus presented to the animal will often elicit a DMCD response that is significantly larger than the previously habituated responses. Fig. 46 presents data from an experiment in which the previously habituated DCMD re-sponse was enhanced, or dishabituated, after a brief puff of air was delivered to the abdominal cerci during the interval between the 29th and 30th stimulus presentations. This is similar to the dishabituation of the locust DCMD response (Rowell & Horn, 1968). The effectiveness of the air puff was much reduced when it was delivered again, nine stimulus presentations after the first puff. This habituation of the dishabituation occurs upon repetitive presentations of all dishabituating stimuli.
The dynamics of habituation
If the amplitude of the DCMD response is reduced by a series of frequent, identical stimuli, a subsequent period without stimulation will allow the responsiveness of the cells to recover. Once recovered, the response will again habituate to another series of stimuli. This can be seen in Fig. 4(<r), which presents the response to two such trains of identical stimuli. The ISI for both stimulus trains was 45 s, and the first stimulus
12
1 0
08
06
04
02
-1 2
I 4
1
6
I i 8 10 Time (nun)
[image:8.451.105.323.77.256.2]12 14 16
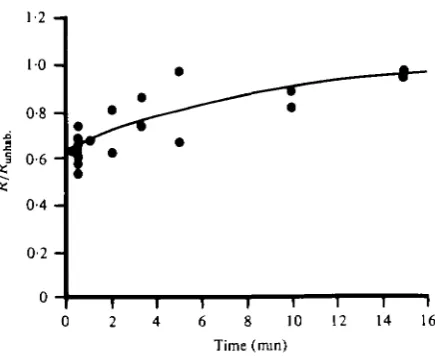
Fig. 5. A 'paired-stimulus' experiment which used the responses to pairs of sequential stimuli to plot the response habituation and recovery from a single stimulation of the D C M D . Of each pair, one stimulus was presented to an unhabituated animal to establish the unhabituated response amplitude, R(o). A second stimulus presented at a variable interval t after the first evoked the response R(t). Twenty min passed between each stimulus pair to permit the D C M D to recover the unhabituated state. The ratio R(t)/R{p) provides a measure of the recovery from the habituation that results from a single stimulus. The continuous line is described by equation 1 with A = 0-37 and T = 8 5 3 min.
of the second train followed the last stimulus of the first after 30 min. That time was sufficient to allow the initial response of the second series to recover completely from the habituated response plateau reached at the end of the first stimulus series.
The time-course of recovery from habituation can be determined from a ' paired-stimulus' experiment (Fig. 5). A pair of stimuli separated by a variable time interval were presented and the response of the DCMD to the second stimulus was plotted as a fraction of the response to the first stimulus v. that time interval. Once the animal had recovered from the habituating effects of one stimulus pair, another pair was presented, separated by a different time interval. The resulting plot of response ratios as a function of stimulus interval describes the time-course of recovery of the DCMD's response from the habituation evoked by a single stimulus. The interval between pairs wa3 determined by the time needed to achieve recovery from habituation. In two of the animals tested that interval was 20 min, while in the third it was 30 min.
The plot of Fig. 5 describes the time-course of both the habituating effect of each stimulus and the recovery from the effect. The data points in Fig. 5 can be fitted by an exponential curve (continuous line) described by equation 1,
R(o) = i-Aexp[-t/T],
(0
f
uses the DCMD's responsiveness to fall quickly to about 60% of the pre-stimuluslue, and then to recover along an exponential curve having a time constant of 8-5 min.Equation 1 and these values of A and T can be used in a simple model to predict the time-course of habituation of the DCMD's response to repetitive stimulation. The model assumes that the amplitude of the DCMD's response to a stimulus is a measure of the responsiveness of the DCMD at that time. It also assumes that immedi-ately after a response, the DCMD's responsiveness drops to a fraction 1 — A of its immediate prestimulus value, and then recovers along an exponential curve with a time constant T towards the unhabituated level. With these assumptions, the re-sponsiveness, r(t), following the nth stimulus in a series, can be given by a modified form of equation 1,
r(t) = r(oo)-[r(oo)-r(«n+)] exp [-(t-tn)/T], (2)
for times t greater than the time of the nth stimulus, tn. r(oo) is the unhabituated level
of responsiveness, which also equals the level approached at long times following the stimulus. r(tn+) equals the responsiveness immediately following the nth stimulus, and
can be given by equation 3,
r(tn+) = (i-A)r(tn), (3)
which restates the assumption that the immediate post-stimulus level of responsive-ness is equal to the fraction i—A times the immediate pre-stimulus level, r(tn).
Finally, the assumption that the DCMD's response to the nth stimulus, Rn equals the
responsiveness at that time is expressed by equation (4):
*« = r(tn). (4)
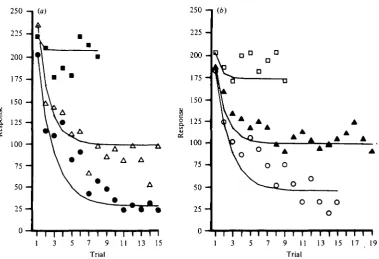
Having determined values for A and T, equations (2-4) were used to predict the responses of this same DCMD neurone to trains of stimuli having different inter-stimulus intervals. The continuous line in Fig. 6 represents the predicted time-course of the same DCMD's responsiveness to a train of stimuli having an ISI of 2 min. Beginning at the unhabituated level responsiveness, as determined by the first response (240 spikes/stimulus pass), the responsiveness immediately dropped to the fraction (1— A) of that level, as decribed by equation (3). The responsiveness then began to recover towards the unhabituated level according to equation (2). A second stimulus was presented at / = 2 min. The predicted response is given by equation 4, and is represented in Fig. 6 by the open circle at f = 2 min. The experimental response at that time is given by the closed circle. The responsiveness then dropped again to the fraction (1 — A) of the 2 min level, and began to recover once more. The time-course of the responsiveness and the responses of the DCMD to this train of stimuli were predicted by repeated application of this algorithm, and compared to the experimentally recorded responses of the same cell. The predicted and experimental responses are in general agreement; both the rate of fall and the plateau level of the experimental response are similar to the predicted values.
240
220
200
180
160
140
120
100
8 0
60
40
2 0
-0
12 Time
i I i 16 (min)
1 1 20 24
I 28
Fig. 6. Theoretical and experimental time-course of DCMD response habituation to repetitive stimulation at i min I SI. Closed circles: experimental response values expressed as the number of spikes evoked per stimulus pass. Open circles: predicted values. Solid line: theoretical time-course of DCMD responsiveness to repetitive stimulation at a 2 min ISI. Same animal as in experiments of Figs. 5 and 7.
the predicted responses of the cell for each of the trains of stimuli, and do not plot the time-course of responsiveness as in Fig. 6.) Very little response habituation was pre-dicted for stimulus trains having ISIs of 10 min and 15 min, and very little habitu-ation occurred. The plateau response levels were predicted for trains of all ISIs; the rates of fall of the responses to stimulus trains with shorter ISIs were slightly greater than was predicted. With this reservation, the agreement between experiment and prediction is very good.
Similar results were obtained with two other animals which had similar values of
A and T (Ax = 0-48, 7\ = 11 9 min; At = 0-37, Tt = 8-54 min). These results
250 225 200 175 -150 —
I '
25
~
OS
100
-75
-50
-25 -0
I I I T I T 1 I I T T T T I 1 I I 3 5 7 9 11 13 15 17 19
[image:11.451.38.418.75.334.2]Trial
Fig. 7. Predicted and experimental DCMD responses (number of spikes per stimulus pass) to trains of stimuli having different ISIs. (a) • , 15 min ISI; A, 2 rnin ISI; • , 30 s ISI. (6) D, 10 min ISI; A, 3 min ISI; Oi 1 min ISI. The continuous lines connect the responses pre-dicted for each stimulus series. Same animal as in experiments of Figs. 5 and 6.
Spectral response properties of the cockroach DCMD
The ommatidia of the dorsal part of the compound eye of Periplaneta americana con-tain two classes of photoreceptor cells that differ in their spectral sensitivities (Mote & Goldsmith, 1970). The two types are about equally sensitive at their respective wave-lengths of maximum sensitivity (Amax), which are 365 nm (u.v.-sensitivity photo-receptor) and 507 nm (green-sensitive photophoto-receptor). The two cell types occur within the same ommatidium (Mote & Goldsmith, 1971) in the ratio 3 u.v. 15 green (Butler,
1971).
Movement detector interneurones in the optic lobe of the honeybee are excited by only one of three spectral classes of receptor cells (Kaiser, 1972; Menzel, 1973). In contrast, other high-order visual interneurones receive convergent spectral inputs (Kien & Menzel, 1977a, b; Erber & Menzel, 1977). Consequently, it is of interest whether the information made available to the cockroach central nervous system by the two photoreceptor types is used by the DCMD neurone.
1 0 •
0 - 8 '
a o 6
-0 _
1 0 4
02
-• 546 nm D 436 nm O 365 nm
- 3 - 2 - 1
[image:12.451.93.347.112.277.2]Log I
Fig. 8. Response v. log / plots with three monochromatic stimuli: 365 nm, 436 nm, 546 nm. Straight line is drawn by eye. Response maximum (i-o) for all three stimulus wavelengths was 335 spikes per stimulus pass. The superposition of the response plots for all three stimulus wavelengths indicates that the D C M D is equally sensitive to these three wavelengths.
3 min i.s.i. 10 s i.s.i. 15 s i.s.i. I 1*5 min I h I I
1008 0
£ 60
-I
* 40
20
-o -oa
^T"^T^^^^^^^^^^^^^^^^^T^^ff^r^^r^^n
10 15
Trial
20 25 30
[image:12.451.116.339.354.543.2]representative set of plots is presented in Fig. 8. The response v. log / plots for the Ihree different wavelengths superimpose, which indicates that the DCMD is
approxi-mately equally sensitive at all three wavelengths.
The u.v.-sensitive photoreceptors are very insensitive to 546 nm light, while the green-sensitive photoreceptors are about six times more sensitive to 546 nm light than to 365 nm light (Mote & Goldsmith, 1970). Consequently, the equal sensitivity of the DCMD at the three wavelengths tested means that the DCMD receives excitatory input from both types of photoreceptor. This result, when considered with the observation that the spike trains evoked by the three monochromatic stimuli have no obvious distinguishing features, suggests that the DCMD does not discriminate colour. The convergence of spectral inputs acts to extend the range of photosensitivity of the cell.
The convergence of signals from the u.v.-sensitive and green-sensitive photo-receptors takes place distal to the site of habituation in the afferent path to the DCMD. This conclusion derives from the experiment of Fig. 9, in which the DCMD was first habituated by repetitive stimulation with 546 nm light, which excites only the green-sensitive photoreceptors, and then tested with 365 nm light, which preferentially excites the u.v.-sensitive photoreceptors. The 365 nm stimuli that were presented immediately after the habituating series of 546 nm stimuli evoked small, habituated DCMD responses. After J h of no stimulation, both 365 and 546 nm stimuli evoked full, unhabituated DCMD responses. It is apparent that the habituation produced by excitation of the DCMD through the green-sensitive photoreceptors also affects the excitation produced by the u.v.-sensitive photoreceptors. This result suggests that the locus of habituation along the afferent path to the DCMD is proximal to the point of convergence of the spectral inputs.
DISCUSSION Analogy with the locust cell
Parameters determining the time-course of response habituation
In Fig. 7 the time-course of DCMD responses to trains of stimuli are predicted by equations (2-4), given the values of A and T determined for the same animal in Fig. 5. The parameter A provides a measure of the loss of DCMD responsiveness which each stimulus, or the response to each stimulus, produces. T is the time constant for the recovery of DCMD responsiveness to the unhabituated state. Although the DCMD response derives from stimulation of many ommatidia, the site-specificity of habituation (Fig. 4 a) suggests that A and T refer to events occurring in individual afferent channels to the DCMD.
Habituation and the depletion model of synaptic depression
It is interesting to note that equations 2-4 are nearly identical to the equations used by the depletion hypothesis model of synaptic depression, which describes how the amount of transmitter available for release varies with time during a bout of repetitive stimulation. In its usual form (Martin, 1966; Zucker & Bruner, 1977), the depletion hypothesis suggests that each presynaptic impulse causes the release of a fixed fraction of the currently available store of transmitter, and that this store is replenished along an exponential time-course during the interval between impulses. Specifically, if the amount of transmitter available at time t is S(t), then the recovery curve following the nth impulse is given by
S(t) = 5(oo)-[5(co)-5(«n+)] exp [-(t-tn)/T], (5)
for t greater than tn S(oo) is the undepleted store, while tn and T have their previous meanings. S(tn+), which is the newly depleted level of transmitter following the nth
impulse, can be given by
, (6)
where F is the fraction of the transmitter store released by the impulse. The response (which equals the amount of transmitter released) evoked by the nth stimulus is
*» = FS(tn). (7)
^transmitter than the rapid recovery processes (having time constants of 8-12 min) were capable of retrieving, and some synthetic machinery, having much longer time-constants, had to be engaged. Until the kinetics of longer term habituation are studied, however, the relation between long and short term habituation will remain speculative. The amplitudes of the DCMD's responses to trains of stimuli that have short ISI's (Fig. ja, b) fall less rapidly than is predicted by the model. This difference may be due to random experimental variation, or it may be due to some other factors) that is important when cells are called upon to respond frequently. For instance, if the rate of recovery following each response [i/T, equations (2) and (5)] increases transi-ently when stimuli are presented frequtransi-ently, several responses following the first few of a series would be transiently larger than predicted by the original model. In terms of the depletion model, such a transient increase in the recovery rate would occur if the rate of synthesis or uptake of transmitter were increased transiently in the affected terminals following rapid depletion. As before, these possibilities remain speculative at this time.
Experimental confirmation of transmitter depletion as the mechanism that underlies habituation in this system requires a quantal analysis of synaptic transmission at the relevant synapses. It is necessary to show that it is a decline in the binomial release parameter n (which equals the amount of transmitter available for release), and not
p (which equals the probability of release), which correlates with synaptic depression.
Such tests are made more difficult by the need to control for possible non-uniformities and non-stationarities in the parameters that govern release (Brown et al. 1976; Perkel & Feldman, 1979). Fluctuations in the real values of those parameters in space and time may lead to erroneous estimates of n and p, which may falsely confirm or deny the depletion hypothesis.
Convergence of spectral inputs
A wide variety of arthropod visual interneurones receive convergent spectral in-puts : the sustaining fibres of crayfish (Woodcock & Goldsmith, 1970), the large mono-polar cells (LMCs) of the dragonfly lamina (Laughlin, 1956), and a large assortment of high-order cells in the medulla, lobula and protocerebrum of bees (Kien & Menzel, 1977a, b; Erber & Menzel, 1977). Spectral convergence takes a number of forms, the simplest being that shared by the cockroach DCMD, dragonfly LMCs and inter-neurone P3 of the medulla and lobula of the bee (Kien & Menzel, 1977 a): the re-sponse/log / plots for different monochromatic lights are parallel, and the responses to different spectral inputs sum in the same manner. Other forms of convergence found in the bee are characterized by oddly skewed monochromatic response/log / plots or by opponent colour effects (Kien & Menzel, 1977a, b). These last properties characterize the behaviour of high-order neurones that are probably involved in colour discrimination; their characteristics are probably the result of interactions among lower-order cells, like the LMCs, which show the simpler forms of convergence. It might be expected, therefore, that the simpler form of convergence which character-izes the DCMD response occurs peripherally along the afferent path to the cell.
be-cause the response/log / plots for the two types of cockroach photoreceptors are also| parallel (Mote & Goldsmith, 1970), and therefore the afferent signals from both" photoreceptors must be transformed identically between the periphery and the site of
convergence to enable the plots of Fig. 8 to be parallel. The identical transformation of signals along separate paths seems unlikely unless the paths are short, consequently the site of convergence should be near the periphery.
In a teleonomic sense, therefore, the cockroach DCMD neurone receives excitation from both types of photoreceptor merely to enhance and broaden its sensitivity. This is consistent with its role as a high-speed transmission line carrying information about novel (and perhaps threatening) events in the visual field to the motor centres of the thorax.
I wish to thank Dr Timothy H. Goldsmith for his helpful guidance through the duration of this project, which was supported by NIH reesearch grant USPHS EY00222 to Dr Goldsmith. I would also like to thank Dr Brian Mulloney for many helpful suggestions with the manuscript, and Dr Donald Kennedy for much support and encouragement.
REFERENCES
BROWN, T. H., PERKEL, D. H. & FKLDMAN, M. W. (1976). Evoked neurotransmitter release: statistical
effects of nonuniformity and non-atationarity. PTOC. natn Acad. Sci. U.S.A. 73, 2913-2917. BUTLER, R. (1971). The identification and mapping of spectral cell types in the retina of Periplaneta
americana. Z. vergl. Phytiol. 7a, 67—80.
BUTLER, R. (1973). The anatomy of the compound eye of Periplaneta americana L. 1. General features. J. comp. Phytiol. 83, 223-238.
BUTLER, R. & HORRIDOE, G. A. (1973). The electrophysiology of the retina of Periplaneta americana L. 1. Changes in receptor acuity upon light/dark adaptation. J. comp. Phytiol. 113, 17-34.
EDWARDS, D. H. (1982). The cockroach DCMD neurone: I. Lateral inhibition and the effects of light-and dark-adaptation. J. exp. Biol. 99, 61-90.
ERBER, J. & MENZEL, R. (1977). Visual interneurons in the median protocerebrum of the bee. J. comp. phytiol. iai, 65-77.
KAISER, W. (1972). A preliminary report on the analysis of the optomotor system of the honey bee -single unit recordings during stimulation with spectral lights. In Information Procetting in the Visual Syttem of Arthropods (ed. R. Wehner), pp. 167-170. Berlin, Heidelberg, New York: Springer-Verlag. KIEN, J. & MENZEL, R. (1977a). Chromatic properties of interneurons in the optic lobes of the bee.
I. Broad band neurons. J. comp. phytiol. 113, 17-34.
KIEN, J. & MENZEL, R. (19776). Chromatic properties of interneurons in the optic lobes of the bee. II. Narrow band and colour opponent neurons. J. comp. Phytiol. 113, 35-53.
LAUOHLIN, S. B. (1976). Neural integration in the first optic neuropile of dragonflies. IV. Intemeuron spectra] sensitivity and contrast coding. J. comp. Phytiol. n a , 199—212.
MARTIN, A. R. (1066). Quantal nature of synaptic transmission. Phytiol. Rev. 46, 51-66.
MENZEL, R. (1973). Spectral response of moving detecting «nd 'sustaining' fibers in the optic lobe of the bee. J. comp. Phytiol. 83, 135-150.
MOTE, M. I. & GOLDSMITH, T. H. (1970). Spectral sensitivities of the color receptors in the compound eye of the cockroach Periplaneta americana. J. exp. Zool. 173, 137-146.
MOTE, M. I. & GOLDSMITH, T. H. (1971). Compound eyes: localization of the color receptors in the same ommatidia. Science, N.Y. 171, 1254-1255.
O'SHEA, M., ROWKLL, C. H. F. & WILLIAMS, J. L. D. (1974). The anatomy of a locust visual
inter-neurone: the descending contralateral movement detector. J. exp. Biol. 6o, 1-12.
O'SHEA, M., & ROWELL, C. r £ F. (1976). The neuronal basis of a sensory analyzer, the acridid movement detector system. II. Response decrement, convergence, and the nature of the excitatory afferents to the fan-like dendrites of the LGMD. J. exp. Biol. 65, 289-308.
PERKEL, D. H. & FELDMAN, M. W. (1979). Neurotransmitter release statistics: Moment estimates for inhomogeneous bernoulli trials. J. math. Biol. 7, 31-40.
ROWELL, C. H. F. & HORN, G. (1968). Dishabituation and arousal in the response of single nerve cells I in an insect brain. J. exp. Biol. 49, 171-183.
ROWKLL, C. H. F. (1971a). The orthopteran descending movement detector (DMD) neurones: A characterization and review. Z. vergl. Physiol. 73, 167-194.
ROWBLL, C. H. F. (19716). Antennal cleaning, arousal and visual interneurone responsiveness in a locust. J. exp. Biol. 55, 740-761.
WOODCOCK, A. E. R. & GOLDSMITH, T. H. (1970). Spectral responses of sustaining fibers in the optic tracts of crayfish (Procambarut). Z. vergl. Physiol. 69, 117-133.