_____________________________________________________________________________________________________
*Corresponding author: E-mail: [email protected];
(Past name: British Journal of Medicine and Medical Research, Past ISSN: 2231-0614, NLM ID: 101570965)
Development of a Theoretical Model for the
Appreciation of the Perception of Quality of Work
Life and Occupational Stress, and Its Validation
through Statistical Analyses
Sabrine Battal
1*, Taoufiq Fechtali
1and Saida Toufik
11
Laboratory of Biosciences, Integrated and Molecular Functional Exploration, Sciences and Technologies Faculty, Mohammedia, University Hassan II of Casablanca, Morocco.
Authors’ contributions
This work was carried out in collaboration between all authors. Author SB designed the study, performed the statistical analysis, wrote the protocol, wrote the first draft of the manuscript and managed the literature searches. Authors ST and TF managed the analyses of the study.
All authors read and approved the final manuscript.
Article Information
DOI: 10.9734/JAMMR/2017/35959
Editor(s):
(1) Kate S. Collison, Department of Cell Biology, King Faisal Specialist Hospital & Research Centre, Saudi Arabia.
Reviewers:
(1) Ibrahim El-Zraigat, The University of Jordan, Jordan. (2)José Carlos Rosa Pires de Souza, Mato Grosso do Sul State University, Brazil. Complete Peer review History:http://www.sciencedomain.org/review-history/20554
Received 4th August 2017 Accepted 13th August 2017 Published 19th August 2017
ABSTRACT
The present study describes the development of a theoretical model and a questionnaire measuring the perception of Quality of Worklife (QWL) and Occupational Stress (OS), as well as their validation through statistical analyses.
The model and questionnaire are simulated on the field, in an aircraft manufacturing company in Morocco. Validity of the construct, internal coherence and stability in time are measured.
The results of this study show satisfactory psychometric properties and demonstrate the validity of the questionnaire and the developed model.
Keywords: Quality of work life; occupational stress; theoretical model; questionnaire development; questionnaire validation; psychometric properties.
1. INTRODUCTION
Occupational Stress (OS), is incriminated in the advent of mental disorders [1] and psychosomatic manifestations such as anxiety, concentration and sleep disorders [2]. International studies have also reported deterioration in the workers’ physical health. Indeed, (OS) has been identified as risk factor for musculoskeletal disorders [3,4], the risk of type 2 diabetes, which increases in people exposed to (OS) [5], and cardiovascular diseases [6].
On the other hand, there is a clear link between work stress and increased absenteeism, increased turnover, and decreased productivity and performance [7].
Indeed, a study analyzing the scientific literature shows that the financial costs of professional stress and psychosocial risks are considerable. It also reports that prevention interventions are often cost-effective (EU-OSHA), 2014)) [8].
In addition to (OS) , the notion of Quality of WorkLife (QWL) suggests a positive orientation of research in this direction, being negatively and significantly related to occupational stress, which could be a determinant of it [9].
In addition to factors related to the work environment, the QWL takes into account general well-being [10] a significant positive link is found between QWL and work performance [11].
Given the importance of taking into account occupational stress and QWL, a preliminary investigation is a key step prior to the implementation of an action plan aimed at preventing workers' health.
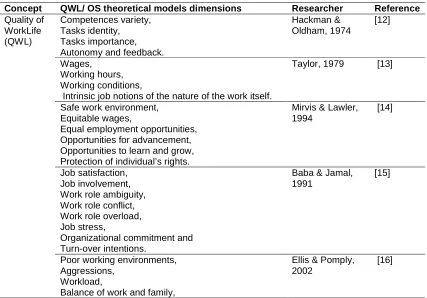
International researchers have looked at this issue to determine the dimensions of occupational stress and QWL. The following table (Table 1) summarizes the experts in the field, their theoretical models and QWL and occupational stress dimensions.
Table 1. QWL and occupational stress dimensions according to experts
Concept QWL/ OS theoretical models dimensions Researcher Reference Quality of
WorkLife (QWL)
Competences variety, Tasks identity, Tasks importance, Autonomy and feedback.
Hackman & Oldham, 1974
[12]
Wages, Working hours, Working conditions,
Intrinsic job notions of the nature of the work itself.
Taylor, 1979 [13]
Safe work environment, Equitable wages,
Equal employment opportunities, Opportunities for advancement, Opportunities to learn and grow, Protection of individual’s rights.
Mirvis & Lawler, 1994
[14]
Job satisfaction, Job involvement, Work role ambiguity, Work role conflict, Work role overload, Job stress,
Organizational commitment and Turn-over intentions.
Baba & Jamal, 1991
[15]
Poor working environments, Aggressions,
Workload,
Balance of work and family,
Ellis & Pomply, 2002
Concept QWL/ OS theoretical models dimensions Researcher Reference Shift work,
Lack of involvement in decision making, Professional isolation,
Lack of recognition,
Poor relationships with supervisor/peers, Role conflict,
Lack of opportunity to learn new skills. Work aspects,
Culture/climate, Health,
Working hours,
Balance of work and family, Benefits,
Supervision, Union,
Other dimensions such as performance, satisfaction, Implication, flexibility and extra time.
National Institute for Occupational Safety and Health (NIOSH) & National Science Foundation, 2013
[17]
Occupatio nal Stress (OS)
Job demand1,
Job decision latitude2, Social support.
Robert Karasek, 1979
[18]
Work nature : monotony, lack of autonomy, Work conditions : Exposure to nuisance, Terms of employment,
Social relations at work.
Kompier & Levi, 1995
[19]
Task variety, Task identity, Task impact, Autonomy, Task feedback, Peer feedback, Role clarity, Role conflict.
Rolland J.P & Perez-Langervin.V, 1995
[20]
« Effort » scale,
« Reward » scale including wages, esteem and control on the professional status,
"Over-investment" scale including the inability to get away from work and the difficulty in relaxing after work.
Johannes Siegrist, 1996
[21]
General work load, Actual work load, Pressure at work, Request,
Control over work, Participation,
Social support from the hierarchy, Social support from colleagues, Professional future.
Cail, Morel & Aptel, 2000
[22]
Necessary resources, Task management, Risks management, Work planification, Time management, Future.
Hansez & De Keyser, 2001
[23]
1 Job demand refers to psychological work load.
In view of the complexity of (QWL) and (OS), and the lack of an exhaustive coverage of their dimensions, as well as the lack of theoretical models answering the demands and dynamics of rapid changes in the work place, new interferences of certain elements of the (QWL) and the (OS) must be investigated by new models and new assessment tools. Investigations based on models with a larger number of variables and dimensions should be multiplied [24]. Indeed several studies have to rely on the combination of multiple models and questionnaires in order to assess occupational stress such as the national study in France [25].
Thereby, this study aims to develop a theoretical model taking into account an exhaustive set of (QWL) and (OS) dimensions, inspired from internationally recognized models (Table 1). This model will lead to the construction of a hybrid questionnaire of (QWL) and (OS) in order to allow a concrete assessment of the preceding, through the dimensions set by the theoretical model developed. This questionnaire will then be validated according to international requirements through statistical analyses.
In order to bring proof of validation of the questionnaire developed, the following questions should be answered through statistical analyses.
a. Is the questionnaire able to assess the subject of the study?
b. Are the items of the questionnaire homogenous, how closely related the set of items are as a group?
c. Is the questionnaire stable in time? Can it ensure consistency of results over two weeks intervals?
2. MATERIALS AND METHODS
The theoretical model for the measurement of the QWL and SP, is first developed according to the data existing in the scientific
literature. Following this, a questionnaire is built in order to concretize the design resulting from the mathematical model. And finally, the validation of this model is done through a simulation in the field, during which, the questionnaire is subjected to investigations. The aim is to analyze the results and statistically validate the model.
2.1 Development of a Theoretical Model of QWL and OS
To better understand QWL and OS dynamics, existing theoretical models explaining these two phenomena (Table 1) are gathered in order to develop a mathematical design. The aim is to identify the dimensions used in the measurement of QWL and stress score and to deduce a simple and exhaustive (Fig. 1).
The most relevant dimensions of QWL and OS to the purpose of this study are set into a simplifying scheme: Karasek model, Siegrist model, Kompier & Levi model, Hackman & Oldham model, Mirvis & Lawler model and NIOSH model. The design of the theoretical model is then deduced from each model of the input, in the aim to propose an exhaustive dimensions set of QWL and OS.
According to the design fore-mentioned, QWL can be defined as the positive combination of factors related to work content, Physical environment of work, Social and relational environment and Balance between work and personal life.
OS on the other hand, is the negative combination of the previous factors.
2.2 Realization of the Theoretical Model through Questionnaire Construction
2.2.1 Version I of the questionnaire
In order to validate the theoretical model developed, it must be made concrete by a questionnaire which will be submitted to validation through statistical analyses.
For the purpose of the questionnaire development, this study is inspired by the methodology proposed by Dussault and Al in 2007 [26], itself inspired by DeVellis in 2003 [27].
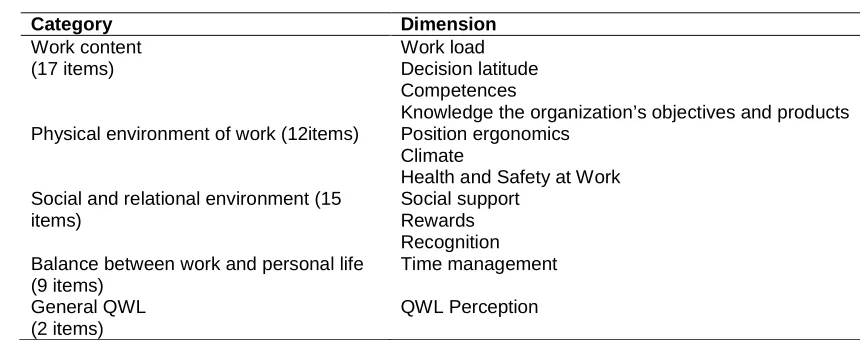
As described in the development of the theoretical model, factors that can influence QWL are noted (Table 1). The selected dimensions are then classified into four main categories (Table 2):
Work content,
5
With:
JS: Job strain, occupational stress according to Karasek model. IS : Iso Strain, combination of Job strain and social support
JD : Job Demand DL : Decision Latitude SS : Social Support HS : Hierarchical Support E : Effort
R : Reward
LDL : Lack of Decision Latitude EN : Exposure to nuisance PET : Poor Employment Terms
C: Competences
VC : Variety of Competences TI : Task Identity
ER : Ergonomics
EO : Evolution Opportunities CL : Climate
HSW : Health and Safety at Work WT: Work Timetable
PPB : Personal and Professional life Balance U : Union
QWL: Quality of Work Life OS: Occupational Stress
Fig. 1. Theoretical model of QWL and OS INPUTS
Input1: Karasek Input2: Siegrist
Input3: Kompier & Levi
Input4: Hackman &
Oldham
Input5: Mirvis & Lawler
Input6:NIOSH
EQUATIONS
Equation1: JS =JD/(DL + C)
IS = Job strain/ (SS+HS) Equation2: SP= E/R
Equation3: SP=LDL+EN+PET +SS Equation4: QVT=VC+JD+TI+DL Equation5: QVT=E+R+EO Equation6: QVT=CT+ CL+HSW+WT+PPB+DL+R+U
DESIGN Knowing that: QWL= -OS QWL= JD+ DL+
Table 2. QWL and occupational stress dimensions by categories
Category Dimension
Work content (17 items)
Work load Decision latitude Competences
Knowledge the organization’s objectives and products Physical environment of work (12items) Position ergonomics
Climate
Health and Safety at Work Social and relational environment (15
items)
Social support Rewards Recognition Balance between work and personal life
(9 items)
Time management
General QWL (2 items)
QWL Perception
The questions for each item are formulated on the basis of the existing questionnaires quoted above, in addition to a general question on the perception of (QWL).
The response scale chosen is that of 5 points Likert (strongly disagree, disagree, agree or disagree, agree, strongly agree). This scale is often used in similar studies [28,29].
2.2.2 Version II of the questionnaire
Version II of the Questionnaire measuring the Perception of QWL and (OS) is the result of the validity of the content (Face validity). Indeed, the questionnaire and a part investigating socio-demographic and professional characteristics are submitted to three experts, a professor in Psychology and Psychometric affiliated to the Faculty of letter and Humanities Dhar el Mahraz in Fès, the Director of Human Resources in a research center in Rabat, and a doctor epidemiologist at the Ibn Sina hospital in Rabat. Following this consultation, the following elements are modified:
In the section on socio-demographic and professional characteristics, the choice of the family situation, the years of experience and the years of studies are modified and detailed.
The scale of choice of the questions appreciating the general (QWL) is changed from a 5 points Likert scale to a YES or NO answer.
The addition of an open-ended question investigating respondents' suggestion of other factors influencing (QWL) not cited in the questionnaire.
Designation of categories and dimensions is removed. Only items requiring a response are included in the questionnaire.
2.2.3 Version III of the questionnaire
Version III of the questionnaire is the result of a pre-test of 17 people.
Participants completed version II of the questionnaire as well as a letter of explanation and consent.
Following this consultation, the following elements are modified:
3 respondents testified a 3-point Likert scale would be better than the 5-point Likert scale. But this has not been taken into account given that similar psychometric studies use this 5 point Likert scale and are highly recommended [30] Item 1 is simplified in the vocabulary used,
replacing "requires" with "request".
Item 5 is deleted as it expresses exactly the same as Item 4.
Item 15 was omitted by several people; we suspected the layout for this omission. The questionnaire with a better layout is submitted to 5 people. The exclusion of this item is no longer done, so we keep the item and the new layout.
5 items were deleted to simplify the questionnaire
2.3 Participants
model is an aerospace equipment manufacturing company in Morocco.
The criteria for inclusion of responses in the validation process are: Being a full time employee, having a permanent contract and accepting participation in the survey.
2.4 Procedure
The validation process of the theoretical model is carried out on version III of the questionnaire. The survey is conducted by distributing questionnaires and a letter of explanation and consent to all personnel of the aerospace company.
An authorization demand was filed and validated by the company’s general management.
The questionnaires administered to the participants were completed autonomously. Volunteering, anonymity and the confidentiality of the information gathered were underlined. The questionnaires were collected 7 days after distribution. The duration of a similar study may take one day [31] or even an indefinite period until the questionnaire is completed by the entire target population [2,32]. For the purpose of our study, we decided that it was appropriate to determine the duration at one week.
2.5 Data Analysis and Validation of the Theoretical Model
SPSS Version 20 software is used to statistically analyze data collected on the field.
2.5.1 Descriptive analysis
The surveyed population’s characteristics are investigated by highlighting the size of each of the properties concerned: Age, gender, family situation, level of education and seniority in the company.
2.5.2 Construct validity
Validity of the construct is made through the matrix of coherences. Correlation coefficients are
established between the main parts of the questionnaire (Table 3). It allows to establish to what extent the data collected adjust to the theoretical model on which the questionnaire is based. It also shows the ability of the questionnaire to assess the subject of the study, and therefore will answer to the study question a.
2.5.3 Internal consistency
Internal consistency is analyzed to determine the degree of interrelationship between the main parts in the questionnaire. It allows knowing if the items measuring the construct converge and are homogeneous. The coefficient of Cronbach alpha (α), that measures how closely related a set of items are as a group, is used to assess this component.
2.5.4 Stability over time
Test-retest method is used to assess the reliability of the questionnaire and give proof of its stability over time. It is measured through the correlation score of Pearson. One category of the population is selected: men of top management. The questionnaire was administered at two weeks intervals from the first administration to this category.
3. RESULTS
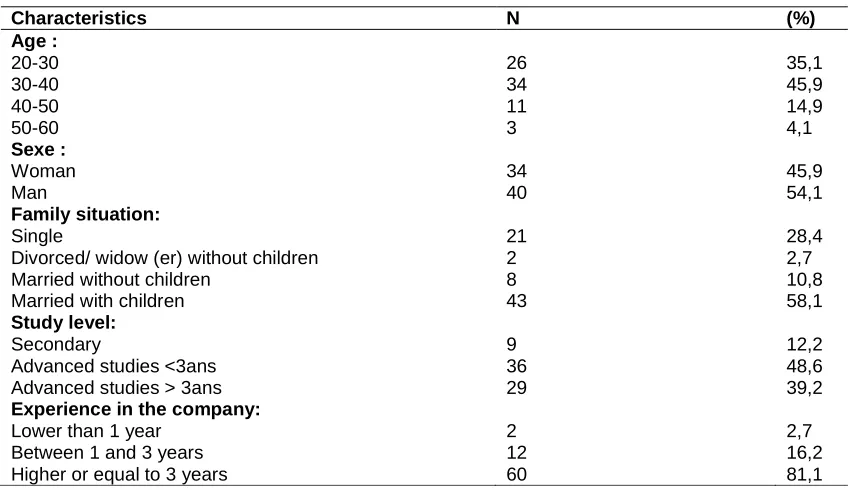
3.1 Characteristics of the Study Population
74 respondents answered the questionnaire. Participants are mostly between 30 and 40 years old (45.9%), followed by 20-30 year old (35.1%). Men are slightly more than women to participate to this survey (54%) versus (45.9%) of women. The major family situation of respondents is “married with children” with a prevalence of (58.1%). (39.2%) have a study level of 3 years or more, (48.6%) have less than 3 years and (12.2%) did not exceed the secondary level. Most respondents have an experience in the company of 3 years or more (81.1%).
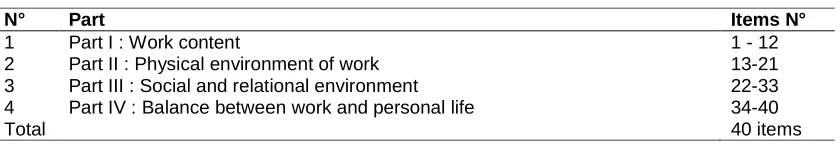
Table 3. Main parts of the questionnaire and relative items
N° Part Items N°
1 Part I : Work content 1 - 12
2 Part II : Physical environment of work 13-21
3 Part III : Social and relational environment 22-33 4 Part IV : Balance between work and personal life 34-40
Table 4. Socio-demographic characteristics of the population
Characteristics N (%)
Age : 20-30 30-40 40-50 50-60
26 34 11 3
35,1 45,9 14,9 4,1 Sexe :
Woman Man
34 40
45,9 54,1 Family situation:
Single
Divorced/ widow (er) without children Married without children
Married with children
21 2 8 43
28,4 2,7 10,8 58,1 Study level:
Secondary
Advanced studies <3ans Advanced studies > 3ans
9 36 29
12,2 48,6 39,2 Experience in the company:
Lower than 1 year Between 1 and 3 years Higher or equal to 3 years
2 12 60
2,7 16,2 81,1
3.2 Construct Validity
Table 5 shows that all inter-correlations between items range from (0.119) to (0.283*), and most correlations are statistically significant at (0.05, 0.01). It is found that these correlations are weak and respect the norm (lower than 0.6), which means the existence of the structural validity of the items.
Table 5 also shows that all correlation coefficients for items to the whole scale range from (0.292 *) to (0.757 **), and all correlations are positive and statistically significant at (0.05, 0.01), which confirms the existence of structural validity for the questionnaire in general, and also seems to approve the validity of the questionnaire and its ability to measure the subject of the study.
3.3 Internal Consistency
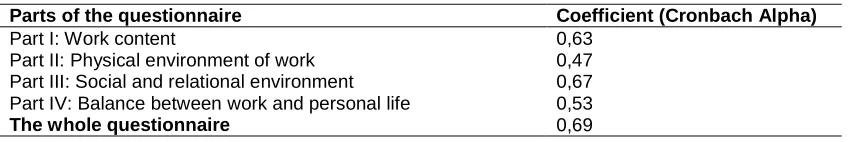
Table 5 shows that Cronbach Alpha coefficient is considered satisfactory. The value of the first part (0.63), the second part (0.47), the third part (0.67) and the fourth part (0.53). For the whole scale, the value of Cronbach coefficient is (0,69) which is considered high and which proves a satisfactory internal consistency of the questionnaire.
3.4 Stability Over Time
Results of test-retest method at two-weeks interval as demonstrated in Table 7 shows a high Person coefficient (r ) for the work content part (0.819) significant at 0.05, followed by Social and relational environment part (0.78), followed by the balance between work and personal life part (0.714), significant at the level of 0.05, and finally the physical environment of work (0.120). These results show a good Stability over time for the parties: Content of work, social and relational environment, and balance between work and personal life, but not for the physical environment of work.
4. DISCUSSION
QWL is a multidimensional concept depending on a variety of factors [33]. It is negatively and significantly related to OS, which could be a determinant of it [9]. Indeed, the absence of stress is considered as parameter of (QWL) [34].
Table 5. Correlations between items and with the whole scale
Correlations
Parties du questionnaire PartI PartII PartIII PartIV Total
Part I: Work content 1 -,026 ,281* ,119 ,683**
Part II: Physical environment of work -,026 1 ,033 -,133 ,292* Part III: Social and relational environment ,281* ,033 1 ,283* ,757** Part IV: Balance between work and personal life ,119 -,133 ,283* 1 ,502**
Total ,683** ,292* ,757** ,502** 1
*. Correlation is significant at the 0.05 level (bilateral). **. Correlation is significant at the 0.01 level (bilateral).
Table 6. Cronbach Alpha coefficient of the main questionnaire parts
Coefficient (Cronbach Alpha) Parts of the questionnaire
0,63 Part I: Work content
0,47 Part II: Physical environment of work
0,67 Part III: Social and relational environment
0,53 Part IV: Balance between work and personal life
0,69 The whole questionnaire
direction [33]. Knowing that, as demonstrated by bibliographic research, no questionnaire takes into account all the dimensions of (QWL) and occupational stress in an exhaustive way. As a result, the questionnaire developed in this study suggests that all existing dimensions in the scientific literature be grouped together as well as those that seem relevant to the purpose of the investigation of (QWL) and occupational stress.
Table 7. Pearson correlation coefficient (r) - Test-Retest
Parties du questionnaire r (Test-retest) Part I: Work content 0,819* Part II: Physical
environment of work
0,120
Part III: Social and relational environment
0,780
Part IV: Balance between work and personal life
0,714*
*. Correlation is significant at the 0.05 level (bilateral).
Regarding validation of the questionnaire and the developed model, the structural validity of the questionnaire is determined to be good with regard to the inter-part correlations of the questionnaire. Indeed, correlations below 0.6 [35] demonstrate the non-existence of a dependence between the different parts of the questionnaire. On the other hand, the correlation of the four parts of the questionnaire with the whole shows a strong significant correlation, which proves the validity of the questionnaire and its ability to measure the subject of the study.
To measure internal consistency, Cronbach alpha (α) has been developed by Cronbach in 1951 [36], and is generally used for such measure [37], it is also frequently used to determine internal homogeneity [38]. Values between 0.7 and 0.9 are recognized as good internal consistency [39]. However, according to Nunnally [40], an index of 0.6 or 0.5 is sufficient. Indeed, a too high coefficient would be more a reflection of a certain redundancy among the items than the proof of a good coherence [41]. Ahire and Devarage recommend a threshold of 0.5 for emerging constructs and a threshold of 0.7 for mature constructions [42]. According to these thresholds, Cronbach Alpha coefficients of the four parts of the questionnaire, as well as Cronbach Alpha of the whole questionnaire are satisfactory in order to determine good internal coherence. Dimensions of Karasek’s questionnaire as a reference are all above 0.65 [43]. On the other hand, the scales of the Siegrist questionnaire vary between 0.75 and 0.88 [44].
a low positive correlation, and consequently denies the stability over time for this part. This interpretation is done according to the following scale of correlation’s scores: ,> 0.91: an excellent correlation, 0.90-0.71: a good correlation, 0.70-0.51: a moderate correlation, 0.50-0.31: an acceptable correlation, and <0.30 a low correlation [46].
The theoretical model developed and its questionnaire validated in this study allows the investigation of the following elements:
The prevalence of (OS) and (QWL) according to socio-professional categories, The prevalence of each factor influencing the (QWL) and (OS) in the company and their rating for a better organization.
The present study shows satisfactory parameter of the developed questionnaire; yet, some limitations to this work are highlighted below:
The investigated population is relatively small for the purpose of this study, due to lack of greater financial and human resources;
The investigation did not meet the expected rate of response.
Delimitations of this study are highlighted below:
Since it is optional to measure the discriminant validity parameter, we chose to investigate it in a future work, investigating at the same time the stress specifically in the population of the aerospace manufacturing company.
These results will enable the organization to identify fields of action and the actions to be implemented in order to create a motivating working environment for the staff. This, being directly linked to their performance in accomplishing their tasks [11].
5. CONCLUSION
The developed questionnaire in this study shows satisfactory validation parameters. Still, we recommend the measurement of discriminant validity in future research, the revalidation of the questionnaire in case of translation to other languages and the use of repeated sensitization sessions during the questionnaire administration in order to improve the response rate.
The theoretical model developed in this study is a decision-making tool allowing a diagnosis of the current state of (QWL) and (OS) of the staff, thus, allowing a better orientation of the actions of improvement and valorization of the human resources. This is essential in quality management, as well as in the management of the mental and physical health of the staff, while improving the performance of the company.
CONSENT
As per international standard or university standard, participant’s written consent has been collected and preserved by the authors.
ETHICAL APPROVAL
It is not applicable.
COMPETING INTERESTS
Authors have declared that no competing interests exist.
REFERENCES
1. Stansfeld S, Candy B. Psychosocial work environment and mental health — A meta-analytic review. Scandinavian Journal of Work, Environment & Health. 2006;443– 462.
2. Laraqui O, Laraqui S, Tripodi D, Caubet A, Verger C, Laraqui CH. Evaluation du stress chez le personnel de santé au Maroc: À propos d’une étude multicentrique. Archives des Maladies Professionnelles et de l’Environnement. 2008;672–682.
3. Aptel M, Aublet-Cuvelier A, Cnockaert JC. Les troubles musculosquelettiques du membre supérieur liés au travail. Rev Rhum [Ed Fr]. 2002;1181–90.
4. Sobeih T, Salem S, Genaidy A, Dareiseh N, Shell R. Psychosocial factors and musculoskeletal disorders in the construction industry: A systematic review. Theoretical Issues in Ergonomics Science. 2006;329–344.
5. Agardh EE, et al. Work stress and low sense of coherence is associated with Type 2 diabetes in middle-aged Swedish women. Diabetes Care. 2003;719–724. 6. Niedhammer I, Siegrist J. Facteurs
Déséquilibre efforts/Récompenses. Revue d’épidémiologie et de Santé Publique. 1998;398–410.
7. European Comission. Guidance on work-related stress: Spice of life or kiss of death, European Communities, Luxembourg, European Communities; 2002.
8. (EU-OSHA). European agency for safety and health at work. Calculating the cost of work-related stress and psychosocial risks; 2014.
9. Loscocco KA, Roschelle AN. Influences on the quality of work and nonwork life: Two decades in review. Journal of Vocational Behavior; 1991.
10. Danna K, Griffin RW. Health and well-being in the workplace: A review and synthesis of the literature. Journal of Management. 1999;357–384.
11. Beh L, Rose RC. Linking QWL and job performance: Implications for organizations. Performance Improvement. 2007;30–35.
12. Hackman J, Oldham G. The job diagnostic survey. New Haven: Yale University; 1974. 13. Taylor JC, Cooper CL, Mumford E. The quality of working life in Western and Eastern Europe. ABP; 1979.
14. Mirvis PH, Lawler EE. Accounting for the quality of work life. Journal of Occupational Behavior. 1994;197–212.
15. Baba VV, Jamal M. Routinisation of job context and job content as related to employee‟s quality of working life: A study of psychiatric nurses. Journal of Organizational Behavior. 1991;379–386. 16. Ellis N, Pompli A. Quality of working life for
nurses. Commonwealth Dept of Health and Ageing. Canberra; 2002.
17. NI for O. S, H. D. of A. R. and T. Niosh. Quality of worklife questionnaire [Internet] [cited 2016 Feb 24].
Available:http://www.cdc.gov/niosh/topics/s tress/qwlquest.html (2013)
18. Karasek RA. Job demands, job decision latitude, and mental strain : Implications for job redesign. Administrative Science Quarterly. 1979;285-308.
19. Kompier M, Levi L. Le stress au travail: Causes, effets et prévention. Guide Pour Les Petites et Moyennes Entreprises. Brochure D’information 21.” Dublin: Fondation européenne pour l’amélioration des conditions de vie au travail; 1995. 20. Langevin L, Boini S, Francois M, Riou A.
Risques psychosociaux: Outils d’évaluation. FRPS35: Inventaire de
description de l’activité professionnelle (IDAP),” INRS. Institut National de Recherche et de Sécurité; 2011.
21. Siegrist J. Adverse health effects of high-effort/low-reward conditions. Journal of Occupational Health Psychology. 1996;27– 41.
22. Cail F, Morel O, Aptel M. Méthode de Prévention des Troubles
Musculosquelettiques Du Membre Suéprieur et Outils Simples. Dossier Medico-Technique TC 78. Doc Méd Trav. 2000;187–223.
23. Hansez I. La validation du Woccq: Vers Un modèles structural du stress et du controle de l’activité de travail. Thèse de doctorat en psychologie, Université de Liège; 2001. 24. Guglielmi RS, Tatrow K. Occupational
stress, burnout and health in teachers: A methodological and theoretical analysis. Rev. Educ. Res. 1998;61–99.
25. Ministry of Economy, Industry and Employment and the Ministry of Labor, Social Relations, Family and Solidarity, Directorate for Research, Studies and Statistics DARES, “SUMER survey,” 2003. 26. Dussault M, Valois P, Frenette E.
Validation de l’échelle de Leadership Transformatif du directeur d’école. Psychologie du Travail et des Organizations. 2007;13(2):37-52.
27. DeVellis RF. Scale development : Theory and applications (2e éd.). Thousand Oaks, CA : SAGE; 2003.
28. Krueger P, Brazil K, Lohfeld L, Edward HG, Lewis D, Tjam E. Organization specific predictors of job satisfaction: Findings from a Canadian multi-site quality of work life cross-sectional survey. BMC Health Services Research; 2002.
29. Laxton AW, Perrin RG. The relations between social support, life stress, and quality of Life following spinal decompression surgery. Spinal Cord. 2003;553–558.
30. ASSS. Validation d’un questionnaire de satisfaction évaluant la qualité des services offerts dans le programme Québecois de dépistage du cancer du sein. Agence de la santé et des services sociaux de la capitale- nationale; 2009. 31. Guimarães LAM, Moraes da Silva A.
Occupational stress and quality of life in nursing. Paidéia. 2016;63–70.
orthodontists. Open Journal of Stomatology. 2011;1–6.
33. Sheel S, Khosla SIindhwani B, Goel S, Pathak S. Quality of work life, employee performance and career growth opportunities: A literature review. International Journal of Multidisciplinary Research; 2012.
34. Shamir B, Salomon I. Work-at-home and the quality of working life. Acad. Manag. 1985;455–64.
35. Carey J, Seibert J. A patient survey system to measure quality improvement: Questionnaire reliability and validity. 1993;31(9):834-845.
36. Cronbach LJ. Coefficient alpha and the internal structure of tests. Psychometrika. 1951;297–334.
37. Beaurivage D. Développement et validation du Questionnaire de connaissances sur l’asthme destiné aux patients adultes (QCA-PA). Université LAVAL; 2015.
38. Bouletreau A, Chouanïère D, Wild P, Fontana JM. Design, translate and validate a questionnaire on an example, euroquest, National Institute for Research and Security. Service d’Epidemiologie, INRS; 1999.
39. Crocker L, Algina. Introduction to classical and modern test theory, New York, NY : Holt, Rinehart, And Winston; 1986.
40. Nunnally J. Psychometric theory, New York: Mc Graw Hill; 1967.
41. Moret L, Mesbah M, Chwalow J, Leliouche J. Internal validation of a scale. Relationship between principal component analysis, Cronbach’s a-coefficient and intra-class coefficient of correlation. Rev. Epidém. et Santé Publ. 1993;179–186. 42. Ahire SL, Devarage S. An empirical
comparison of statistical construct validation approaches. IEEE Transactions on Engineering Management. 2001;319– 329.
43. Langevin L, Boini S, Francois M, Riou A. Risques psychosociaux: Outils d’évaluation. FRPS2: Job Content Questionnaire. INRS. Institut National de Recherche et de Sécurité; 2011.
44. Langevin L, Boini S, Francois M, Riou A. Risques psychosociaux: Outils d’évaluation. FRPS3: Déséquilibre ‘efforts/recompenses. INRS. Institut National de Recherche et de Sécurité; 2011.
45. Giesen D, Meertens V, Vis-Vischers R, Beukenhorst D. Questionnaire development, Statistics Netherlands; 2012. 46. Donner A, Eliasziw M. Sample size requirements for reliability studies. Stat Med. 1987;441–448.
_________________________________________________________________________________
© 2017 Battal et al.; This is an Open Access article distributed under the terms of the Creative Commons Attribution License (http://creativecommons.org/licenses/by/4.0), which permits unrestricted use, distribution, and reproduction in any medium, provided the original work is properly cited.
Peer-review history: