Article
Linear Mathematical Model for Seam Tracking with
an Arc Sensor in P-GMAW Processes
Wenji Liu *, Liangyu Li, Ying Hong and Jianfeng Yue
Department, Tianjin Polytechnic University, No. 399 Bin Shui Xi Road, Xi Qing District, Tianjin 300387, China; [email protected] (L.L.); [email protected] (H.Y.); [email protected] (Y.J.) * Correspondence: [email protected]; Tel.: +86-22-8395-5083
Abstract: Arc sensors have been used in seam tracking and widely studied since the 80s and commercial arc sensing products for T and V shaped grooves have been developed. However, it is difficult to use these arc sensors in narrow gap welding because the arc stability and sensing accuracy are not satisfactory. Pulse gas melting arc welding (P-GMAW) has been successfully applied in narrow gap welding and all position welding processes, so it is worthwhile to research P-GMAW arc sensing technology. In this paper, we derived a linear mathematical P-GMAW model for arc sensing, and the assumptions for the model are verified through experiments and finite element methods. Finally, the linear characteristics of the mathematical model were investigated. In torch height changing experiments, uphill experiments, and groove angle changing experiments the P-GMAW arc signals all satisfied the linear rules. In addition, the faster the welding speed, the higher the arc signal sensitivities; the smaller the groove angle, the greater the arc sensitivities. The arc signal variation rate needs to be modified according to the welding power, groove angles, and weaving or rotate speed.
Keywords: arc sensing; P-GMAW; mathematical model
1. Introduction
All of the above models are assumed to have internal resistance and internal inductance and the power supply has a characteristic of constant current or constant voltage, but for a P-GMAW power supply, the internal parameters are switched quickly with the pulse frequency to ensure it works on two different external characteristic curves, and the above methods for building a mathematical model are not applicable any more. At present, the models used in P-GMAW sensing are all empirical models by fitting experimental data. Kim et al. have studied the P-GMAW arc morphology and current characteristics when groove angle was 45° and 60°. They analyzed the laws of arc characteristics when groove angle getting smaller, which have laid a technical foundation for the P-GMAW arc sensing technology [8,9]. Arc sound energy distribution of narrow gap P-P-GMAW has been studied by Hu et al., and they found that the arc sound spectrum was highly correlated with the arc position in groove [10]. Ye et al. studied the signal characteristics and processing methods of sensing torch height in P-GMAW process with an arc sensor [11]. Hyeong-Soon analyzed the sensitivity of current and voltage to torch height changing. By taking voltage signal as tracking signal and using moving average filtering method, a dual torch automatic welding system for narrow gap welding was designed [12,13]. In this paper, based on the characteristics analysis of P-GMAW power, the static mathematical model of P-GMAW arc tracking sensor was established, the key assumptions were studied, and the linear feature was verified through experiments.
2. P-GMAW Power Arc Length Control Method
At present, most commercially available P-GMAW welding power supplies adopt an I/I control mode, in which both the pulse current and the base current are held constant. The arc length variation does not directly affect the welding current value. In order to regulate arc length and ensure the arc stability, arc voltage-which is roughly proportional to arc length-is typically monitored and compared to the reference voltage. When an arc voltage change is detected, the pulse frequency is changed by adjusting the base current over time. The average current and the wire melting speed are changed to regulate the arc length because the pulse current Ip and pulse time Tp are invariant and
the base current duration Tb has changed. In this manner, a P-GMAW power supply can adjust arc
length without changing the “one drop per pulse” transition. In modern arc welding power supplies, an arc length control model-where welding current compensation and pulse frequency are adjusted at the same time-is used to ensure that the arc length can be recovered in a short time and guarantee welding quality. The P-GMAW arc sensing mechanism is based on the P-GMAW arc length control mechanism.
3. Linear Mathematical Model for the P-GMAW Arc Tracking Sensor
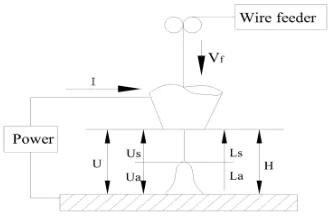
As shown in Figure 1, CTWD is expressed in H, and the monitored voltage, U, is the sum of the arc voltage, Ua, and the stickout voltage, Us, that is:
s
a
U
U
U
=
+
(1)According to the Ayrton equation [14]:
a ai al a
a
U
IR
E
E
I
L
U
=
0+
+
(
+
)
(2)I
L
k
U
s=
s s (3)where U0 is the sum of the cathode voltage drop and the anode voltage drop, Rais the welding arc
equivalent resistance, ksis the stickout resistance per unit length, Eal and Eaiare the arc length influence
coefficients—which are equivalent to the field strength and resistance per unit length respectively and associated with the shielding gas and welding wire, La is the arc length, Ls is the welding stickout
Figure 1. Monitored voltage composition.
As shown in Figure 2, at the moment that the CTWD suddenly decreases, the arc length becomes shorter and the stickout remains unchanged, which results in the monitor voltage reducing to U1’
(base voltage is marked as U1’b and the pulse voltage is marked as U1’p in Figure 2b). Assuming that
the welding power supply has excellent arc length control ability, which means that the time to restore the original arc length is much less than the torch weaving cycle time, the arc length should be recovered quickly by adjusting the pulse frequency. After adjusting, the change in the monitored voltage, U2, with respect to the U1 is related only to the stickout change, Ls, that is:
s s s
k
I
L
U
U
U
U
=
−
=
Δ
=
Δ
Δ
1 2 (4)As shown in Figure 2a, the CTWD is composed of arc length La and stickout Ls and because La is
unchanged after adjusting, the CTWD variation equals the stickout variation, namely ΔH = ΔLs. So:
I
k
U
H
sΔ
=
Δ
(5)That is to say, the CTWD variation−which results from the stickout change—is reflected by the monitored voltage variation. In case of the stickout length plays no effect on, the CTWD variation will be proportional to the voltage change. Similar analysis can be done when the CTWD increases suddenly. On the other hand, in stable state 2 when the adjustment has finished, the wire melting rate, Vm, should still equal the wire feed speed, Vf, that is:
f s av
m kI k LI V
V = + av =
2 2 1 (6) Namely: 1 1 2 2 2 2 2 1
f av s
s
av
av av
V k I V k
L k I
k I k I
−
= = − (7)
where k1and k2represent the melting rate coefficients. Iavis the average welding current. The base
current, Ib, is very low, so the welding wire melting and droplet transfer mainly result from the pulse
current, Ip, and pulse duration, Tp. Therefore, the average current Iav in Equation (6) can be
approximately expressed as:
f
I
T
T
I
T
I
p p p pav
=
=
(8)2 1 2 2 2
2 2
f s
p p p p
V
k T
L
T
T
T
k T I
k T I
α
β
=
−
=
−
(9)and:
2
H
=
La
+
α
T
−
β
T
(10)Therefore, the CTWD variation can also be monitored through the pulse period, T (or frequency f), that is:
dT TdT dT
T L T dL
dH = s( )= ′s( )T⋅ =2
α
−β
(11)In the formula:
2 2
2 p p
f
I
T
k
V
=
α
p p
I
T
k
k
2 1
=
β
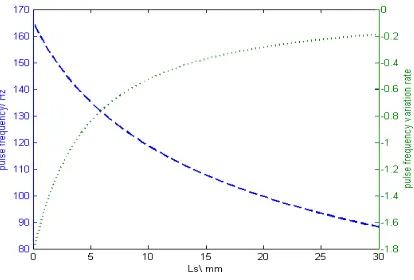
where Ip = 500 A, Tp = 2.5 ms, Vf= 100 mm/s, and k1 and k2 come from the literature [7], the relationship
between the stickout and pulse frequency is shown in Figure 3.
(a) (b)
Figure 2. Voltage signal when the CTWD decreases: (a) arc length and stickout variation; (b) voltage changing process. The superscript p represents the pulse voltage and b represents the base voltage.
When Ls is larger, the pulse frequency variation rate tends to be constant, which indicates that
the pulse frequency and Ls follow a linear law. What’s more, the greater the initial CTWD, the more
obvious the linear relationship. According to the above analysis, in order to ensure that the arc voltage and the pulse frequency are linearly related to the CTWD, we should reduce the arc length variation influence such that the CTWD change is a result of stickout change alone. For this purpose, the welding power requires excellent arc length control ability and a short welding arc combined with a longer stickout should be applied to the welding process.
4. Analysis on the Assumptions
Two important assumptions were used in previous model. First, we assumed that the welding power supply has excellent arc length control performance, and when the CTWD changes, the arc length can be quickly restored. Second, ks is regarded as constant so that the linear relationship
between CTWD variation and monitoring voltage can be established. The first assumption directly affects the static model correctness, and the second assumption defines the relationship between CTWD variation and monitoring voltage.
4.1. Investigation of P-GMAW Power Arc Length Control Performance
(a) (b)
(c) (d)
Figure 4. TPS3200 arc length control characteristics: (a) Pulse Voltage; (b) Pulse frequency; (c) Pulse current; (d) Base current.
Figure 5 shows the arc shape when the torch moves towards a 45° slope at a 5 mm/s speed. Although the CTWD changes rapidly in the uphill process, the arc length is almost unchanged and CTWD variation is mainly affected by the stickout change. Through the above analysis we can determine that the arc length adjustment is fast and the arc is stable when the CTWD changes, which fully meets the requirements for deriving the mathematical model.
Figure 5. Arc images captured through high speed photography. 4.2. Stickout Effect on ks
The resistance of the unit stickout, ks, is influenced by the wire diameter, material, and
temperature distribution. The wire diameter and material are determined under certain welding conditions, so ks varies only with the temperature distribution. Compared to the analytical method,
the finite element method fully considers the thermo-physical material properties, so the results are more accurate. Therefore, the stickout temperature distribution was calculated through the finite element method.
4.2.1. Stickout Temperature Field Modeling
(1) Control equations
As shown in Figure 6 assuming that the wire feed rate, Vf, equals the melting speed, Vm—the
welding wire is in a stable combustion state and the stickout, Ls, remains constant. The welding wire
2
(
f)
(
)
p c
T
T
T
C
V
J
t
t
z
z
ρ
∂
+
∂
=
∂
λ
∂
+
ρ
∂
∂
∂
∂
(12)where ρcis the electrical resistivity, λ is the thermal conductivity, and J is the current density.
Figure 6. Modeling of stickout temperature field.
(2) Boundary conditions
For the metal welding wire, the resistivity decreases as the temperature decreases. The temperature near the contact tip is much lower than other position along the wire, so the resistivity is assumed constant at z = 0 whenever stickout changes. This is described in the following boundary condition at the position z = 0:
0 T0
z
T = = (13)
where T0 is a constant temperature.
At the end of the wire z = Ls, the heat obtained through the welding arc within dt can be
expressed as:
( )
rdQ
=
q r Adt
(14)where q(r) is the welding arc heat flux and A is the wire cross-section area. The heatlost through the melting wire and transition within time dt can be expressed as:
m 0 l
(T
T ) + Q
s p f f
dQ
=
ρ
C V A
−
dt
ρ
V Adt
(15)where Tm is the melting temperature and Ql is the latent heat of fusion. The heat flux at the stickout
end is:
m 0 l
(T
T )+
Q
( )
p f f
z Ls T
z
C V
V
q r
λ
ρ
ρ
=
∂
=
−
−
∂
(16)The wire surface heat flux of the heat distributing to the surrounding environment can be expressed as:
0
(
v)
r r T
r
h T T
λ
=
∂
=
−
∂
(17)where h is the convective heat transfer coefficient, indicating the heat transfer capacity between the stickout surface and the surrounded air, and Tvis the environment temperature.
0
2
0 0
m 0 l
(
)
(
)
T
(T -T )+
Q
( )
(
)
f
p c
z
p f f
z Ls v r r T z T r
T
T
T
C
V
J
t
t
z
z
T
C V
V
q r
h T
T
ρ
λ
ρ
λ
ρ
ρ
λ
= = =∂
∂
∂
∂
+
=
+
∂
∂
∂
∂
=
∂
=
−
∂
∂
=
−
∂
(18)4.2.2. Solution and Analysis
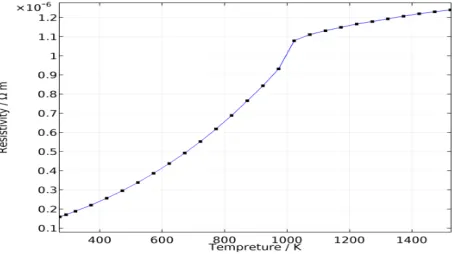
The partial differential equations were solved using the COMSOL software. The wire material thermo-physical properties were given according to carbon steel properties in the literature [15] and the wire resistivity is a function of temperature, as shown in Figure 7. For wire diameter r0 = 1 mm
and feed rate Vf= 100 mm/s, the average welding currents are 129 A, 118 A, 112 A, 105 A, and 100 A
when the CTWDs are 15 mm, 17 mm, 19 mm, 21 mm, and 23 mm, respectively, which are determined through experiments. The arc length in the experiment is about 3 mm, and hence the stickout, Ls, are
12 mm, 14 mm, 16 mm, 18 mm, and 20 mm. The three-dimensional model and mesh are established as shown in Figure 8.
Figure 7. Carbon steel wire resistivity.
Figure 8. Three-dimensional model and mesh.
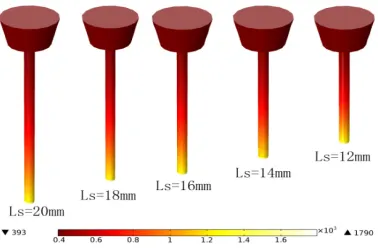
The temperature distribution along the wire is shown in Figures 9 and 10. Note that no matter how the torch height changes, the temperature rises rapidly to the melting temperature at about 1 mm from z = Ls, while the temperature distribution elsewhere in the wire is much more gradual. The
resistivity along the stickout shows a similar distribution. The average welding wire resistivity with different stickout length were calculated and are listed in Table 1. From Table 1, when the CTWD increased from 15 mm to 23 mm, the average resistivity was approximately 0.6 (Ω mm²/m). The effect of CTWD variation on the unit stickout resistance, ks, is not obvious. Therefore, it is feasible to deal
Figure 9. Wire temperature distribution.
Figure 10. Temperature distribution along the wire.
Figure 11. Resistivity distribution along the wire.
Table 1. The average resistivity for different stickout.
Stickout/mm 12 14 16 18 20
Average resistivity/Ω mm²/m 0.6 0.585 0.60 0.592 0.596
5. Experimental Verification of Linear Features in the Mathematical Model
5.1. Experimental Conditions
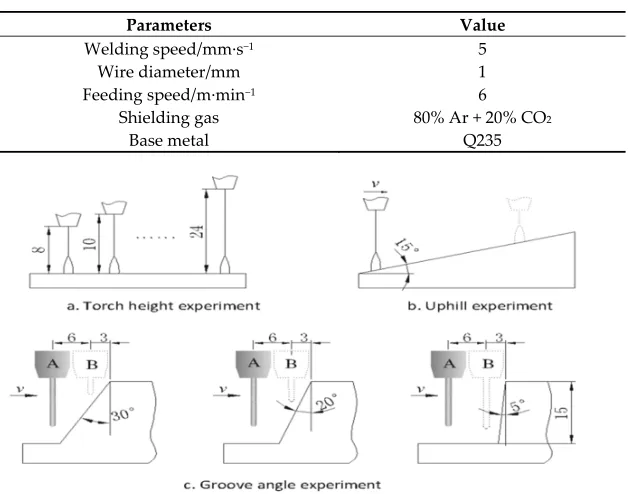
The experimental parameters are shown in Table 1. The welding power supply is a Fronius TPS3200 operated in P-GMAW mode; the wire feed rate is fixed and other parameters are automatically matched. The experimental scheme is shown in Figure 12. First, we analyzed the influence of different CTWD on the arc signals through a plate welding experiment, in which the CTWD is changed by shifting the torch height. Then we analyzed the influence of continuously changing the CTWD on arc signals with an uphill experiment. Finally, the arc characteristics for different groove angles are verified.
Table 2. Experiment parameters.
Parameters Value
Welding speed/mm·s−1 5
Wire diameter/mm 1
Feeding speed/m·min−1 6
Shielding gas 80% Ar + 20% CO2
Base metal Q235
Figure 12. Experimental schemes.
5.2. Arc Signal Characteristics When Changing the Torch Height
(a) (b)
(c) (d)
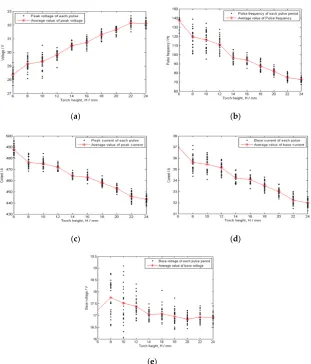
(e)
Figure 13. Arc signal characteristics for different torch heights: (a) Pulse voltage; (b) Pulse frequency; (c) Pulse current; (d) Base current; (e) Base voltage.
In Figure 13, the pulse current and pulse voltage are the average values during each pulse period, Tp, and the base current and base voltage are the average values during the base period, Tb;
the pulse frequency is obtained by calculating the pulse intervals. The pulse intervals are marked with black dots. The arc parameter average values (e.g., pulse current, pulse voltage, base current, base voltage, and frequency) for all pulse cycles in a given torch height are marked with asterisks. Note that the arc parameters - except base voltage−are roughly linearly related to the torch height. Also, the shorter the torch height, the greater the data fluctuation.
Figure 14. Base voltage when torch height becomes larger.
5.3. The Influence of Continuously Changed CTWD on Arc Signals
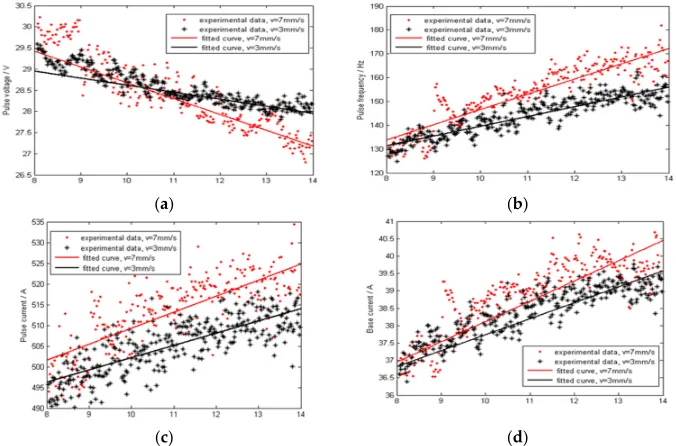
As shown in Figure 15, the arc signal changes linearly with the CTWD in the uphill process, and the pulse voltage and frequency exhibit a better linear relationship in comparison to the base and pulse current. In addition, when the welding speed is increased, the characteristic signal sensitivity (slope) also increases.
(a) (b)
(c) (d)
Figure 15. Effects of welding speed on the arc signal when uphill welding: (a) Pulse voltage; (b) Pulse frequency; (c) Pulse current; (d) Base current.
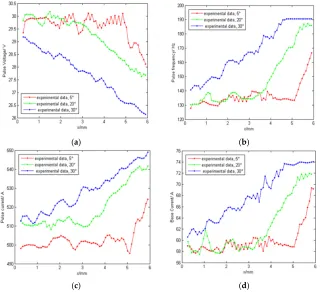
5.4. Influence of Groove Angle on Arc Signal
(a) (b)
(c) (d)
Figure 16. Arc signals at different groove angles: (a) Pulse voltage; (b) Pulse frequency; (c) Pulse current; (d) Base current.
6. Conclusions
Based on P-GMAW welding power supply characteristic analysis with an I/I model, the behavior governing arc voltage and pulse frequency in response to torch height change are derived under the assumption that the welding power supply has excellent arc length control performance. Neglecting the influence of stickout on unit resistance, ks, CTWD variation is proportional to voltage variation,
and the pulse frequency is also roughly linearly related to the CTWD when the torch height is large. By verifying the arc length control characteristics for a TPS3200 welding power supply, the results show that the arc length control ability assumption is feasible. The temperature distribution and resistivity regularity along the stickout are calculated through a Three-dimensional finite element model. The calculation results show that CTWD variation does not affect the average resistivity, and it is feasible to ignore the stickout resistance variation.
The welding experiments show that the P-GMAW arc signals all satisfied the linear relationships. In addition, the faster the welding speed, the higher the arc signal sensitivities; the smaller the groove angle, the greater the arc sensitivity. The arc signal variation rates need to be modified according to the specific welding requirements.
Acknowledgments: The authors are grateful to National Nature Science Foundation of China (Grant No. U1333128) and Tianjin sci-tech project (Grant Nos. 14ZCDZGX00802, 16JCTPJC48600) for financially supporting this research project.
Author Contributions: Wenji Liu derived the model, designed the experiments and analyzed the data; Liangyu Li set up the finite element model; Wang Yumei, Ying Hong and Jianfeng Yue performed the experiments.
Conflicts of Interest: The authors declare no conflict of interest.
Reference
2. Kim, G.H.; Na, S.J. A study of an arc sensor model for gas metal arc welding with rotating arc Part 1: Dynamic simulation of wire melting. Proc. Inst. Mech. Eng. Part B J. Eng. Manuf. 2001, 215, 1271–1279. 3. Kim, G.H.; Na, S.J. A study of an arc sensor model for gas metal arc welding with rotating arc Part 2:
Simulation of an arc sensor in mechanically rotating gas metal arc welding. Proc. Inst. Mech. Eng. Part B J.
Eng. Manuf. 2001, 215, 1281–1288.
4. Shi, Y.H.; Yoo, W.S.; Na, S.J. Mathematical modelling of rotational arc sensor in GMAW and its applications to seam tracking and endpoint detection. Sci. Technol. Weld. Join. 2006, 11, 723–730.
5. Shi, Y. Mathematical model of high speed rotational arc sensor. Chin. J. Mech. Eng. 2007, 43, 217–223. 6. Ushio, M.; Mao, W. A Study of the Improvement of the Sensitivity and the Reliability of the Arc Sensor in
GMA Welding. (1st Report). Modelling of the Arc Sensor for DC MIG/MAG Welding in Open Arc Mode.
Weld. Int. 1996, 10, 622–631.
7. Ushio, M.; Mao, W. An Analysis of the Dynamic Characteristics of the Arc Sensor for DC MIG/MAG Welding in Open Arc Mode: A Study of the Improvement in the Sensitivity and the Reliability of the Arc Sensor in GMA Welding (2nd Report). Quart. J. Jpn. Weld. Soc. 1996, 14, 108–115.
8. Kim, R.H.; Choi, G.D.; Kim, C.H.; Cho, D.W.; Na, S.J. Arc Characteristics in Pulse-GMA Welding with Acute Groove Angles. Weld. J. 2012, 91, 101s–104s.
9. Kim, R.H.; Na, S.J.; Kim, C.H. A Study on the Welding Current in Butt Joint P-GMA Welding with Acute Groove Angles. J. Korean Weld. Join. Soc. 2010, 28, 55–60.
10. Hu, L.; Zhang, H.; Chen, S.; Sheng, K. Correlation of Arc Sound and Arc-sidewall Position in Narrow Gap MAG Welding. Chin. J. Mech. Eng. 2014, 24, 38–43.
11. Ye, Z.; Chen, H.B.; Gu, F.; et al. Feature Extraction from Arc Signal for Height Tracking System of P-GMAW
Welding Robotic Welding; Intelligence and Automation; Springer International Publishing: Berlin, Germany,
2015; pp. 95–107.
12. Moon, H.S.; Ko, S.H.; Kim, J.C. Automatic seam tracking in pipeline welding with narrow groove. Int. J.
Adv. Manuf. Technol. 2009, 41, 234–241.
13. Moon, H.S.; Kim, J.C.; Kim, J.I.; Kim, Y.B. A study on signal processing algorithm for seam tracking in pipeline welding. In Proceeding of the 2013 13th International Conference on Control, Automation and Systems (ICCAS);Marina Bay Sands, Singapore, 2013; pp. 1618–1622.
14. Choi, J.H.; Lee, J.Y.; Yoo, C.D. Simulation of dynamic behavior in a GMAW system. Weld. J.2001, 80, 239–245.
15. Yu, Y. Manual Book of Modern Continuous Casting; Metallurgical Industry Press: Beijing, China, 2010.