Copyright 0 1987 by the Genetics Society of America
Disequilibrium Pattern Analysis.
11.
Application
to
Danish HLA A and B Locus Data
William Klitz and Glenys Thomson
Department of Genetics, University of Calvornia, Berkeley, Cal$ornia 94 720
Manuscript received September 3, 1986 Revised copy accepted May 2, 1987
ABSTRACT
Disequilibrium pattern analysis, a general method for analyzing evolutionary events acting on pairs of tightly linked polymorphic loci, is applied to a large sample of Danish individuals typed for A and B loci of the HLA (human leukocyte antigen) system. Cases of selection on particular haplotypes are revealed from patterns of linkage disequilibrium among the HLA haplotypes. These patterns cannot be explained by either population admixture or random genetic drift. Six haplotypes out of the total array of 273 haplotypes have been identified which show in varying extents the patterns indicating selection.
WO population genetic features of the HLA
T
(human leukocyte antigen) system make it ide- ally suited for the study of evolutionary forces acting on a population: the high level of polymorphism ex- hibited by many of the loci, and the existence of significant linkage disequilibrium (non-random asso- ciation) between certain pairs of alleles at different loci. HLA is the major histocompatibility complex (MHC) in humans. This complex of genes codes for cell surface proteins which play a central role in gov- erning the immune system (HOOD, STEINMETZ and MALISSEN 1983; LARSEN 1981; KLEIN, FIGUEROA and NAGY 1983; LEW et al. 1986; AUFFRAY and STROM-INGER 1986). At least 23 antigens have been defined for the HLA A locus, 47 for the B locus, 8 for C, 19
for D and 14 for DR (see Histocompatibility Testing
1984, pp. 4-8, ALBERT, BAUR and MAYR 1984). In no case is there a single common allele; rather there are quite a few alleles with relatively even frequencies (DAUSSET and COLOMBANI 1972; BAUR and DANILOVS
1980; BODMER and THOMSON 1977; THOMSON 198 1 ; HEDRICK and THOMSON 1983; BAUR et al. 1984;
KLITZ, THOMSON and BAUR 1986). Consequently, the level of heterozygosity at each locus is very high. In addition, significant linkage disequilibrium is detected for many pairs of antigens (see for example BAUR and DANILOVS 1980; and BAUR, NEUGEBAUER and ALBERT
1984). T h e most widely quoted example is the high degree of association between the antigens A1 and B8 in Caucasian populations.
When linkage disequilibrium values for two locus HLA haplotypes were first calculated (CEPPELLINI et
a l . 1967; BODMER and BODMER 1970; DAUSSET and COLOMBANI 1973), haplotypes with a significant excess of numbers were noted, and assumed to be candidates for selection, and, therefore, of special interest. Al-
Genetics 116: 633-643 (August, 1987)
though the haplotypes comprising the great majority of the population are those without strong positive disequilibria, these have not, until now, been consid- ered useful in the search for the forces governing interlocus associations.
In this paper we apply a method, disequilibrium pattern analysis, for examining the disequilibrium dis- tribution of the entire array of the HLA A and B locus haplotypes in the Danish study by HANSEN et al.
(1 979). T h e theoretical foundation for the method is outlined in the companion paper (THOMSON and KLITZ 1987). This method identifies the constraints on the values that a disequilibrium coefficient can assume, based on the distribution of the entire popu- lation of haplotypes in the disequilibrium space. Spe- cific quantifiable patterns are predicted as a result of selective events. In particular, the following criteria reveal selection in a chromosomal region and are used to identify those two-locus haplotypes showing the effects of selection.
1. T h e presence of just one or a few haplotypes in the positive disequilibrium space when we plot the linkage disequilibrium for all haplotypes containing a given allele.
634 W. Klitz and G. THOMSON
two locus multiallelic system, and the less common of the two alleles in a selected two-locus haplotype will have arisen more recently in evolutionary time.
RESULTS
A population study of HLA A and B locus haplo- types: T h e large size (5,202 individuals), and relative homogeneity of the Danish population sample are both desirable characteristics for the application of disequilibrium pattern analysis.
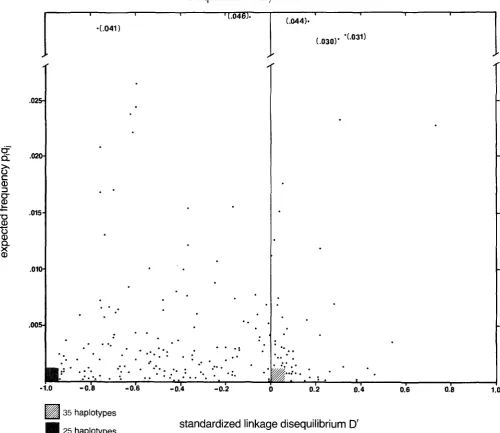
The disequilibrium space is defined by either the linkage disequilibrium parameter D, or the standard- ized (or normalized) linkage disequilibrium parameter D‘ on one axis, and on the other axis by the expected haplotype frequency, in the absence of linkage dis- equilibrium for that haplotype, that is p A , q B , (where
PA,
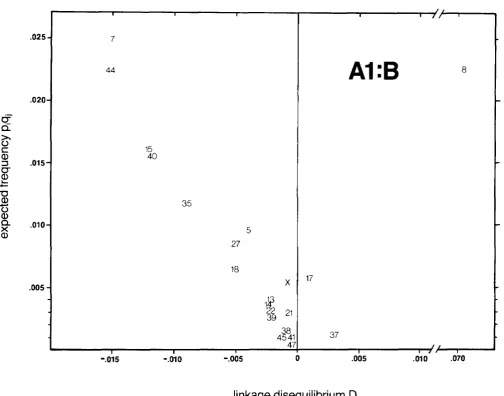
and 48, are the frequencies of the ith and j t h alleles at each of the two loci). T h e normalized linkage disequilibrium D’ vs. P A , q B , for the array of 273 hap- lotypes from the 13 HLA A and 21 HLA B alleles from the Danish population is plotted in Figure 1. T h e haplotypes exhibit disequilibrium values forming a broadly distributed group of points, occupying both the positive and negative spaces. Many low frequency haplotypes are found in the two regions where D’ equals either -1.0 or 0.0. There are 173 haplotypes with negative and 100 with positive disequilibrium values.Patterns from the data suggesting selection: This total array of haplotypes was subdivided by consider- ing one allele at one locus in combination with each of the alleles at another locus, for example A 1 with each of the B locus alleles (Figure 2). This subdivision revealed cases where patterns indicative of a strong selection event were apparent, as well as cases which did not exhibit such patterns. From the entire set of 34 graphs of the 13 HLA A and 21 HLA B allelic combinations, 5 have been chosen as illustrative of these cases.
Haplotype A 1 B8, which has the highest positive disequilibrium (and normalized disequilibrium) value in this population (D = 0.0766, D’ = 0.728) reveals a pattern indicative of selection. In the B8 graph (Figure 3) AlB8 is the only haplotype in the positive space, while all related haplotypes (B8notAl) fall in a linear array in the negative space with disequilibrium values approximately proportional to the frequency of the unshared A allele. T h e same pattern is apparent with the A1 graph (Figure 2), except that two additional haplotypes (AlB17 and AlB37) are in the positive space.
T h e graph of normalized linkage disequilibrium values, D’, shown in Figure 4 for A1 haplotypes reveals an alignment of the negative values for the commoner haplotypes. Most of the values fall between -0.6 and -0.8. Rarer haplotypes, for example
(AlB47, AlB38 and AlB13) depart furthest from this alignment apparently due to sampling effects. The AlBX haplotype is an undefined mixture of B locus alleles, which available antisera were unable to define. T h e greater departure of the
D’
value for the AlBX haplotype (Figure 4) from the other values may be a reflection of its heterogeneous composition. The graph of the B8 haplotypes in the negative space (not shown) also displays this alignment for the commoner haplotypes, with the normalized values again falling mainly between -0.6 and -0.8. Note that, the nor- malized disequilibrium value of 0.728 for AlB8, matches with these negative normalized values, as predicted by the theory for selection (THOMSON andKLITZ 1987).
HLA alleles A1 and B8 are both relatively common, having frequencies of 0.17 and 0.13, respectively. T h e presence or absence of patterning is not a function of high or low allele frequencies of the constituent alleles. Comparison should be made between the linkage dis- equilibrium, D, graphs of A1 and B8 (Figures 2 and 3) which show the pattern of selection, with that of another common allele A 2 (frequency 0.3 l), which shows no particular pattern (Figure 5). Nine A2 hap- lotypes are in the positive space and 1 1 in the negative space. T h e largest positive disequilibrium value is 0.2 1 for A2B15 (D’ = 0.34). No linear alignment of the unrelated haplotypes is apparent.
T h e disequilibrium space of a less common allele
A l l (frequency 0.054) also shows no apparent pattern indicative of selection, with haplotypes scattered across the disequilibrium space (Figure 6). On the other hand, the allele A 2 9 , which is less common than
A l l (with a frequency of 0.025), does show a linear alignment of the disequilibrium with allele frequency for the haplotypes in the negative space (Figure
7).
There are five haplotypes in the positive disequilib- rium space, two of which have D’ values which are quite high, namely B44 (D’ = 0.537) and B45 (D’ = 0.387). T h e allele Aw32 which has the same frequency as A 2 9 , however, shows no pattern indicative of selec- tion (not shown) and the largest D’ value in this case is 0.10 for A32B40.These examples illustrate the distinction between patterned and unpatterned distributions of haplotypes in the disequilibrium space.
The number of selected haplotypes: T h e number of favorable independent selective events in a two locus system, K , is given by the quadratic equation
b 2
Jb2
-
4M 2K =
Disequilibrium Analysis: HLA 635
I 1 1 I I
(.044).
' [.0461*
I
e
Q
x
0
t
a,
3
0-
E
-
U a,
0
a,
Q
X a, c
.025
.020
.015
.010
.005
*LO41 1
. .
. .
. .
..
* .
*:
. .
..
. .
. *
..
*
.*.
*. .
..
*...
..
.
I
..
e ...
p.:.
.
;
.
1
I I I
0.2 0.4 0.6 0.8
35 haplotypes
25 haplotypes
standardized linkage disequilibrium
D'
FIGURE 1 .-Expected haplotype frequencies and D' values of the 273 HLA A-B locus haplotypes taken from a sample of 5202 Danes (HANSEN et al. 1979). These haplotypes, constructed from the 13 HLA A and 21 HLA B alleles, are plotted on the disequilibrium space, which is comprised of the frequency of a haplotype expected in the absence of disequilibrium, pq, and the standardized linkage disequilibrium,
D'.
alleles with 173 haplotypes in the negative
D
space. This yields an estimate of 6.54 selective events. Note that this derivation assumes that the selective events are occurring concurrently and that a particular allele does not occur more than once in a selected haplotype. Thus, the estimate of six to seven selective events should be taken merely as a guide for understanding the evolutionary events acting on the region.The influence of neutrality forces: The theoretical distribution of haplotypes in the disequilibrium space under the influence of neutrality and migration were considered in the companion paper (THOMSON and KLITZ 1987). This work showed that, in general, neutrality and migration produce different patterns of haplotype distribution than that found under selec- tion. Here we also compare the sample of Danish HLA data with the overall distribution of standard-
ized disequilibrium values generated under a Fisher- Wright neutral allele model (HUDSON 1983; HEDRICK and THOMSON 1986). The parameters of the two-
636 W. Klitz and G. THOMSON
.025
.020
.015
.010
.005
I 1 1
7
44
15
40
35
5
27
18
X
1F
$$
2138
45 41
Al:B
17
37
t
8
47
I I I . .
.010 .070
linkage disequilibrium D
FIGURE 2.-All haplotypes containing the allele A1 taken from the Danish population are plotted for their expected frequency in the absence of disequilibrium, p q , against the observed linkage disequilibrium parameter D. The B allele designation is used as the position of each haplotype.
the large numbers of alleles similar to those found at the HLA loci. This mutation rate, on the order of 1/
N , is quite high, although some experimental studies suggest that gene conversion, which may be the mech- anism generating much of the variation at the MHC, does have very high rates of occurrence (LOH and BALTIMORE 1984).
We used the observed frequency of blank alleles at the HLA A and B loci (0.022 and 0.032, respectively) in the Danish study to create artificial blank classes in the simulations. T h e rarest allele at a locus was com- bined with consecutively less rare alleles until a fre- quency equal to or greater than the observed blank class at the HLA A and B loci was achieved. This procedure makes the single locus allele frequency distribution closer to that observed for the HLA data. It also reduces the number of alleles found in only one, or very few, copies on a single haplotype and thus reduces the number of missing haplotypes having
D’ of
-
1. T h e size of the D’ =-
1 haplotypic class isa hallmark of neutrality conditions: thus our proce- dure of reducing this class makes the test of neutrality us. selection conservative.
Because it was found that many dozens of runs were necessary to generate one population with the K = 13 and 1 = 21 present in the Danish sample, 19 different populations with K from 10 to 14 and I from 17 to 23 were accepted. An examination of the D’ distributions of these various simulated populations revealed no heterogeneity in the patterns generated, and we com- bined these populations with their limited range of K ,
1 values.
Disequilibrium Analysis: HLA 637
.025
.020
.015
.010
.005
1
2 (.040, .031)
z
3
24
28
30
11
26
32
29 5 5 23
1
B8:A
-
+
linkage disequilibrium D
FIGURE 3.-All haplotypes containing the allele B8 in the disequilibrium space. The A allele designation is the position of each haplotype.
95% interval, and the range are indicated. T h e me- dian frequency of the number of haplotypes at
-
1 .Ounder neutrality is very high (40.8%). Under neutral- ity in the positive space, the frequency of the number of haplotypes declines rapidly from its maximum of 12.1 % in the 0 to +O. 1 interval. It does not drop quite to zero, however, but maintains a low and constant incidence of haplotypes with high positive
D’
values. These haplotypes with high positive D’s are all quite rare, and are responsible for the largeD’
= -1 class, consisting of related haplotypes.T h e observed distribution of
D’
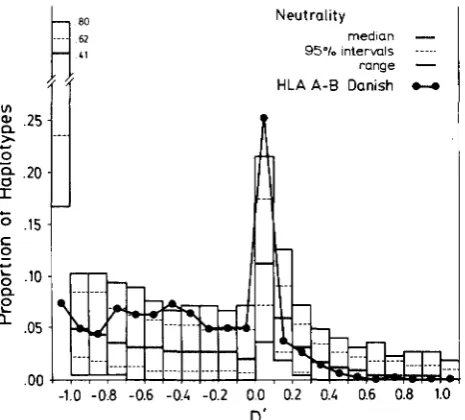
for the sample of 10,404 Danish HLA A-B haplotypes are superim- posed on the neutrality distribution in Figure 8. T h e Danish distribution is clearly different, falling close to or beyond the 95% interval in ten regions and entirely outside the range of observations from the simulations in three of these. T h e distributions differ in three areas. First, the incidence of haplotypes withD’
= -1.0 at 7.3% for the Danish population is far below that observed under neutrality. Second, for D’
rang- ing from -0.8 to 0.0 the Danish distribution exceedsthat of neutrality. Third, at 25.3% the proportion of Danish haplotypes in the
D’
interval 0 to +0.1 signif- icantly exceeds that expected under neutrality.Disequilibrium pattern analysis predicts that selec- tion favoring a small fraction of the
273
possible Danish haplotypes could produce this pattern. A small number of selected haplotypes would not be expected to stand out in the moderate to high positiveD ’
space (Figure 8). T h e related haplotypes are present in excess numbers in the negative space, while the un- related haplotypes cluster in the low positiveD’
space.DISCUSSION
Disequilibrium pattern analysis is a general method useful for revealing the evolutionary dynamics of var- iation in tightly linked highly polymorphic loci in natural populations. It has been applied here to anti- gen data from the MHC in humans, but is equally applicable to other systems and data including restric- tion fragment length polymorphisms.
638 W. Klitz and G. Thomson
.025
.02a
.015
.010
.005
-
7
44
40 15
35
27
18 X
A I
:B
8
17
37 13
22
14 39
38 45 41
7
,
I I I
standardized linkage disequilibrium
D’
FIGURE 4.-All haplotypes containing the allele A I plotted against the standardized disequilibrium D’.
in a population of Danes, we have been able to identify six haplotypes which clearly show the patterning in- dicative of a selected event. T h e 6 haplotypes are A l B 8 , A3B7, A25B18, A29Bw44, A2B15 and A l B 1 7 (Table 1). Only in two cases, A1B8 and A3B7, is the patterning apparent in both the A allele us. all B alleles graph, and vice versa. For A25B18 and A29Bw44, the pattern is observed only in the A allele us. all B alleles graph. For the cases, A2B15 and A l B 1 7 , the pattern is observed only in the B allele us. all A alleles graph. T h e conditional graphs of A l , A25, B7 and B8 show the strongest patterns indicative of selection, with the negative D’ values closely clus- tered around a single D’ value (see Figure 4 for A l ) . For the four cases in which patterning is only exhib- ited in one graph combination, patterning is always for the rarer allele us. all the alleles at the other locus (see Table 1). This is in agreement with deterministic predictions of a new allele appearing at one locus
creating a new haplotype with the existing allele at a second locus. T h e new haplotype then increases in frequency due to direct selection or hitchhiking with patterning most clearly expressed in the new allele.
T h e two cases which show patterning for both graph combinations, A1B8 and A3B7, have high, and relatively equal frequencies, for both the A and B locus alleles. T h e more frequent of the two alleles in these two cases, A I and A3, both have other significant (P
<
0.001) positive disequilibrium values. These re- sults are all compatible with deterministic predictions of selective events.Disequilibrium Analysis: HLA 639
,025
.020
.ms
.010
.005
I I
' t
8 (.041, .031) 7
(.ow
\
35
18
13 3s
14 22
37
384i
47
I
-.ms
-.010 -.w5A2:B
5
27
17
X
21
45
1
7
-.005 .010 .020
linkage disequilibrium D
FIGURE 5.-All haplotypes containing allele A 2 in the disequilibrium space.
with the more common allele of the favored haplotype (Table 1). The only exception is in the case of A29Bw44 where the rarer allele of the pair, A29, does have a significant secondary positive (A29Bw45). However, Bw44, the commoner allele has four signif- icant secondary positives, affirming the basic tend- ency. We have not attempted to classify as patterned or unpatterned the graphs of alleles with frequencies less than 1.5%, due to problems with large sampling errors for rare alleles and normalized negative dis- equilibrium values close to
-
1.Population admixture and Danish HLA A-B dis- equilibrium: Population movement and mixing is a major theme of European history. In fact, allele fre- quency data from HLA and other loci sampled from modern European populations apparently retain evi- dence of major population movements in the region (MENOZZI, PIAZZA and CAVALLI-SFORZA 1978). The clearest migratory pattern implied from this work is the movement of near-eastern neolithic farmers northward over the period from 9 to 5 thousand years ago, bringing both lifestyle and genetic changes to the
mesolithic Europeans in the process. Because of this history of admixture, a preliminary examination of the possible role of migration in influencing HLA haplotype and allele frequencies is necessary.
FELDMAN and CHRISTIANSEN (1975) showed that with suffkient differences in allele frequencies be- tween two populations at each of two linked loci, a stepping stone model of population admixture can generate high levels of disequilibrium, and that a cline in both allele frequencies and disequilibrium levels will result. In general, the HLA A-B haplotypes in Europe seem to satisfy these conditions with genetic and historical evidence of population movement and admixture from south and north and corresponding clines in both allele and haplotype frequencies for Al-B8 and A3-B7 (DAUSSET and COLOMBANI 1973). The disequilibrium levels for these haplotypes is high- est in the north, which is just as expected where the contrast in allele frequencies of the mixing popula- tions would have been the greatest.
640
13 14 21
W. Klitz and C . Thomson
22
<$
.010
005.
44
8
15
27
l 7 18
X
All
:B
3 5
5
-.OOS 0 ,005 ,010
linkage disequilibrium D
FIGURE 6.-All haplotypes containing allele A l l in the disequilibrium space.
for observed HLA allele frequency and disequilibrium data in Europe. HEDRICK and THOMSON (1983) have shown that the distribution of single locus allele fre- quencies at both HLA A and HLA B are not easily explained by migration. In discussing HLA A-B dis- equilibrium in Europe, THOMSON, BODMER and BOD-
MER (1976) pointed out that even if the admixture of mesolithic and neolithic peoples might have generated high disequilibrium levels and clines, the recombina- tion between HLA A and B over the subsequent 5000 years since farming was established in Denmark (AM-
MERMAN and CAVALLI-SFORZA 1984) would have di- minished the disequilibrium level (generated in this case by admixture) by 80%. This implies that the high positive disequilibrium levels observed in several Dan- ish haplotypes must be due to more recent events. In addition, this reminds us that disequilibrium gener- ated in some discrete period disappears over time, while clines in allele frequencies can persist much longer.
T h e predictions of disequilibrium pattern analysis enrich the discussion of the role of migration in gen- erating HLA A-B disequilibrium in the Danish by specifying the required differences in parental popu- lations necessary to generate the observed selection
patterns in the disequilibrium space. T h e proportion- ality pattern of related haplotypes in the disequilib- rium space, characteristic of selection, can be mim- icked by population admixture only when three con- ditions are met (THOMSON and KLITZ 1987). (For comparison to the selection model we refer to a single haplotype whose alleles have extreme frequency dif- ferences between the parental populations as “se- lected,” etc.) First, both of the alleles of the selected haplotype must be more common in say, population 1, than any of the other alleles in population
2.
Sec- ond, all remaining alleles in population 1 must be rarer in population 1 than in population 2. Finally, the frequencies of all of the nonselected alleles at each of the loci in population 1 must be proportional to those in population2.
T h e only feasible case meeting these conditions occurs when a haplotype is fixed in one of the parental populations. These strict require- ments for generating the selection pattern by means of admixture argues against the role of admixture in creating the major patterns of disequilibrium seen among HLA loci of the modern Danish population.Disequilibrium Analysis: HLA 641
.010
.005
R-
11
C 0
.-
U
& .10
i?
a .os
Q
. 00
I
7 8
1540 35
5 --
I I
A29:B
44
>,I4
45
I I I I
- . O M 0 .OQ5 .010
linkage disequilibrium D
FIGURE 7 .-AH haplotypes containing allele A29 in the disequilibrium space.
Neutrality
median
-
95% intermls ---
range
-
H L A A - 8 Danish M
D'
FIGURE 8.-The distribution of standardized linkage disequilib- rium D' for haplotypes at the Danish HLA A , B loci, and for 1010 replicate runs of a two locus neutrality model.
due to disease pathogens. This is supported by two independent lines of evidence. First, different HLA antigens have different patterns of immune response
to infectious agents. This work, outlined by VAN ENDEN, DE VRIES and VAN ROOD (1 982), shows a rich array of individual variation in response to major infectious agents based on HLA antigen type. Second, the change in human demography brought about by
the introduction of agriculture beginning 5000 years ago created conditions suitable for the establishment and spread of the infectious agents responsible for the epidemics of recorded history (BLACK 1975). Disequi- librium pattern analysis may be a useful aid in reveal- ing the particular alleles and haplotypes which allowed an evolutionary response to these new mortality agents.
In addition to viability selection, other agents have been proposed to influence the evolution of the MHC, including fetal maternal effects (WARBURTON 1968), segregation distortion (ALPER et al. 1985), and non- random mating (YAMAZAKI et al. 1976). T h e relative impact and combined influence of these various forces on allelic variation and on the patterns and extent of linkage disequilibrium awaits further attention.
642 W. Klitz and G. Thomson
TABLE 1
The six HLA A B haplotypes which show, in varying extent, the pattern of a selected event
Favored Allele
Additional positive disequilibria Pattern frequency
haplotype D'
A1B8 0.728 A 1 Yes
B8 Yes
A3B7 0.310 A 3 Yes
B7 Yes
A25B18 0.470 A25 Yes
B18 No
A29Bw44 0.537 A29 Yes
Bw44 No
A2B15 0.336 A2 No
B15 Yes
0.172 B17*, B37* 0.127 None
0.157 Bw35*, B14 0.143 Aw24, AX
0.019 B17, Bw37 0.037
0.025 Bw45*, B14, B21, Bw38 0.136
0.3 13
0.095 Aw24
A(w30, w31)*, Aw24, A26, Aw32, AX
A2*, Aw23*, A28*, A29*, Aw32, AX
B40*, Bw44*, B5, B17, B21, B27, BX
A1B17 0.271 A 1 Yes (secondary) 0.172 B8*, Bw37*
B17 Yes 0.039 A25, A(w30, w31)
For each of these haplotypes the allele frequencies and normalized linkage disequilibrium are given. In each case it is noted whether the pattern of selection is observed for both allele combination graphs or not. Also given are the alleles which show positive associations with an allele of the favored pair.
* Differs from D = 0 at P < 0.001, all other positive disequilibria are non-significant (P > 0.05).
of allele frequencies. Previous studies have shown that the class I and I1 HLA A, B, C ,
DQ
and DR loci, as well as the Glo-I (glyoxylase) locus, have single locus homozygosity levels significantly less than neutrality expectations (HEDRICK and THOMSON 1983, KLITZ,THOMSON and BAUR 1984,1986; HEDRICK, THOMSON
and KLITZ 1986). After consideration of various evo- lutionary factors, HEDRICK and THOMSON (1 983) sug- gested that some form of balancing selection is the explanation most consistent with the level of homo- zygosity at the HLA A and B loci in the populations they studied. Our results are not contradictory to the notion that the high levels of variation of the HLA loci is maintained by a selective mechanism, and that possibly all the HLA alleles have been subject to some degree of selection.
We thank P. HEDRICK for his helpful commentary on the man- uscript, and R. HUDSON for the use of his elegant simulation program. This research was supported by National Institutes of Health grants HD12731 and GM35326 and a UC Berkeley IBM Academic Information Systems grant.
LITERATURE CITED
ALBERT, E. D., M. P. BAUR and W. R. MAYR (Editors), 1984 Histocompatibility Testing 1984. Springer Verlag, Berlin. ALPER, C. A., A. L. AWDEH, D. D. RAUM and E. J. YUNIS,
1985 Possible human analogs of the murine T/t complex. Expl. Clin. Immunogenet. 2: 125-136.
The Neolithic Transition and the Genetics of Populations in Europe. Princeton University Press, Princeton, N.J.
AUFFRAY, C. and J. L. STROMINGER, 1986 Molecular genetics of the human major histocompatibility complex. pp. 197-247. In:
Advances in Human Genetics, Vol. 15, Edited by H. HARRIS and K. HIRSCHORN. Plenum Press, New York.
Reference tables of two and three locus haplotype frequencies for HLA-A, B, DR, BF and GLO. In: Histocompatibility Testing 1980, Edited by P. I. TERASAKI. UCLA Tissue Typing Laboratory, Los Angeles. AMMERMAN, A. J. and L. L. CAVALLI-SFORZA, 1984
BAUR, M. P. and J. A. DANILOVS, 1980
BAUR, M. P., M. NEUGEBAUER and E. D. ALBERT, 1984 Reference tables of two-locus haplotype frequencies for all MHC marker loci. pp. 677-755. In: Histocompatibility Testing 1984, Edited by E. D. ALBERT, M. P. BAUR and W. R. MAYR. Springer-Verlag, Berlin.
BAUR, M. P., M. NEUGEBAUER, H. DEPPE, M. SIGMUND, T. LUTON, W. R. MAYR and E. D. ALBERT, 1984 Population analysis on the basis of deduced haplotypes, pp. 333-341. In: Histocompat- ibility Testing 1984, Edited by E. D. ALBERT, M. P. BAUR and W. R. MAYR. Springer-Verlag, Berlin.
BLACK, F. L., 1975 Infectious diseases in primitive societies. Sci- ence 187: 515-518.
BODMER, J. G. and W. F. BODMER, 1970 Studies on Africa pyg- mies. IV. A comparative study of the HL-A polymorphism in the Babinga pygmies and other African and Caucasian popu- lations. Am. J. Hum. Genet. 22: 396-4 1 1.
Population genetics and evolution of the HLA system. pp. 280-295. In: HLA and Disease. Edited by J. DAUSSET and A. SVEJGAARD. Munksgaard, Copenhagen.
CEPPELLINI, R., E. S . CURTONI, P. C. MATTIUZ, V. MIGGIANO, G. SCUDDELER and A. SERRA, 1967 Genetics of leukocyte anti- gens. A family study of segregation and linkage. In: Histocom- patibility Testing 1967, Edited by E. S. CURTONI, P. L. MATTIUZ and R. M. TOSI. Munksgaard, Copenhagen.
DAUSSET, J. and P. J. COLOMBANI (Editors), 1973 Histocompatibility Testing 1972. Munksgaard, Copenhagen.
FELDMAN, M. W. and F. B. CHRISTIANSEN, 1975 The effect of population subdivision on two loci without selection. Genet. Res. 24: 151-162.
HANSEN, H. E., S. 0. LARSEN, L. P. RYDER and L. S. NIELSON, 1979 HLA-A, B haplotype frequencies in 5,202 unrelated Danes by a maximum likelihood method of gene counting. Tissue Antigens 19: 143-153.
Evidence for balancing selection at HLA. Genetics 104: 449-456.
A two-locus neutrality test: applications to humans, E. coli and lodgepole pine. Ge- netics 112: 135-156.
Evolutionary genetics; HLA as an examplary system. pp. 583-606. In: Evo-
BODMER, W. and G. THOMSON, 1977
HEDRICK, P. W. and G. THOMSON, 1983
HEDRICK, P. W. and G. THOMSON, 1986
Disequilibrium Analysis: HLA 643
lutionary Processes and Theory, Edited by S. KARLIN and E. NEVO. Academic Press, New York.
HOOD, L., M. STEINMETZ and B. MALISSEN, 1983 Genes of the major histocompatibility complex of the mouse. Annu. Rev. Immunol. 1: 529-568.
Properties of a neutral allele model with intragenic recombination. Theor. Popul. Biol. 2 3 183-201.
Genetics of the major histocompatibility complex: the final act. Annu. Rev. Immunol. 1: 119-142.
KLITZ, W., G. THOMSON and M. P. BAUR, 1984 T h e nature of
selection in the HLA region based on population data from the ninth workshop. pp. 330-332. In: Histocompatibility Testing
1984, Edited by E. D. ALBERT, M. P. BAUR and W. R. MAYR. Springer-Verlag, Berlin.
KLITZ, W., G. THOMSON and M. P. BAUR, 1986 Contrasting evolutionary histories among tightly linked HLA loci. Am. J. Hum. Genet. 3 9 340-349.
Basic features of the HLA systems. In: HLA in Endocrine and Metabolic Disorders, Edited by N. R. FARID. Academic Press, New York.
LEW, A. M., E. P. LILLEHOJ, E. P. COWAN, W. L. MALOY, M. R.
JAN ~CHRAVENDIJK and J. E. COLICAN, 1986 Class I genes and molecules: an update. Immunol. Today 57: 3-18.
LOH, D. Y. and D. BALTIMORE, 1984 Sexual preference of appar- HUDSON, R. R., 1983
KLEIN, J., F. FICUEROA and Z. A. NAGY, 1983
LARSEN, B., 1981
ent gene conversion events in MHC genes of mice. Nature 309
MENOZZI, P., A. PIAZZA and L. L. CAVALLI-SFORZA, 1979
Synthetic maps of human gene frequencies in Europeans. Sci- ence 201: 786-792.
THOMSON, G., 1981 A review of theoretical aspects of HLA and disease associations. Theor. Popul. Bid. 2 0 168-208.
THOMSON, G., W. F. BODMER and J. BODMER, 1976 T h e HL-A system as a mode for studying the interaction between selection, migration and linkage. In: Population Genetics and Ecology,
Edited by S. KARLIN and E. NEVO. Academic Press, New York. THOMSON, G. and W. KLITZ, 1987 Disequilibrium pattern analy-
sis. 1. Theory. Genetics 1 1 6 623-632.
VAN ENDEN, W., R. R. P. DE VRIES and J. J. VANROOD, 1982 HLA and infectious diseases. pp. 37-54. In: Human Genetics, Part E : Medical Aspects, Edited by B. BONNE-TAMIR. Alan R. Lis, New York.
WARBURTON, F. E., 1968 Maintenance of histocompatibility pol- ymorphisms. Heredity 2 3 151-152.
" S O N , J. AB^, J. BOYSE, Z. A. ZAYAS and L. THOMAS,
1976 Control of mating preferences in mice by genes of the major histocompatibility complex. J. Exp. Med. 144: 1324- 1335.
Communicating editor: W. J. EWENS
639-640.