Experimental Study of the Behaviour of Deep
Beams Using Light-Weight Structural Leca
Concrete
Anis A. Mohamad Ali
1, Hussein R. Lazim
2Professor, Department of Civil Engineering, University of Basrah , Iraq1 M.Sc. Student, Department of Civil Engineering, University of Basrah, Iraq2
ABSTRACT: This paper studies the structural behaviour of deep beams using lightweight concrete. The experimental
program consisted of testing twelve simply supported deep beams specimens tested under static two-point loading. The dimensions were (1300×150×400) mm. Light expanding clay aggregate (LECA) was used to product lightweight concrete. Test variables were depth of deep beams, lightweight concrete density, ratio of main reinforcement, ratio and shape of web reinforcement and shear span to depth ratio (a/h). Effects of these variables on behaviour of lightweight deep beam were studied, the behaviour including Crack patterns, first crack load; ultimate loads and reserve strength, load-deflection response, flexural strains distribution and shear strains.
KEYWORDS:Deep beam, lightweight concrete, LECA, strain gage, crack pattern
I. INTRODUCTION
Reinforced concrete deep beams are widely used in buildings, bridges and infrastructures. Deep beams are applying as foundation wall or raft slab, shear walls in building, and it is also used in water tank structure. The beam with shear span to depth ratio (a /d) less than 1 is classified as Deep beam and a beam with a / d ratio exceeding 2.5 as ordinary beam. The assumption "plane section before bending remains plane after bending" which valid for ordinary beam; it is not valid for deep beam and the distribution of flexural strain along depth at mid span is nonlinear. Deep beams begin to crack at loads ranging from 1/3 to 1/2 ultimate load.[1] Currently, the major codes and manuals that contain some discussion of deep beams including the American ACI Building Code, the draft Euro code EC/2, the Canadian Code, and the CIRIA Guide No. 2. The CIRIA Guide No. 2 gives the most comprehensive recommendations and is the only one that covers the buckling strength of slender beams.[2, 4] According to ACI Building Code 318-11, Deep beams are members loaded on one face and supported on the opposite face so that compression struts can develop between the loads and the supports, and have either: Clear spans, ln, equal to or less than four times the overall member depth; or
Regions with concentrated loads within twice the member depth from the face of the support.[3]
made by the sinter strand process, and 300 to 650 kg/m3 when made in a rotary kiln. These aggregates produce concrete with a density usually within the range of 1400t o 1800 kglm3. [7] In this study, light expanded clay aggregates (LECA) are used in production structural lightweight concrete.
II. MATERIALSANDMETHODS
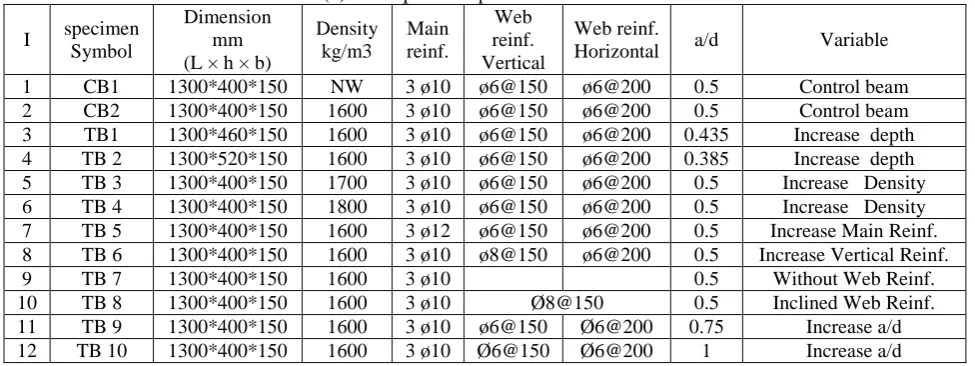
A total of twelve deep beams were tested. The beams were divided into two groups, control beams group and test beams. Table (1) shows a description about the specimens details and the variables. All beams were of rectangular cross section, all beams have length of 1300mm and width of 150 mm, ten beams have depth of 400mm and two beams have depth of 460 mm and 520 mm. For all beams the clear span between the supports was 1000 mm. The top longitudinal reinforcement bar was 10 mm diameter while the bottom main reinforcement were varied from 10 mm to 12 mm diameter, deformed steel bars extended over the entire length of the beam and anchored adequately at the ends with 90° bends not less than 17.5 times diameter of bars. Horizontal and vertical web reinforcements were used varied from 6 mm to 8 mm diameter deformed steel bar. To avoid local bearing, rubber pads were seated at loading and supporting points. Control beams and tested beams are designed according to CIRIA guide 2 which gives 3ø10 mm for main reinforcement, ø6 at 150mm for vertical web reinforcement and ø6 at 200 mm for horizontal web reinforcement. Control beams (CB) consist of two beams, one of them with normal weight concrete and the other with lightweight concrete. Test beams (TB) consist of ten beams, the variables were the effect of depth to study size effect (two beams), effect of density (two beams), effect of main and web reinforcement (four beams), and effect of shear span to depth ratio (a/h) (two beams) .
Table (1) Description of specimens and test variables I specimen
Symbol
Dimension mm (L × h × b)
Density kg/m3
Main reinf.
Web reinf. Vertical
Web reinf.
Horizontal a/d Variable 1 CB1 1300*400*150 NW 3 ø10 ø6@150 ø6@200 0.5 Control beam 2 CB2 1300*400*150 1600 3 ø10 ø6@150 ø6@200 0.5 Control beam 3 TB1 1300*460*150 1600 3 ø10 ø6@150 ø6@200 0.435 Increase depth 4 TB 2 1300*520*150 1600 3 ø10 ø6@150 ø6@200 0.385 Increase depth 5 TB 3 1300*400*150 1700 3 ø10 ø6@150 ø6@200 0.5 Increase Density 6 TB 4 1300*400*150 1800 3 ø10 ø6@150 ø6@200 0.5 Increase Density 7 TB 5 1300*400*150 1600 3 ø12 ø6@150 ø6@200 0.5 Increase Main Reinf. 8 TB 6 1300*400*150 1600 3 ø10 ø8@150 ø6@200 0.5 Increase Vertical Reinf. 9 TB 7 1300*400*150 1600 3 ø10 0.5 Without Web Reinf. 10 TB 8 1300*400*150 1600 3 ø10 Ø8@150 0.5 Inclined Web Reinf. 11 TB 9 1300*400*150 1600 3 ø10 ø6@150 Ø6@200 0.75 Increase a/d 12 TB 10 1300*400*150 1600 3 ø10 Ø6@150 Ø6@200 1 Increase a/d Materials used in experimental investigations are available in local market, which include cement, natural gravel, natural silica sand, water, and deformed reinforcement bars except light expanding clay aggregate (leca) which was imported from Iran. Light expanded clay aggregate (LECA) was used as lightweight coarse aggregate. In the present study the leca of gradation (4-10) mm was used because it is suitable for the production of structural lightweight concrete.
III. EXPERIMENTALPROGRAM
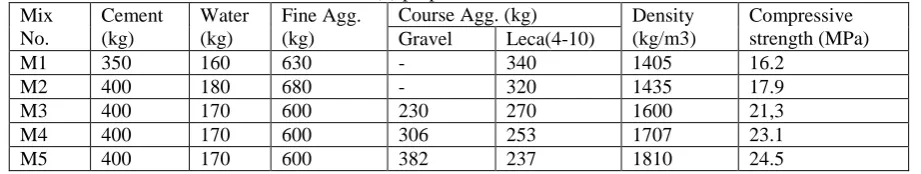
material took from previous researches (used only LECA as course aggregate), in mix (M2) the cement content and fine aggregate content were increased while the LECA content and water ratio were decreased. In mix (M3) the fine aggregate content were increased and 15% of course aggregate volume replaced with normal weight gravel , mix (M4& M5) were same mix (M3) with increased gravel volume to 20% & 25% and decreased LECA volume to 80% & 25% respectively.
Table (2) properties of trail mixes Mix
No.
Cement (kg)
Water (kg)
Fine Agg. (kg)
Course Agg. (kg) Density (kg/m3)
Compressive strength (MPa) Gravel Leca(4-10)
M1 350 160 630 - 340 1405 16.2 M2 400 180 680 - 320 1435 17.9 M3 400 170 600 230 270 1600 21,3 M4 400 170 600 306 253 1707 23.1 M5 400 170 600 382 237 1810 24.5
Timber forms with plywood face were used in casing beams, the interior face of forms were coated with oil prior casting and before the reinforcement cage was placed in position, plastic spacers were used to maintain the concrete covers. Tilting drum mixer was used, the interior surface of the mixer drum was cleaned and moistened before use. LECA required for mixes were soaked in water for 24 hr and then spread on dry place to obtain LECA in saturated surface dry (SSD) condition and the mix water was computed as if LECA were non-absorbent. The dry ingredients were added in the following order, about one half of the coarse aggregate, all the fine aggregate, all the cement, and finally the remaining part of the coarse aggregate. Then the water was added and mixing was started. The period of mixing ranged from two to three minutes so that a homogenous mix was obtained. After the mixing process was completed, concrete was poured in the forms and then compacted mechanically by using a standard pencil vibrator to ensure the proper placement and consolidation of the concrete in and around the reinforcement cage, The top surface of concrete was leveled and smoothly finished after casting was completed using hand trowel .
During the casting of beams, three (150 x150x150) mm cubes and two (100 x 200) mm cylinders were made for each mix. After cleaning and lubricating the molds, concrete was cast and compacted and then cured under the same conditions of beams. Table (3) shows the average compressive and tensile strength of both normal and lightweight concrete for all beams and its mixes. Mix (M3) was used to cast all lightweight concrete deep beams excepted TB3 which was cast with mix (M4) and TB4 which was cast with mix (M5). For normal concrete one mix (MN) were used (Cement 1: Sand 1.5: Gravel 3) Water/ cement ratio (W/C ratio= 0.55). The quantities of cement, fine aggregate and course aggregate based on dry weights. Mix was designed to give a compressive strength of about 30 N/mm2 at age of 28 days and slump of about 8 cm. This mix was used to cast the control beam (CB1).
Table (3): Concrete strength of the tested specimens
I Specimen Mix 𝒇𝒄𝒖 (N/mm2) 𝒇𝒕 (N/mm2)
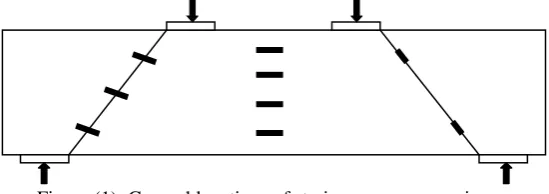
A TML foil strain gauge type PFL-30-11-3L was used in this work. This type is mainly used for strain measurement in concrete. Strain gages were used to determine concrete flexural strains along mid span and concrete shear strain in the shear span along the inclined line between load and support. Table (4) and figure (1) shows the locations of strain gauges on deep beam specimens. These locations are allocated to measure the concrete strains along beam depth and diagonals lines within shear span to investigate the flexural and shear behaviour respectively. The strain gages for deep beams were instrumented; and then they were carried to the load cell which was automatic compression testing machine with a capacity of (600 kN) that used to apply the load.
Table (4): Strain gauges locations on specimens
Specimen location direction NO. Distance( mm) CB1,CB2,TB3,
TB4,TB5,TB6, TB7,TB8
Left side Perpendicular to inclined line between support and load 3
From support 80 224 368 Right side Parallel with inclined line 2 100 350 CB1,CB2 Mid span Parallel with beam length 4 From bottom
80 160 240 320
TB1
Left side Perpendicular to inclined line between support and load 3
From support 80 250 420 Right side Parallel with inclined line 2 100 400
Mid span Parallel with beam length 4 From bottom 80 180 280 380
TB2
Left side Perpendicular to inclined line between support and load 3
From support 80 280 480 Right side Parallel with inclined line 2 100 460
Mid span Parallel with beam length 4 From bottom 80 200 320 440
TB9
Left side Perpendicular to inclined line between support and load 3
From support 80 250 420 Right side Parallel with inclined line 2 100 400
Mid span Parallel with beam length 4 From bottom 80 160 240 360
TB10
Left side Perpendicular to inclined line between support and load 3
From support 80 280 480 Right side Parallel with inclined line 2 100 460
IV. GENERALBEHAVIOROFDEEPBEAMANDCRACKPATTERN
All tested deep beams failed in shear with a little effect or no bearing failure for concrete close supports and load points (No local crashing failure). End anchorage of the main bars functioned properly during testing and does not affect the failure mode of the deep beams. Flexure cracks were observed near the mid span of the deep beams at about (26.6% - 38.8%) of failure load, those flexure cracks did not substantially grow during the subsequent increment of loading .When the load was increased, diagonal web cracking (inclined cracks) started at the mid depth in parallel of critical path between support and load point in mid of shear spans at about (40.5% - 58.5%) of failure load. There were also other cracks appeared parallel to it. When additional load was applied, one of inclined cracks became more prominent than the others, and propagated towards the loads and support points, eventually this crack caused the shear failure of the beam. The failure mode was diagonal splitting failure.
V. EFFECTOFVARIABLESONDIAGONALCRACKINGLOADANDULTIMATELOAD
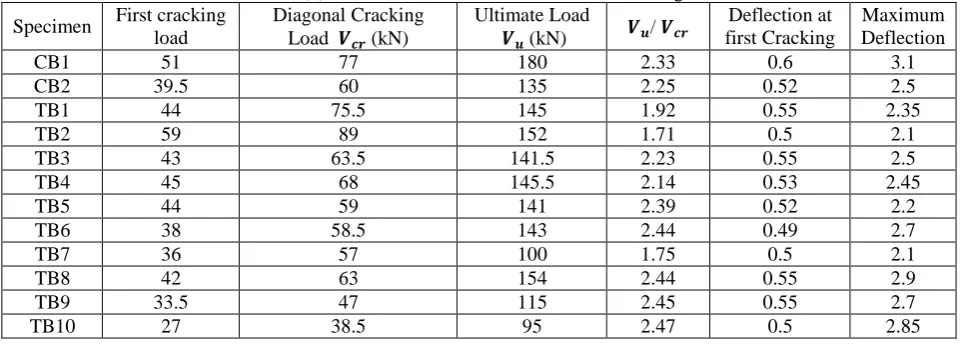
First diagonal Cracking load and ultimate load are considered as good measure for the sake of studying the behavior of deep beam. Diagonal cracking load defined as the load at which the first inclined crack can be detected in the shear span of deep beam (the diagonal tension crack develop fully in the shear span). Ultimate load defined as the load at which deep beam failed in shear by one or more of shear cracks and its value detected during the test by observing the gauge of the machine. The cracking load is much lesser than the ultimate load. The beams exhibited high shear strengths after diagonal cracking. The difference between the ultimate shear load and the diagonal cracking load is considered as the reserve strength of deep beams. The ratio of the ultimate shear load Vu to the diagonal cracking load Vcr, was calculated to estimate the reserve strength of deep beams. The values of cracking loads and ultimate loads and the ratios of ultimate load to cracking load are listed in Table (5).
Table (5) loads and deflections at first and failure stages.
Maximum Deflection Deflection at
first Cracking
𝑽𝒖/ 𝑽𝒄𝒓
Ultimate Load
𝑽𝒖(kN)
Diagonal Cracking Load 𝑽𝒄𝒓(kN)
First cracking load Specimen
3.1 0.6
2.33 180
77 51
CB1
2.5 0.52
2.25 135
60 39.5
CB2
2.35 0.55
1.92 145
75.5 44
TB1
2.1 0.5
1.71 152
89 59
TB2
2.5 0.55
2.23 141.5
63.5 43
TB3
2.45 0.53
2.14 145.5
68 45
TB4
2.2 0.52
2.39 141
59 44
TB5
2.7 0.49
2.44 143
58.5 38
TB6
2.1 0.5
1.75 100
57 36
TB7
2.9 0.55
2.44 154
63 42
TB8
2.7 0.55
2.45 115
47 33.5
TB9
2.85 0.5
2.47 95
38.5 27
TB10
increased from ø6 at 150mm to ø8 at 150mm the ultimate load increased by 6% and the reserve strength increased by 19%. For deep beam (TB7) which without web reinforcement, ultimate load reduced by 26% decreased and reserve strength decrease by 50%. When inclined web reinforcement Ø8 at 150mm was used with TB8, ultimate load increase by 14% and reserve strength increase by 19%. As a result, ultimate load and reserve strength directly proportional with the ratio and shape of web reinforcement. Cracking load was slightly effected by web reinforcement. Increasing shear span to depth ratio (a/h) to 0.75 (TB9) and 1 (TB10) caused a decrease in diagonal cracking load by 21.7% and 35.8% , ultimate load decreased by 18.5% and 29.6%, and reserve strength increased by 20% and 22% respectively.
VI. EFFECTOFVARIABLESONLOAD-DEFLECTIONRESPONSE
Deflections were measured in this study at mid span of deep beam using dial gauge. In general, all deep beams exhibited similar overall behavior, which was characterized by a nearly bilinear response. The load-deflection relationship is linear before the appearance of the first cracking in concrete. After first cracking of concrete, the slope of load-deflection curves decreased and nonlinear relationship begins due to inelastic deformation in concrete after cracking, this continue until reaching ultimate load. After ultimate load, deflection is increased rapidly with constant or drop in loading. For deep beams with lightweight concrete, the initial slope of load-deflection curve in the elastic range is flatter than deep beam with normal weight concrete, it is due to lower modulus of elasticity for lightweight concrete. After the crack appeared in the concrete, deflection for normal weight concrete deep beam is more than lightweight concrete deep beam therefore; maximum deflection for lightweight concrete deep beam is less compared to deep beam with normal weight concrete. See Table (5)
The load-deflection curves of each deep beam are shown in Fig (2). It can be seen that with increased depth of deep beams (TB1 and B2), the maximum deflections at ultimate load decreased. Deep beam which have 520 mm depth exhibited smaller deflections at ultimate load and their failure is relatively brittle. The density increment of lightweight concrete have little effect on maximum deflection and the behavior of load deflection curve. Increasing the amount of main tensile reinforcement (TB5) decreases deflection at ultimate load and effect on deflection slightly before first crack appeared. But after first cracking, it can be observed that the increase of deflection is faster for deep beam with low amount of main reinforcement. By increasing the amount of vertical web reinforcement (TB6), there is a little effect on the value of maximum deflection. In the deep beam without web reinforcement (TB7), the value of maximum deflection was decreased .When inclined web reinforcement was used (TB8), the value of maximum deflection increased clearly. By observing load-deflection curves, it can be noticed that curve after cracking become flatter for deep beams with low amount of web reinforcement. Therefore, the deep beams with high amount of web reinforcement behave stiffer than those with low web reinforcement. This stiffness was improved when used inclined web reinforcement and be small without web reinforcement. This means that web reinforcement have little effect on deep beam stiffness before appearance of diagonal cracks, but after the appearance of diagonal cracking, this effect will be pronounced and be the dominant on deep beam stiffness . When the shear span to depth ratio (a/h) was increased maximum deflection and reduced the deep beam’s stiffness before and after cracking. It is observed when (a/h) increased from 0.5 to 0.75 and 1 (TB9 andTB10) maximum deflection increased from 2.5mm to 2.7mm and 2.85mm respectively. The slope of load deflection curve before and after cracking for deep beam with (a/h) of 0.5 is larger than those with (a/h) of 0.75 and 1.
0 20 40 60 80 100 120 140 160 180 200
0 0.5 1 1.5 2 2.5 3 3.5
L
oa
d
(K
N
)
deflection (mm)
Normal and lightweight concrete
N.W.C L.W.C
0 20 40 60 80 100 120 140 160
0 0.5 1 1.5 2 2.5 3
L
oa
d
(K
N
)
deflection (mm)
Effect of Deep Beam depth
d=400 mm d= 460 mm d=520 mm
0 20 40 60 80 100 120 140 160
0 0.5 1 1.5 2 2.5 3
L
oa
d
(K
N
)
deflection (mm)
Effect of lightweight Concrete Density
Figure (2): Experimental Load-deflection curves
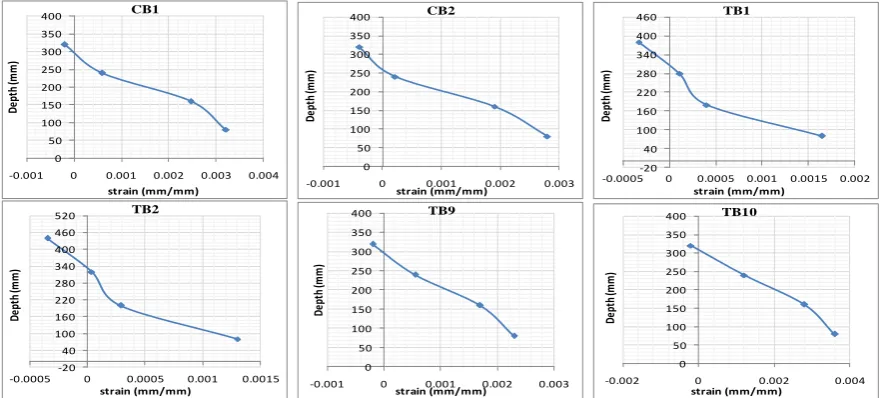
VII. EFFECTOFVARIABLESONFLEXURALSTRAIN
The variations of flexural strain were measured at mid span of the deep beam for six specimens. The aim was to study the effect of lightweight concrete, beam depth, and shear span to depth ratio (a/h) on the distribution of flexural strain. As shown in figure (3), it can be observed that behavior of flexural strain distribution in both lightweight and normal weight concrete deep beams is non-linear. At failure, strains in extreme tension and compression zone are greater for NWC deep beam, that is due to the load capacity of NWC deep beam (CB1) is more than LWC deep beam (CB2). Also it can be seem that when the shear span to depth ratio(a/h) increases (CB1,TB9,) the nonlinearity of flexural strain behavior decreases, strains in tension and compression zone increase in spite of the drop in load capacity. Large depth deep beam exhibited more pronounced deviation of the strain pattern at mid-span and strains decreases with the increase of deep beam depth in spite of an increase in load at failure.
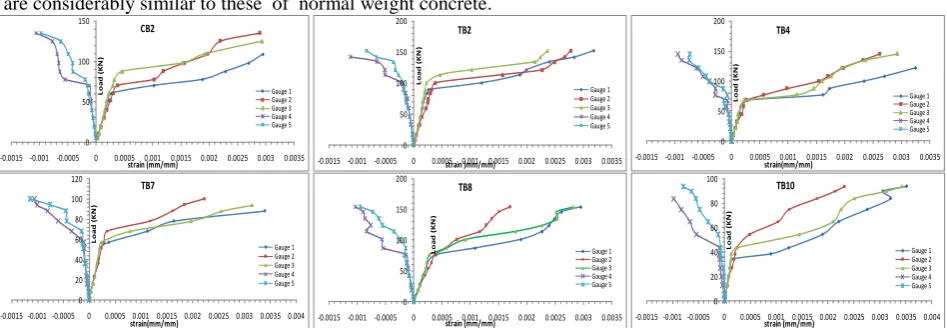
Figure (3): Flexural strain distribution along mid span VIII. EFFECTOFVARIABLESONSHEARSTRAIN
Shear strain variation in shear span region measured experimentally by electrical strain gauge along the diagonal cracking line between loading point and support plates for all specimens. For all deep beams, three strain gauges were attached on left side perpendicular to crack path . These gauges used to shear strain measurement. Additional two strain gauges were attached to right side parallel to inclined line. The main purpose of those gauges was to measure the compressive strain in strut (compression member described in STM). Figure(1) and Table (4) shows the location of strain gauges on specimens. Loads- shear strain plots for all deep beams are shown in figure (4), the right curves represent the shear strain versus load calculated by gauges(1,2,3) and the left curves represent the compression strain
0 20 40 60 80 100 120 140 160
0 0.5 1 1.5 2 2.5 3
L oa d (K N ) deflection (mm)
Effect of MainTensile Reinf.
ρ=0.0042 ρ=0.0061 0 20 40 60 80 100 120 140 160 180
0 0.5 1 1.5 2 2.5 3 3.5
L oa d (K N ) deflection (mm)
Effect of Vertical Web Reinf.
ρ=0.001 ρ=0.0018 Without Web Reinf. Inclined Web Reinf.
0 20 40 60 80 100 120 140 160
0 0.5 1 1.5 2 2.5 3
L oa d (K N ) deflection (mm)
Effect of Shear Span to Depth ratio (a/h)
a/h =0.5 a/h =0.75 a/h =1 0 50 100 150 200 250 300 350 400
-0.001 0 0.001 0.002 0.003 0.004
De pt h (m m ) strain (mm/mm) CB1 0 50 100 150 200 250 300 350 400
-0.001 0 0.001 0.002 0.003
De pt h (m m ) strain (mm/mm) CB2 -20 40 100 160 220 280 340 400 460
-0.0005 0 0.0005 0.001 0.0015 0.002
De pt h (m m ) strain (mm/mm) TB1 -20 40 100 160 220 280 340 400 460 520
-0.0005 0 0.0005 0.001 0.0015
De pt h (m m ) strain (mm/mm) TB2 0 50 100 150 200 250 300 350 400
-0.001 0 0.001 0.002 0.003
De pt h (m m ) strain (mm/mm) TB9 0 50 100 150 200 250 300 350 400
-0.002 0 0.002 0.004
versus load calculated by gauge (3,4). For all specimens, it was observed that shear strain before first diagonal cracking was very small and increased rapidly after diagonal crack developing. Gauge (1) was affected at first by cracks and its reading increased directly after first diagonal crack. Sometimes gauges were cut due to cracks passing through it. Shear strain behavior of LWC beam are similar to NWC beam. It has been observed that at failure, the compressive strain in strut was relatively small and not exceed (0.0012).
IX. CONCLUSIONS
Based on the test results the following main conclusions can be drawn:
The general behavior of deep beams under loading, progressing of cracks, and failure mode of lightweight concrete are considerably similar to these of normal weight concrete.
Figure (4): load versus shear and compression strains at shear span
The using of LWC instead of NWC decreased first diagonal cracking and ultimate loads. For deep beams with lightweight concrete, the initial slope of load-deflection curve in the elastic range is flatter than deep beam with normal weight concrete due to lower modulus of elasticity for lightweight concrete. However, maximum deflection for LWC deep beam was lesser.
Increasing the density of lightweight concrete was increased load capacity and effected slightly on beam deflection.
In large depth LWC deep beam, the ultimate load was increased and the deflection was decreased. Shear strength provided by deep beams after appearance of first diagonal crack (reserve strength) are greater in deep beam with small depth, i.e. large depth deep beam exhibited brittle failure.
The increment of main tensile reinforcement caused rising in load carrying capacity of LWC deep beam and reduction in maximum deflection.
The increasing of vertical web reinforcement ratio improved the behavior of LWC deep beam by increasing ultimate load, maximum deflection and stiffness after first cracking. This improvement raised with using inclined web reinforcement and dropped in beam without web reinforcement.
When shear span to depth ratio (a/h) was increased, there was increasing in maximum deflection and beam strength after cracking (reserve strength) and reduction in the first cracking and ultimate loads were decreased.
The flexural strains distribution at midspan of LWC deep beams are nonlinear same as in NWC deep beam. This nonlinearity increased in large depth beam and reduced with increase shear span to depth (a/h) ratio.
Shear strains in shear span between support and load plates were very small before diagonal cracks development. When diagonal cracks appeared, it was rapidly increased and reached to extreme value.
The initial slope of load - shear strain plots for LWC deep was flatter than that for NWC deep beam. Strain in LWC beams are the greatest in spite of the lower load capacity; that was due to the lower modulus of elasticity of LWC.
The failure was not caused by concrete crashing in compression strut between support and load. Compression strain in strut was relatively small and not exceeds (0.0012).
0 50 100 150
-0.0015 -0.001 -0.0005 0 0.0005 0.001 0.0015 0.002 0.0025 0.003 0.0035
L oa d (K N ) strain (mm/mm) CB2 Gauge 1 Gauge 2 Gauge 3 Gauge 4 Gauge 5 0 50 100 150 200
-0.0015 -0.001 -0.0005 0 0.0005 0.001 0.0015 0.002 0.0025 0.003 0.0035
L o a d ( K N ) strain )mm/mm) TB2 Gauge 1 Gauge 2 Gauge 3 Gauge 4 Gauge 5 0 50 100 150 200
-0.0015 -0.001 -0.0005 0 0.0005 0.001 0.0015 0.002 0.0025 0.003 0.0035
L oa d (K N ) strain(mm/mm) TB4 Gauge 1 Gauge 2 Gauge 3 Gauge 4 Gauge 5 0 20 40 60 80 100 120
-0.0015 -0.001 -0.0005 0 0.0005 0.001 0.0015 0.002 0.0025 0.003 0.0035 0.004
L o a d ( K N ) strain(mm/mm) TB7 Gauge 1 Gauge 2 Gauge 3 Gauge 4 Gauge 5 0 50 100 150 200
-0.0015 -0.001 -0.0005 0 0.0005 0.001 0.0015 0.002 0.0025 0.003 0.0035
L oa d (K N ) strain (mm/mm) TB8 Gauge 1 Gauge 2 Gauge 3 Gauge 4 Gauge 5 0 20 40 60 80 100
-0.0015 -0.001 -0.0005 0 0.0005 0.001 0.0015 0.002 0.0025 0.003 0.0035 0.004
REFERENCES
[1]McCormac J.C. and Brown R.H, "Design of reinforced concrete", John Wiley & Sons, Ninth Edition,( 2014) [2]Kong, F.K., "Reinforced Concrete Deep Beams", Taylor and Francis Inc., (2002)
[3]ACI Committee 318, “Building Code Requirements for Structural Concrete (318-11) and Commentary”, American Concrete Institute, Detroit,( 2011).