ABSTRACT
PARK, JUNG HYUN. Technical Considerations for the Design of Smart Apparel for the Overweight. (Under the direction of Dr. Hoon Joo Lee and Prof. Nancy Powell.)
According to the National Center for Health Statistics of the U.S. Department of Health and Human Services approximately 65% of adults in the United States were overweight in the period of 2003~2006. Overweight and obesity are associated with increased health risks and estimated medical expenditure attributed to obesity reached $147 billion in 2008.
Various smart healthcare clothing, monitoring vital signs such as blood pressure, heart rate, electrocardiogram (ECG), respiration, and body temperature, have been presented by researchers and is in great demand owing to an increasing interest in health and well-being.
Waist circumference provides important information related to body fat and multiple health risks. This research is an investigation to develop smart apparel for the overweight, called Body Monitoring Smart Apparel (BMSA). BMSA was designed in order to measure waist circumference and convey the information to users participating weight management. A textile sensor, called elastic strain gauge, made of carbon black and polyurethane was developed in order to measure body circumference.
Technical Considerations for the Design of Smart Apparel for the Overweight
by Jung Hyun Park
A thesis submitted to the Graduate Faculty of North Carolina State University
in partial fulfillment of the requirements for the Degree of
Master of Science
Textiles
Raleigh, North Carolina 2009
APPROVED BY:
Dr. Hoon Joo Lee
Chair of Advisory Committee Co-Chair of Advisory Committee Prof. Nancy Powell
BIOGRAPHY
ACKNOWLEDGEMENTS
I would like to thank my advisor Dr. Hoon Joo Lee for her advice, support, and guidance throughout this study. Her continuous encouragement made this work possible. Prof. Nancy Powell, Co-Chair of my advisory committee, contributed much to my understanding of smart apparel development. She gave me valuable comments, suggestions and encouragement. Appreciation is also extended to Dr. Katherine Carroll, member of the advisory committee, for her valuable advice, suggestions, and encouragement for apparel design.
I also thank Dr. Cynthia L. Istook for her support, Dr. Robert Fornaro from Department of Computer Science for his help with the electronic device, Dr. Hee Kyun Kim for her valuable comments for the garment pattern. I am also grateful to Mr. Timothy Mumford (Filament Lab Manager), Mr. Sherwood Wallace (Nonwoven Institute Lab Operation Manager), and Mr. William R Barnes (Fiber Science Lab Manager) for their technical support. I also would like to thank The Dow Chemical Company for providing polyurethane and Cabot Corporation for providing carbon black for this project.
TABLE OF CONTENTS
LIST OF TABLES ... iv
LIST OF FIGURES ... viii
1 INTRODUCTION ... 1
2 REVIEW OF LITERATURE... 4
2.1 Overweight and obesity ... 5
2.1.1 Definition of overweight and obesity ... 5
2.1.1.1 Body mass index (BMI) ... 5
2.1.1.2 Waist circumference (WC) ... 6
2.1.1.3 Skin-fold thickness ... 7
2.1.2 World obesity ... 7
2.1.3 Prevalence of overweight in the US ... 8
2.1.4 Health consequences by overweight and obesity ... 11
2.1.5 Economic lost of overweight and obesity in the US ... 11
2.1.6 Waist circumference and health risk ... 12
2.1.7 Waist circumference as an indicator of accumulation of visceral adipose tissue ... 14
2.1.8 Body shapes of overweight adults women ... 17
2.2 Smart healthcare clothing ... 19
2.3 Technology of the textile sensor as a strain gauge ... 22
2.4 Role of computer-aided technical design ... 29
2.4.1 Needs of computer-aided technical design ... 29
2.4.2 Body generation ... 33
2.4.3 Mesh generation ... 35
2.4.4 Flattening system ... 36
2.4.5 Virtual draping system ... 40
2.4.6 Accuracy of fit ... 44
2.5 Summary of literature review ... 44
3.1 Design of research ... 47
3.2 Design concept of BMSA ... 49
3.3 BMSA selections ... 49
3.4 Development of textile sensor ... 50
3.4.1 Materials ... 50
3.4.1.1 Carbon black ... 50
3.4.1.2 Polyurethane ... 50
3.4.2 Molding elastic strain gauge ... 51
3.4.2.1 Compounding and Extrusion using Hakke MiniLab ... 51
3.4.2.2 Heat Pressing ... 52
3.4.3 Test of elastic strain gauge ... 53
3.4.3.1 Scanning Electron Microscopy (SEM)... 53
3.4.3.2 Electric resistance ... 54
3.4.3.3 Washing test ... 54
3.5 Manufacturing and testing of BMSA prototype ... 54
3.5.1 Construction of BMSA prototype ... 55
3.5.2 Fabric selection ... 56
3.5.2.1 Direction of stretch of the fabric ... 57
3.5.3 Ratio of reduction according to the stretch fabric types ... 57
3.5.4 Body scanning of dress form ... 59
3.5.5 List of measurements ... 60
3.5.6 Pattern Design using CAD ... 62
3.5.6.1 Drafting a leotard sloper ... 63
3.5.7 CAM ... 67
3.5.8 Fixing strain gauge on the fabric... 68
3.5.8.1 Casing ... 68
3.5.8.2 Zigzag stitch ... 68
3.5.9 Dress form simulation ... 69
4 RESULTS AND DISCUSSION ... 70
4.1 Design concept of BMSA ... 70
4.2 BMSA selection options ... 72
4.2.1 Body shapes ... 72
4.2.2 Comparison of body measurement and adjustment for pattern design ... 74
4.2.3 Pattern design ... 76
4.2.4 Garment preference ... 81
4.2.5 BMSA selection options ... 82
4.3.1 Scanning Electron Microscopy (SEM) ... 84
4.3.2 Electric resistance measurement of elastic strain gauge ... 86
4.3.3 Washing test ... 90
4.4 Electric resistance measurement of elastic strain gauge ... 97
4.5 Summary of results ... 100
5 CONCLUSION ... 102
6 LIMITATIONS AND FUTURE WORK ... 105
6.1 Limitations ... 105
6.2 Future work ... 105
REFERENCES ... 107
APPENDICES ... 116
Appendix A : Differences in ASTM standard body measurements for women’s plus size figure (unit: inch) ... 117
LIST OF TABLES
Table 1. Classification of overweight and obesity based on body mass index (BMI) ... 6
Table 2. Waist circumference and health risk ... 7
Table 3. Correlation coefficients between the visceral adipose tissue accumulation measured by computerized tomography and waist, WHR, BMI, or sagittal diameter ... 15
Table 4. Waist circumference and WHR associated VAT volume ... 16
Table 5. Waist circumference relating health risks ... 17
Table 6. Body shapes of overweight women ... 18
Table 7. 3D to 2D technology for computer-aided technical design (developed by J.H. Park) ... 33
Table 8. Properties of Pellethane® 2355-80AE polyurethane elastomer ... 50
Table 9. Ratio of reduction according to the stretch fabric types ... 58
Table 10. Specifications of NX-16 3D body scanner ... 60
Table 11. Body measurements required for leotard sloper ... 61
Table 12. Specific measurements of dress form for prototype ... 61
Table 13. Body shapes of overweight women ... 73
Table 14. Comparison of body measurement between 20 and 20W (unit: inch) ... 74
Table 15. Differences between sizes in ASTM standard body measurements for women’s plus size figure (unit: inch) ... 75
Table 16. Adjustment of body measurement ... 75
Table 17. Pattern development of rectangular-8 shape ... 77
Table 18. Pattern development of barrel shape ... 78
Table 19. Pattern development of pear shape ... 79
Table 20. Pattern development of box shape ... 80
Table 21. Design suggestions ... 82
LIST OF FIGURES
Figure 1. Considerations for development of BMSA. ... 4
Figure 2. The percentage of the population older than 15 years with a BMI greater than 30 in each country. ... 8
Figure 3. Overweight among persons 20 years of age and over: United States. ... 9
Figure 4. Obesity among persons 20 years of age and over: United States. ... 9
Figure 5. Male obesity ratio by age. ... 10
Figure 6. Female obesity ratio by age. ... 10
Figure 7. Body shapes of women. ... 19
Figure 8. Georgia Tech Wearable Motherboard (GTWM). ... 21
Figure 9. LifeShirt ... 22
Figure 10. OptiTex offers 3D Runway Suite of Tools. ... 31
Figure 11. Computer-aided manufacturing (CAM) process (developed by J. H. Park). ... 31
Figure 12. Dart generation algorithm. ... 38
Figure 13. 3D wireframe and the principles of geometric transformation. ... 39
Figure 14. 3D mesh cutting algorithm. ... 41
Figure 15. Geometric draping modeling process. ... 43
Figure 16. Process of BMSA prototype development (adapted from (McCann, Hurford and Martin). ... 48
Figure 17. Hakke Minilab. ... 51
Figure 18. Twin screws of MiniLab... 52
Figure 19. Heat pressure machine (taken by J. H. Park in the filament lab). ... 53
Figure 20. Prototype of DMSA. ... 56
Figure 21. NX-16 3D body scanner. ... 59
Figure 22. Extraction of body measurements (taken by J. H. Park with NCSU 3D body scanner). ... 60
Figure 23. The way to draft a leotard sloper. ... 65
Figure 24. Gerber AccuMark CAD pattern. ... 66
Figure 25. Gerber AccuMark maker. ... 67
Figure 26. Casing. ... 68
Figure 27. Zigzag stitch. ... 69
Figure 28. Design concept of BMSA. ... 70
Figure 29. BMSA selection options. ... 83
Figure 30. Particles of carbon black (magnification: 25000X, 100000X). ... 84
Figure 31. Fiber type elastic strain gauge. ... 85
Figure 32. Surface of a strain gauge (magnification: 100X, 100000X). ... 85
Figure 34. Concentrated parts and distributed parts of carbon black particles in a fiber section
(magnification: 25000X, 25000X). ... 86
Figure 35. Relationship between strain and electric resistance of sample No.1. ... 87
Figure 36. Relationship between strain and electric resistance of sample No.2. ... 88
Figure 37. Relationship between strain and electric resistance of sample No.3. ... 89
Figure 38. Relationship between strain and electric resistance of sample No.4. ... 90
Figure 39. After 20 washings the relationship between strain and electric resistance of sample No.1. ... 91
Figure 40. After 20 washings the relationship between strain and electric resistance of sample No.2. ... 92
Figure 41. After 20 washings the relationship between strain and electric resistance of sample No.3. ... 93
Figure 42. After 20 washings the relationship between strain and electric resistance of sample No.4. ... 94
Figure 43. Average electric resistance of sample No.1 before and after 20 washings. ... 95
Figure 44. Average electric resistance of sample No.2 before and after 20 washings. ... 95
Figure 45. Average electric resistance of sample No.3 before and after 20 washings. ... 96
Figure 46. Average electric resistance of sample No.4 before and after 20 washings. ... 96
Figure 47. Electric resistance of strain gauge regarding change of waist circumference. ... 97
1 INTRODUCTION
According to the National Center for Health Statistics of the U.S. Department of Health and Human Services, approximately 65% of adults in the United States were found to be overweight in the period of 2003~2006 ("Health, United States, 2008 with Special Feature on the Health of Young Adults"). As the ratio of overweight and obesity continuously rises, obesity-related health problems such as hypertension, metabolic syndrome, type 2 diabetes, coronary heart disease, cancer, osteoarthritis, and sleep apnea also increases ("Do You Know the Health Risks of Being Overweight?"). In addition, overweight and obesity have a significant economic impact. According to one research, estimated medical expenditure attributed to obesity was $147 billion (approximately 10% percent of all medical spending) in 2008 (Finkelstein et al.).
Because of greater awareness of these health risks especially among an aging population, and an increasing interest in health and well-being, smart healthcare clothing has a special opportunity for development and expansion (Cho and Lee). Smart healthcare clothing monitoring vital signs such as blood pressure, heart rate, electrocardiogram (ECG), respiration, and body temperature have been developed by researchers. Research in this field is facing various challenging issues such as “biomedical sensors, scenarios of data security and confidentiality, risk analysis, user interface, medical knowledge/decision support, dissemination, user acceptance and awareness, and business models and exploitation” (Lymberis) (pg.no.3716). Smart healthcare clothing can be both comfortable and efficacious for disease prevention, a lifetime of continuous health monitoring, and home care versus hospital care (Axisa et al.).
According to the analysis of Venture Development Corporation (VDC) for wearable computing and smart fabric and interactive textile which can provide real-time vital and diagnostic information, the demand for these will be likely accelerated (Lymberis and De Rossi). Sensor and wireless communication technology highly developed will likely accelerate the smart healthcare clothing.
Therefore, this research focuses on developing smart apparel for the overweight, called Body-shape Monitoring Smart Apparel (BMSA), using a textile sensor which monitors waist circumference and finding potential possibility through making a BMSA prototype.
The overall research question for this research is: “How the Body-shape Monitoring Smart Apparel (BMSA) can be developed?”
Specific research questions are as follows:
Question 1: What are design constraints for BMSA? Question 2: What users’ expects are?
Question 3: What technical issues should be considered?
Question 4: How can a BMSA prototype be prepared and tested? Therefore, the specific objectives of this research are as follows:
Objective 1: develop a design concept of BMSA with technical considerations and end user considerations.
Objective 2: propose the BMSA selection options considering body shapes of overweight women.
Objective 3: develop a textile sensor, called the elastic strain gauge, in order to measure the waist circumference using carbon black and polyurethane and test the elastic strain gauge.
2 REVIEW OF LITERATURE
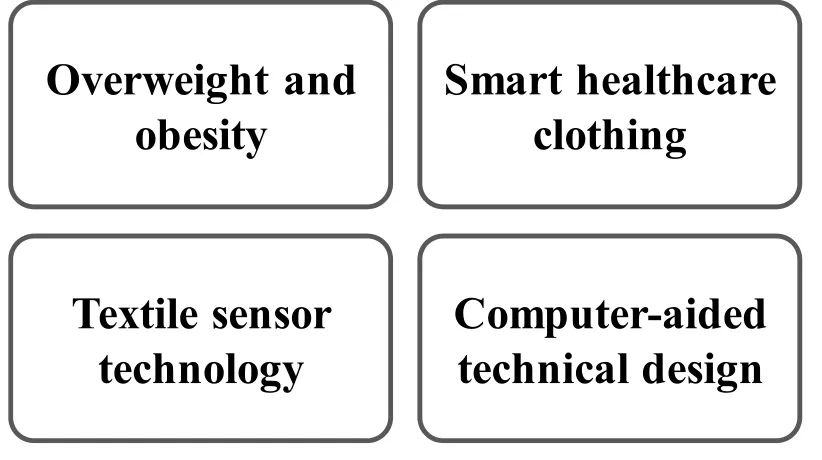
In order to develop Body Monitoring Smart Apparel (BMSA), environmental and technical background considerations are required. Overweight and obesity, the reason for the development of BMSA, was investigated in aspects of definition, prevalence, health consequences, economic costs, waist circumference and health risk and figures of overweight adult women. The current status and potential of smart healthcare clothing was explored. The technology of textile sensor which can be especially used for the strain gauge was investigated in order to obtain knowledge for elastic strain gauge development. Computer-aided technical design technology was searched in order to find the potential of automatic production of BMSA.
Overweight and
obesity
Computer-aided
technical design
Textile sensor
technology
Smart healthcare
clothing
2.1 Overweight and obesity
2.1.1 Definition of overweight and obesity
There are several methods for assessment of overweight and obesity. BMI, waist circumference, waist-to-hip ratio (WHR), weight and weight-for-height and skin-fold thickness are anthropometric methods. Magnetic resonance imaging (MRI), computerized tomography (CT) and bioelectrical impedance analysis (BIA) are direct measures.
2.1.1.1Body mass index (BMI)
Table 1. Classification of overweight and obesity based on body mass index (BMI)
Classification BMI (kg/m2)
Underweight <18.50
Normal 18.50-24.99
Overweight: ≥25.0
Pre-obese 25.00-29.99
Obese class I 30.00-34.99
Obese class II 35.00-39.99
Obese class III ≥40.00
Source: Obesity: Preventing and Managing the Global Epidemic. Report of a Who Consultation. 2000
2.1.1.2Waist circumference (WC)
Table 2. Waist circumference and health risk
Health risk Waist circumference (cm)
Men Women
Increased ≥ 94 ≥ 80
Considerably increased ≥ 102 ≥ 88
Source: Waist Circumference as a Measure for Indicating Need for Weight Management, Lean, M. E. J., T. S. Han, and C. E. Morrison, British Medical Journal 311.6998, 1995,
158-61.
2.1.1.3Skin-fold thickness
Skin-fold thickness can be measured at multiple sites on the body with calipers. Fat mass and percentage fat can be estimated by prediction equations from skin-fold measurements (Power, Lake and Cole). There are significant variations among observers (Kopelman) and variations by age, sex, and race in skin-fold thickness measurements (Power, Lake and Cole).
2.1.2 World obesity
("Oxford International Model United Nations, Oximun 2007 Study Guide, World Health Organization, Topic B: The Question of Obesity and Associated Health Complications").
0 5 10 15 20 25 30 35
USA UK Canada Spain Germany Sweden France Italy Korea
P
ercen
t (
%
)
Figure 2. The percentage of the population older than 15 years with a BMI greater than
30 in each country.
Source: Oxford International Model United Nations, Oximun 2007 Study Guide, World Health Organization, Topic B: The Question of Obesity and Associated Health
Complications. Oxford International Model United Nations, 2007, pg. no. 5. 2.1.3 Prevalence of overweight in the US
Figure 5 and Figure 6 shows that the obesity ratio increases according to age. At 55~64 years the obesity ratio peaks and from 65 it decreases again.
0 10 20 30 40 50 60 70 80
1960-1962 1971-1974 1976-1980 1988-1984 1999-2002 2003-2006
P er cen t (% ) Male Female
Figure 3. Overweight among persons 20 years of age and over: United States.
Source: Health, United States, 2008 with Special Feature on the Health of Young Adults. 2008, pg. no. 320-23.
0 10 20 30 40
1960-1962 1971-1974 1976-1980 1988-1984 1999-2002 2003-2006
Source: Health, United States, 2008 with Special Feature on the Health of Young Adults. 2008, pg. no. 320-23.
0 10 20 30 40 50
1960-1962 1971-1974 1976-1980 1988-1994 1999-2002 2003-2006
P
erce
n
t (
%
) 20-34 years
35-44 years 45-54 years 55-64 years 65-74 years 75 years and over
Figure 5. Male obesity ratio by age.
Source: Health, United States, 2008 with Special Feature on the Health of Young Adults. 2008, pg. no. 320-23.
0 10 20 30 40 50
1960-1962 1971-1974 1976-1980 1988-1994 1999-2002 2003-2006
P
ercen
t (
%
) 20-34 years
35-44 years 45-54 years 55-64 years 65-74 years 75 years and over
Source: Health, United States, 2008 with Special Feature on the Health of Young Adults. 2008, pg. no. 320-23.
2.1.4 Health consequences by overweight and obesity
Being overweight or obese results in serious negative health consequences. The negative influence on health increases progressively as BMI increases. Being considerably overweight can lead to various health problems, including cardiovascular disease (mainly heart disease and stroke), diabetes which has quickly become a worldwide epidemic, musculoskeletal disorders (particularly osteoarthritis), some cancers (endometrial, breast, and colon), high blood pressure, arthritis, indigestion, gallstones, snoring, sleep apnea, stress, anxiety, and depression ("Oxford International Model United Nations, Oximun 2007 Study Guide, World Health Organization, Topic B: The Question of Obesity and Associated Health Complications").
Chronic conditions caused by excess fat such as type 2 diabetes, hypertension, coronary heart disease, are closely related to high BMI. In subjects with a BMI less than 30, risk has an approximately linear correlation. However, the incidence of these disorders greatly increases in those with a BMI about 29, regardless of sex (Willett, Dietz and Colditz).
2.1.5 Economic lost of overweight and obesity in the US
Fiebelkorn and Wang). That figure increased to approximately $118.5 billion by 2006. The researchers hypothesized that obesity-related medical expenditures rose to $147 billion (approximately 10% percent of all medical spending) a year by 2008. (Finkelstein et al.).
According to researchers, the total costs due to obesity were estimated to be $99.2 billion dollars in 1995. Direct costs were approximately $51.6 billion accounting for 7% of total health care spending and indirect costs were $47.6 billion. Direct costs denote preventive, diagnostic, and treatment services such as physician visits, medications, and hospital and nursing home care, and indirect costs denote the value of wages lost by people unable to work because of illness or disability, as well as the value of future earnings lost by premature death (Wolf and Colditz).
Comparing 1998 and 1994 NHIS data, there has been a significant increase in the indirect cost of obesity. Lost productivity in 1994 cost the nation $3.9 billion as evidenced by the following: 39.22 million days of lost work (50% increase), 239 million restricted activity days (36% increase), 89.5 million bed days (28% increase) (Wolf and Colditz).
2.1.6 Waist circumference and health risk
National Institute of Health cutoff points, and the prevalence of the above disorders was compared in people with normal vs. high waist circumference within normal-weight, overweight, and class I obese BMI categories. Both men and women with high waist circumferences had an increased health risk within the same BMI category compared with those with normal waist circumference. Considerable association between the prevalence of health risk and waist circumference was shown in their research. (Janssen, Katzmarzyk and Ross)
According to Zhu et al., waist circumference is useful for indentifying obesity-associated risk factors. Using a sample study of 9,019 white participants (men=4338, women=4631), they investigated the relationship between either waist circumference or BMI and the following obesity-associated risk factors: high LDL cholesterol (LDL cholesterol≥4.14 mmol/L), low HDL cholesterol (HDL cholesterol<0.91 mmol/L for men and <1.17 mmol/L for women), high blood pressure (diastolic blood pressure ≥140mmHg or systolic blood pressure ≥90mmHg), and high glucose (plasma glucose>6.94 mmol/L). Except for HDL, correlations between waist circumference and risk factors were considerably higher than correlations between BMI and risk factors. (Zhu et al.)
In order to evaluate association of the anthropometric measures of obesity and cardiovascular disease risk factors, Reeder et al. conducted correlation analysis between the anthropometric measures - body mass index (BMI), waist circumference (WC), hip circumference (HC), ratio of waist to hip circumference (WHR) - and cardiovascular risk factors - diastolic blood pressure (DBP), systolic blood pressure (SBP), levels of total cholesterol (TC), low density lipoprotein (LDL) cholesterol, high density lipoprotein (HDL) cholesterol and triglycerides (TRIG) and the TC/HDL ratio. Waist circumference was most closely related with cardiovascular risk factors. The stronger association was shown in younger groups than older groups. (Reeder et al.)
Waist circumference is a useful indicator of coronary heart disease. Through analysis of correlation coefficients between height and waist circumference, they found that waist circumference was not significantly influenced by height, especially in people requiring weight management (Han, Lean and Seidell).
coefficients between the visceral adipose tissue and waist circumference, WHR or sagittal diameter were highly significant in both men and women (Lemieux et al.).
Table 3. Correlation coefficients between the visceral adipose tissue accumulation
measured by computerized tomography and waist, WHR, BMI, or sagittal diameter
waist WHR BMI Sagittal
diameter
men 0.82 0.80 0.75 r = 0.84
women 0.73 0.61 0.60 r = 0.77
Source: A Single Threshold Value of Waist Girth Identifies Normal-Weight and Overweight Subjects with Excess Visceral Adipose Tissue. Lemieux, S., et al., Am J Clin
Nutr 64.5, 1996, 685-93.
Waist circumference and WHR values corresponding to two critical values of visceral adipose tissue (100 cm2: Subjects are generally free from metabolic complications below this amount, 130 cm2: Substantial alterations in plasma glucose-insulin homeostasis and plasma lipoprotein-lipid profile are shown above this amount) were computed in men and women in order to determine critical values of waist circumference and WHR. They conducted analysis to verify whether the waist circumference and WHR values are influenced by age, menopausal status and obesity status. It was shown that the relation between waist circumference or WHR and visceral adipose tissue is influenced by age and menopausal status. Waist circumference and WHR values were generally higher in younger groups than older groups (
adipose tissue is influenced by obesity status. The difference between the normal-weight group and the overweight group is evident in the WHR values in the
Table 4. It was shown that waist circumference is an easier and better indicator for accumulation of visceral adipose tissue WHR. According to Lemieux et al. the, waist circumference and the waist-to-hip ratio (WHR) are most commonly used as anthropometric indexes for the prediction of visceral adipose tissue. Critical waist circumference values relating to visceral adipose tissue in different age and sex groups was proposed (Table5) (Lemieux et al.).
Table 4. Waist circumference and WHR associated VAT volume
Waist circumference WHR
VAT area 100 cm2
VAT area 130 cm2
VAT area 100 cm2
VAT area 130 cm2
Men 87.8 cm 95.3 cm 0.89 0.94
Women 84.2 cm 94.0 cm 0.82 0.88
Men <40y (n=140) 90.3 cm 98.9 cm 0.90 0.96
≥40y (n=73) 83.4 cm 90.9 cm 0.88 0.92
Women <40y, (n=124) 89.9 cm 101.2 cm 0.86 0.94
≥40y,
Premenopausal (n=29)
79.9 cm 88.5 cm 0.78 0.84
≥40y,
Postmenopausal (n=37)
75.3 cm 83.9 cm 0.77 0.83
Men <25 kg/m2 (n=77) 87.3 93.9 0.94 1.02
≥27 kg/m2 (n=83) 88.9 96.2 0.89 0.93
Women <27 kg/m2 (n=88) 85.0 94.2 0.94 1.06
≥27 kg/m2 (n=56) 88.0 98.4 0.78 0.96
Source: A Single Threshold Value of Waist Girth Identifies Normal-Weight and Overweight Subjects with Excess Visceral Adipose Tissue. Lemieux, S., et al., Am J Clin
Table 5. Waist circumference relating health risks
Men Women
<40y ≥40y <40y,
Premenopaus al ≥40y, Premenopaus al ≥40y, Postmenopau sal Desirable (<100cm2)
<90cm <80cm <90cm <80cm <75cm
Increased risk
(>130 cm2)
>100cm >90cm >100cm >90cm >85cm
Source: A Single Threshold Value of Waist Girth Identifies Normal-Weight and Overweight Subjects with Excess Visceral Adipose Tissue. Lemieux, S., et al., Am J Clin
Nutr 64.5, 1996, 685-93.
2.1.8 Body shapes of overweight adults women
The body shapes of overweight women are different with body shapes of normal weight women, and knowing body shapes is required for well-fitting garment patterns.
Table 6. Body shapes of overweight women
Rectangular-8
shape Barrel shape Pear shape Box shape
Source : Frances Leto. Fashion Design for the Plus-Size. Zangrillo, New York: Fairchild Publications, 1990.
Figure 7. Body shapes of women.
Source: Female Figure Identification Technique (Ffit) for Apparel Part Ii: Development of Shape Sorting Software. Simmons, Karla, Cynthia Istook, and Priya Devarajan.
Journal of Textile and Apparel, Technology and Management 4.1, 2004, 1-15.
2.2 Smart healthcare clothing
Smart Clothing can be defined as all clothing manufactured with “intelligent” or “smart” materials with the ability to sense stimuli from the surroundings and to respond to the conditions (Baurley). Smart textiles can be classified into three groups: passive smart, active smart and very smart determined by the behavior of the response (Van Langenhove and Hertleer; Zhang and Tao). Passive smart textiles only have the ability to sense stimuli from the surroundings; active smart textiles have the ability to sense and respond; very smart textiles have the ability to sense, respond and adjust themselves to the situations of the surroundings (Ariyatum, Holland and Harrison).
Challenges include “biomedical sensors, scenarios of data security and confidentiality, risk analysis, user interface, medical knowledge/decision support, dissemination, user acceptance and awareness, business models and exploitation” (Lymberis) (pg. no. 3716). As smart healthcare clothing is refined, it may allow users to stave off disease, avoid hospitalization and comfortably monitor their health on a continuing basis (Axisa et al.).
Figure 8. Georgia Tech Wearable Motherboard (GTWM). Source: Geogia Tech Wearable Motherboard (Gtwm). 2009
The department of Textiles at Ghent University developed the smart textile ‘Textrodes’ measuring heart rate and an electrocardiogram (ECG). The Textrodes have direct contact with the skin, so they allow long term monitoring without problems such as skin irritation. The elasticity of the knitted structure of the Textodes provides close contact between the garment and the thorax. Stainless steel fibers were selected as the material of the Textrodes due to good conductivity, soft touch, low toxicity, washability and its ability to be manipulated as a textile material (Van Langenhove and Hertleer).
Figure 9. LifeShirt Source: Pda Cortex. 2009.
Cho & Lee (2007) developed smart healthcare clothing having bio-medical sensors which monitor basic vital signs of cardiac disorder and respiratory disease. The prototype is composed of an outer layer and an inner layer. The outer layer is similar in appearance to common clothing. The inner layer has a temperature sensor, an electrocardiogram (ECG) sensor, an RFID tag with the wearer’s medical history and identification data and a battery. The signals of electrocardiogram, respiration, heartbeat, and temperature can be measured. The wireless transaction part transmits the vital signs to the computer for real time monitoring. This clothing also has an alarm function in emergency situations (Cho and Lee)
2.3 Technology of the textile sensor as a strain gauge
stretching of the strain gauge results in an increase of the length, L, and reduction of the cross-section area, A. The electric resistance increases according to the equation (1).
A L
R (1)
where R is the electric resistance; L is the length of the wire; ρ is the resistivity; A is cross-section area of the wire. (Cochrane et al.) pg. no. 485
Mattmann et al. used 50wt% thermoplastic elastomer (TPE) and 50wt% carbon black particles to make strain sensors using a melt process and extrusion. The strain sensor was placed on the fabric, and then silver coated conductive yarn was attached to both ends using conductive epoxy. The sensor was covered with silicon film, enhancing flexibility and elasticity. They performed measurement on a sensor of 2cm length in order to characterize the sensor’s dynamic behavior. They provided waiting times at the point of extension and retraction in order to observe relaxation behavior. Relaxation of the sensor results an inaccuracy of 8.8%. Electric resistance response for the strain was not observed at a strain below 10% due to textile deformation. Mean hypothesis error in response to a strain was ±2.25%. When the strain was decreased, the response of the sensor was stable. On the other hand, when increasing strain was applied, the response property of the sensor was not consistent. Therefore, pre-stretching is required to keep the constant sensor characteristics. The increase of the strain rate results in a small rise in the electric resistance. The sensors showed the stable properties over time and were not affected by aging or washing. Twenty-one strain sensors were applied to a tight-fitting garment in order to recognize upper body postures, and a recognition rate of 97% was achieved (Mattmann, Clemens and Tröster).
saturated into layers of fiber swollen by solvent and then the solvent is removed. Polycaprolactam (PA6) fibers are used as fiber substrate and formic acid is used as solvent. In a washing test, volume resistivity of CB-coated PA6 fibers by the dissolving-coating method showed no significant change (before washing: 4.94×100 Ω cm, after 50 washings: 8.36×100Ω cm stable), but volume resistivity of CB-coated PA6 fibers by the traditional coating method showed a significant increase (before washing: 1.20×101 Ω cm after 50 washings: 3.58×10⁸Ω cm). For CB-coated PA6 fibers by the dissolving-coating method, electric resistance presented a linear increase in strain below 35% and a nonlinear increase in strain above 35%. For CB-coated PA6 fibers by the traditional coating method, electric resistance presented a gentle increase in strain below 15% and a nonlinear and rapid increase in strain above 15% as a result of a break in the conductive coating. It was observed in SEM photographs that the coating durability of CB-coated PA6 fibers by the dissolving-coating method is better than CB-coated PA6 fibers by the traditional coating method. (Jin et al.)
show different values between stretching and restoration in electric resistance upon strain (Federico Lorussi et al.).
Scilingo et al. presented the properties of Polypyrrole (PPy) coated fabrics for strain-sensing. Electric resistance of the PPy fabric sensor having an initial electric resistance 0.9kΩ/cm was measured for 60 days to verify its sensor aging property. A linear increase tendency in electric resistance was observed over time. In order to know the effect of temperature, electric resistance of the PPy fabric sensor was measured in temperatures of 10~50℃. The value of the temperature coefficient of resistance (TCR) was -0.018 ℃-1.
Temperature did not have a significant effect on the resistance of the PPy strain sensor (Scilingo et al.).
) ( 1 ) / ) ( o to to t T T R R R TCR
(2)
where Rt is the resistance at temperature T; Rt0 is the resistance at reference temperature
T0 . (Scilingo et al.) pg. no. 462.
chemical vapor deposition process at a low temperature(−26℃) have a smooth surface
which, along with density, has been shown to improve stability. Li et al. showed that annealing of the PPy-coated fabrics improves strain sensitivity and stability. They propose that the inclusion of dodecyl benzene sulfonate anions will improve the stability of the PPy-coated strain sensors.(Li et al.)
o
R R y sensitivit Strain
(3)
where ΔR is the resistance change of the fabric under extension; ε is the deformation; R0
is the original resistance. (Li et al.) pg. no. 90.
filtering for a one-time calibration which will correct subsequent censor misplacement (P. Gibbs and H. H. Asada).
For rehabilitation purposes, Gibbs and Asada developed wearable conductive fiber sensors for multi-axis joint angle measurement for continuous monitoring of joint motion. They applied the conductive fiber sensors to skin-tight pants for measuring the joint angles of the lower body. Silver plated nylon 66 yarn having an impedance of approximately 3.6Ω/cm was used as the sensor. They formulated an automated registration algorithm considering a sensitivity shift and arrangement of sensors. They showed that the quadratic predictor is better than the linear predictor through comparing the results of goniometer output, linear model estimation and quadratic model estimation in a single-axis knee joint angle. Sensing output errors caused by repetitive dressing and undressing of the sensing garment were observed. Sensors monitored the movement of a double axis hip joint. There was no significant difference between the quadratic predictor and the linear predictor for the output in the double axis hip joint (P. T. Gibbs and H. H. Asada).
Tognetti et al. used conductive elastomer composites having piezoresistive properties upon deformation for strain sensing. Lycra® fabric with an adhesive mask was coated with conductive elastomer composites material. When the mask is removed, the sensor remains in the shape of the mask. The fabric is then treated in an oven at a temperature of about 130℃ for 10 minutes to speed up the cross-linking procedure. The strain sensor has
rapidly and decreased gently after the peak point. Electric resistance showed a small leap and slow decrease at restoration of the length (Tognetti et al.; F. Lorussi et al.)
Farringdon et al. integrated knitted stretch sensors on a jacket in order to measure upper arm and body movement and posture. The sensor shows increasing electric resistance as it is stretched. Knitted sensors are placed at the elbow, on top of the shoulder, at the armpit, on the upper back etc. A connections terminal on the jacket can be attached to other wearable devices providing data concerning limb movement and body position. (Farringdon et al.)
2.4 Role of computer-aided technical design
2.4.1 Needs of computer-aided technical design
garments especially, pattern fit is a critical factor of evaluation. A two dimensional (2D) pattern generation system reflecting the curved surface information of a body by using individual 3 dimensional (3D) body scan data could be a solution to the problem.
After a technical designer generates garment patterns according to the design, samples are manufactured in order to identify the real shape of the garments in space and the final pattern is obtained by correcting faults. Such processes consume much time and cost. If it were possible to simulate 2D into patterns for a 3D garment, it would be a useful system. Connections between such simulation systems and current pattern computer-aided design (CAD) systems might be useful for technical design. Such systems can also be applied to a customized design system in which customers select design components by means of a database.
Figure 10. OptiTex offers 3D Runway Suite of Tools. Source: Optitex, 2009
3D Body Formation
2D Pattern Design
Is the developed 3D garment simulation the same as the
initial 3D garment simulation?
Production Yes
No Image Analysis
Image Analysis
A 3D virtual individual body model is required in order to create patterns from body scan data. Cho et al. (2005) created a 3D ‘interactive body model’ in which lengths and
perimeters are adjusted according to individual body size (Youngsook Cho et al.). Some researchers utilized only linear data from the 3D scan data to construct patterns(Chan, Fan and Yu; Griffey and Ashdown). Others used a mesh method in which triangular and quadrilateral mesh are used to flatten 3D surfaces onto a plane (Choi et al.; Daanen and Hong; Jeong, Hong and Kim; Kang and Kim; Kim and Park; Kim and Kang). S. M. Kim & Kang (2002) developed a ‘body model’ and a ‘garment model’, modifying the garment model on the body model by means of convex hull generation and multi-resolution. They proposed a projection algorithm based on the ‘strain minimization technique’ (Kim and Kang). Jeong et al (2006) utilized Garland’s method of triangle simplification for pattern
design of tight-fitting garments of stretch fabric (Jeong, Hong and Kim). Kim & Park (2007) introduced ‘the fit zone’ and ‘the fashion zone’ and showed various style variations using ‘the fashion zone’ which is modified by shape parameters and is combined with the fit zone (Kim and Park). Yunchu & Weiyuan (2007) showed geometrical transformation of 3D surface into 2D pattern through constructing a 3D wireframe (Yunchu and Weiyuan). Sul & Kang (2006) developed a ‘virtual scissoring method’ by NURBS cutting curve and a mesh cutting algorithm imitating draping techniques (Sul and Kang). Cho et al. also brought draping techniques into their method in which shearing behavior of woven fabric was considered (Youngsook Cho et al.).
are used for body formation. The uniform mesh type such as quadrilateral mesh and triangular mesh and triangulation will be explained. In the image analysis sections, various flattening systems and virtual draping systems will be mainly dealt with. Accuracy is described in the evaluation section.
Table 7. 3D to 2D technology for computer-aided technical design (developed by J.H.
Park)
Meshing Uniform Mesh Triangulation
Accuracy of Fit Draping System Virtual Scissoring Method Geometric Draping Modeling Flattening System Dart Generation Algorithm Wireframe Transform
Virtual Body Surface Generation 3D Body Scan Data
B-Spline Curve Convex Hull 3DBody
Formation
Image Analysis
Evaluation
2.4.2 Body generation
input into the body model, the body model is modified according to the individual body size. However, this method cannot represent each body curve shape because only perimeters and lengths are controlled, but body shape may follow the standard body shape (Youngsook Cho et al.).
Kang & Kim (2000); Kim & Kang (2002) adopted the way to create ‘body model’ and ‘garment model’. After appropriate sorting of points obtained from 3D body scanner for data reduction or obtaining data from a sliding gauge, they developed the body model composed of cross-sectional points in the cylindrical coordinate system. Landmarks such as neck points, shoulder points, and armhole points of the body model which are located at the maximum, minimum, or extreme points and maximum curvature are determined using the Fourier series expansion. Because garments usually do not follow complex body surfaces directly or cover the body smoothly, they generated the garment model into convex shape using a general dress form by stereoscopy. The body model and the garment model are matched and the garment model shape is transformed into a convex shape covering the body model (Kang and Kim; Kim and Kang) .
zones’ also can be deformed using ‘shape parameters’ such as lengths, widths, and the number of folds. ‘Fit zone’ and ‘fashion zone’ are joined in order to compose the entire shape of the garment (Kim and Park).
2.4.3 Mesh generation
To transform three dimensional surfaces into two dimensional flat patterns, a mesh generation method is generally adopted. The surface is divided as small pieces in space and the pieces are recombined on a plane. Two primary mesh generation methods have been used. In the pre-partition method, the surface is first separated into several zones by specified lines (center line, bust circumference line, princess line, and shoulder line etc) and then each section is divided into tiny pieces (Choi et al.; Kang and Kim). In the other method, the surface is entirely divided into small pieces (Kim and Kang). Of these two methods, the former does not create darts, and the latter generally does create darts during the flattening process. In the pre-partition case, dividing lines can be used as dart lines (Kang and Kim) or design lines such as a princess line and a yoke line.
Triangulation is a method used to create meshes with points from 3D scan data and to consider curvature. That is, large meshes are generated in low curvature surfaces and comparatively small meshes are generated in high curved surfaces (Daanen and Hong). The more triangles there are, the more detailed expression there is. However, since it takes a long time to deal with data in the case of many triangles, it is important to decide the optimum size of triangles to hold shape well and to have minimum of data. The Garland simplification method makes it possible to reduce the number of triangles without strong deformation (Jeong, Hong and Kim).
2.4.4 Flattening system
Each mesh element undergoes deformation during the flattening process from three dimensional surfaces into a two dimensional plane. Because the degree of deformation is related to accuracy, the key point is how to minimize deformation in the flattening process. Kang & Kim (2000) presented a pattern projection method considering the elastic and shear properties of the fabric. To minimize deformation of mesh structure obtained by projecting, the lengths of the quadrilateral mesh elements are adjusted. If the differences in the lengths and angles of quadrilateral elements between 3D and 2D as calculated in Equations (4) and (5) reach the specified elastic allowance and the shear allowance, the adjusting process of lengths is stopped (Kang and Kim).
4 1 2 3 2 1 % 100 j D ij D ij D ij N i Modulus L L LA (4)
where N is the number of elements; Lij is the length of jth side on ith element; Yij is the
size of jth angle on ith element. (Kang and Kim) pg. no. 251
Figure 12. Dart generation algorithm.
Source : Garment Pattern Generation from Body Scan Data. Kim, Sung Min, and Tae Jin Kang. Computer-Aided Design 35, 2002, pg. no. 616
In the case of triangulation, there are flat triangles which are different from curved triangles requiring the flattening process in the uniform mesh structure. Therefore, triangles are separately reflected on the plane with their original shape and connecting lines between triangles and then triangles are combined by application software. A gap and an overlap exist between triangles in a merged pattern owing to the three-dimensional shape (Jeong, Hong and Kim).
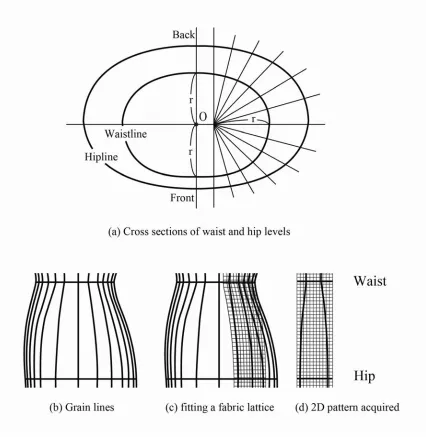
wireframe which is composed of such structural lines is transformed into a 2D pattern by geometric means. Controlling direction and position of specific outer lines such as the center front line, center back line, and bust circumference line, each quadrilateral element is flattened in regular sequence. In the case of a quadrilateral, if the positions of two neighboring lines are determined, the intersection of arcs drawn by the two remaining lines becomes the final point of quadrilateral (Figure 13). Using the above rule, the final 2D flat pattern having similar structure to a conventional pattern prototype is obtained. This method has the possibility of application to various styles of garments due to such pattern construction (Yunchu and Weiyuan).
Figure 13. 3D wireframe and the principles of geometric transformation.
Source: Prototype Garment Pattern Flattening Based on Individual 3d Virtual Dummy. Yunchu, Yang, and Zhang Weiyuan, International Journal of Clothing Science and
2.4.5 Virtual draping system
Source: Interactive Garment Pattern Design Using Virtual Scissoring Method. Sul, In Hwan, and Tae Jin Kang. International Journal of Clothing Science and Technology 18.1,
2006, 31-42. pg.no. 36
Figure 15. Geometric draping modeling process.
2.4.6 Accuracy of fit
To verify a pattern generation method reflecting 3 dimensional data, researchers use various ways that comparing lengths and areas, analysis of the space between clothing and body, analysis of virtual fit and self sensory-test. Jeong et al. compared areas of 2D pattern pieces developed from 3D data with original areas of 3D manikin and also showed differences in lengths of significant parts of a garment between the 2D pattern and 3D manikin (Jeong, Hong and Kim). Choi et al. analyzed the space between clothing manufactured by 3 dimensional data and body form. The pictures from the 3D scanner indicated the amount of space between clothing and body form by variation of color, and the silhouette of vertical sections also indicated the fit of clothing (Choi et al.). Daanen & Hong (2008) virtually sewed their made-to-measure patterns and showed virtual try-on images that illustrate strain, ease amount, and relative pressure in order to evaluate fit (Daanen and Hong). Jeong et al. conducted self sensory-test indicating satisfaction of fit by numerical value about their tight-fitting garments by a participant after wearing for five days. However, it is difficult to present objective results in the case of too few participants (Jeong, Hong and Kim).
2.5 Summary of literature review
useful health indicator for obesity. Therefore, self-monitoring on waist circumference using BMSA may lead people to manage weight successfully.
The current status and potential of smart healthcare clothing were reviewed in previous sections. Smart healthcare clothing monitoring vital signs have been developed by researchers, and it mainly consists of three parts: sensor, transaction, and display. The demands of smart healthcare clothing are continuously increasing, but it is hard to find studies on obesity related to smart healthcare clothing or waist circumference monitoring. Therefore, the investigation which is related on smart healthcare clothing provides valuable data for developing prototype of BMSA.
The textile sensors technology applied to strain gauges was reviewed to obtain technical background knowledge for developing the elastic strain gauge of BMSA. Traditionally carbon black based strain sensors, PPy-based strain sensors, and silver plated nylon sensors have been used for development of an elastic strain gauge. Sensors were applied to a garment to recognize and monitor body posture and joint movement. In this research the carbon black-based strain sensor and melt process have been adopted to develop an elastic strain gauge.
3 METHODOLOGY
3.1 Design of research
Fabric selection
Body measurement Elastic strain gauge
development
Pattern design
Manufacture (Cutting & Sewing)
Integration of strain gauge Design concept
Test of prototype Material
(Carbon black & Polyurethane)
Molding
( Fiber type & Film type)
Electric resistance measurement
Washing test
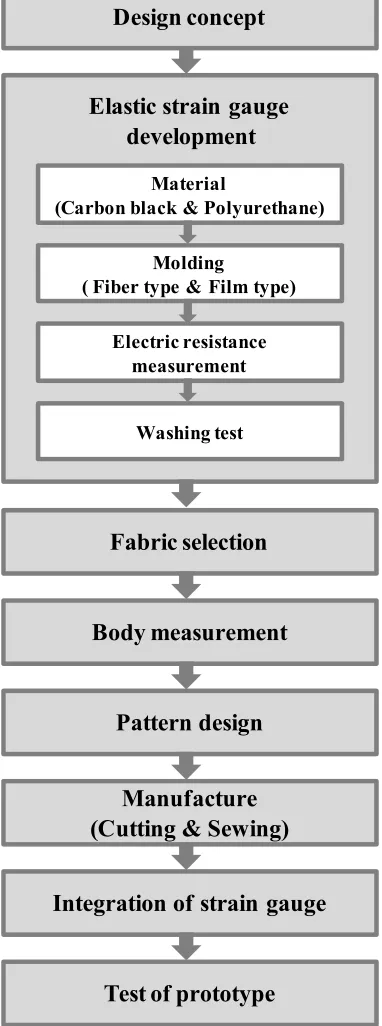
Figure 16. Process of BMSA prototype development (adapted from (McCann, Hurford
The design concept of BMSA includes the garment design and the positioning of technical devices on the garment. A textile sensor, which is called ‘elastic strain gauge’ in this research, was developed using carbon black and polyurethane, and its performance was tested by measuring the electric resistance. Cotton/spandex jersey knit fabric was selected for the BMSA prototype. Body measurements of the dress form were extracted using a 3D body scanner, and patterns were generated using CAD. Fabric was automatically cut using CAM and garment was constructed by sewing. After strain gauge was integrated in the prototype, BMSA prototype was tested on the dress form.
3.2 Design concept of BMSA
A design concept of smart apparel for the overweight was proposed with consideration of components such as technical devices and garment design. In this case, BMSA is defined as clothing monitoring the change of body circumference. It consists of a textile sensor to measure body circumference, a wireless transmission device for convenient data transfer, a display to provide information, and batteries supplying power and secondary functional devices such as an accelerometer, Radio Frequency Identification (RFID) and Global Positioning System (GPS). Elastic strain gauges were made as the textile sensor was horizontally placed on the important body parts.
3.3 BMSA selections
efficiency compared to cost. Therefore, a way to select body types in the shape categories of torso, arms and legs was proposed as a workable solution. The users can be fitted using not only their size, but also their body type and garment preference. The way to create patterns for each different torso type was described.
3.4 Development of textile sensor
Two types of elastic strain gauges were developed for use as textile sensors. Carbon black was used for conductivity and polyurethane was used for elasticity which allows for body circumference changes. An elastic strain gauge of fiber type was produced using Hakke MiniLab having the twin screw, and an elastic strain gauge of film type was produced using a heat pressure machine.
3.4.1 Materials
3.4.1.1Carbon black
Carbon black, furnace black, with the density 1.7-1.9g/cm3 was supplied by Cabot Corporation.
3.4.1.2Polyurethane
Pellethane® 2355-80AE polyurethane elastomer provided by Dow Chemical is polyester polyadipate based thermoplastic polyurethane elastomer. It offers 'memory' and elasticity and blends easily with other thermoplastic resins. Table 8 shows its properties.
Table 8. Properties of Pellethane® 2355-80AE polyurethane elastomer
Property
Melt temperature 193-204℃ (379-399°F)
Melt Flow 7.00 g/ 10min
Elongation at break 550%
3.4.2 Molding elastic strain gauge
3.4.2.1Compounding and Extrusion using Hakke MiniLab
Carbon black powders and polyurethane pellets were mixed using the Hakke MiniLab ("Thermo Scientific "). 90wt% polyurethane (6.25g) and 10wt% carbon black (0.75g) were loaded on the Hakke MiniLab having 7cc capacity of volume. (See Figure 17 and Figure 18) twin screws were rotated for 10 minutes with a rotating speed of 100 rpm at a temperature of 200℃ for good dispersion of carbon black powders in
polyurethane elastomer. Polymer composite was extruded through a 2mm cylindrical die in order to acquire carbon black polyurethane composite fiber.
Figure 17. Hakke Minilab.
Figure 18. Twin screws of MiniLab. Source: Thermo Scientific. 2009
3.4.2.2Heat Pressing
Carbon black powders and polyurethane pellets cut into tiny pieces were pre-mixed by hand. 50wt%, 40wt%, 30wt%, 20wt% and 10wt% carbon black concentrations were tried, but films were easily broken at more than 20wt% and showed low conductivity at 10wt%. Thus, carbon black concentration used was 15wt%. The mixture was pressed between Teflon® sheets of 0.05 inch thickness under 1500 lbs of pressure at a temperature of 200℃ for 15 minutes in order to acquire a film consisting of carbon black
Figure 19. Heat pressure machine (taken by J. H. Park in the filament lab).
3.4.3 Test of elastic strain gauge
Film strain gauges were used for measurement of electric resistance, because a fiber strain gauge showed too weak signals.
3.4.3.1Scanning Electron Microscopy (SEM)
3.4.3.2Electric resistance
The electric resistance of strain gauge of 4 samples which have a length of 2cm, width of 0.25cm, and thickness of 0.04cm was measured. All measurements were performed with an EXTECH multimeter 420. Strain gauges were stretched to a strain of 2.5%, 5%, 7.5%, 10%, 12.5%, and 15%. Repetitive stretching and restoration of the strain gauge was conducted respectively for each strain. The electric resistance was measured using a multimeter for each strain. Measurements were repeated 5 times at each level of strain and at each subsequent relaxation. The waiting times at each strain measurement were about 15 seconds.
3.4.3.3Washing test
Washing tests were conducted following AATCC test method 61-2006 test no.2A, using an AATCC Standard Instrument Atlas Launder-Ometer LEF®. One cycle in the Atlas Launder-Ometer LEF® is equivalent to home machine washing of five times, and it takes 45 minutes for each cycle. Twenty washings were conducted for the samples used in electric resistance measurements. The 1993 AATCC standard reference detergent WOB (without optical brightener) was used, and detergent was 0.15% in total liquor volume of 150 ml. Washing temperature was 49℃, and 50 steel balls were used for each
sample container. (AATCC Test Method 61-2003, AATCC technical manual, 2005)
3.5 Manufacturing and testing of BMSA prototype
garment has the strain gauge in the waist, and it was connected to a multimeter. The prototype garment was fitted on a dress form, and an air package was used for simulation of change of body circumference in a dress form test. Body scanning was used for customized patterns. Patterns were designed in Gerber Accumark® Pattern Design System (PDS) with consideration of stretch ratio of chosen knit fabric, and fabric was automatically cut using Gerber Cutting Edge Cutter. After dressing the prototype on the dress form, the electric resistance of the elastic strain gauge was measured.
3.5.1 Construction of BMSA prototype
pump which allows inject air. A prototype was made to be fitted to the dress form of size 10 (Figure 20).
Figure 20. Prototype of DMSA.
3.5.2 Fabric selection
the fabrics constructed by other stitches, and Jersey knit fabric stretched more in the width than in the length. On the other hand, double-knit fabrics are generally firm, stable, wrinkle-resistant and durable and have similar drape to woven fabrics. Warp knit knits also have good stability. Warp knit fabrics do not ravel and more abrasion – resistance, as compared with weft knits (Corbman and Potter).
3.5.2.1Direction of stretch of the fabric
One-way stretch knit fabric stretches only in on direction - across the material. Two-way stretch knit fabric stretches across the width as well as the length of the material. Four-way stretch knit fabric stretches across the fabric as well as lengthwise, and spandex/Lycra® added to the fibers before knitting supplies supplementary stretch. It returns to its original measurements after release (Richardson).
3.5.3 Ratio of reduction according to the stretch fabric types
Table 9. Ratio of reduction according to the stretch fabric types Stable knits Moderate
knits Stretchy knits Super-stretch knits Two-way & four-way stretch knits Stretch range 18-25% 26-50% 51-75% 76-100% 100% in
both directions Amount of
expansion
5” stretches to 6 ¼”
5” stretches to 7 ¼”
5” stretches to 8 ¾”
5” stretches to 10”
5” stretches to 10” in both directions Reduction ratio for sloper drafting 0% smaller for across measureme nts 2% smaller for across measuremen ts 3.5% smaller for across measuremen ts 5% smaller for across measuremen ts 10% smaller for both directions Percentage of original measurement : Skirts, pants, top, dress, and oversized top
100% 98% 96.5% 95% 95% (Same as super-stretch) Percentage of original measurement : Catsuits, leotard, and bikini
N/A N/A N/A N/A 90% for
both directions
Source: Designing and Patternmaking for Stretch Fabrics. Richardson, Keith. New York: Fairchild Books, 2008. pg. no. 4 and pg. no. 75
because it stretches only 80~85%, a 5% reduction in measurements was applied for both directions in order to create the leotard sloper.
3.5.4 Body scanning of dress form
A body scanner was used in order to acquire accurate measurements of the dress form and to make the garment fit well. One dress form was scanned by a NX-16 three dimensional body scanner of Textile Clothing Technology Corporation ([TC]2) in Figure
21. The key measurements were extracted and used for pattern design. Three-dimensional (3D) body scanners captured the outside surface without contact. Body scanning systems employ one or more light sources, one or more vision or capturing devices, software, computer systems and monitoring screens. Light-based and laser-based systems are major types of body scanning systems. A body scanner from [TC]2 is a light-based system.
("[Tc]2; Simmons and Istook; Istook and Hwang)
Figure 21. NX-16 3D body scanner.
Table 10. Specifications of NX-16 3D body scanner
Scan time 8 sec
Scan volume 1.20.6×2.1 (W×D×H in meters)
Operation system Windows XP, Vista
Data density 600,000-1 million points
Sensor 16 independent sensors, 4 angles at 4 heights Data file format BIN, RBD, OBJ, and VRML
Source: 3d Body Scanning Systems with Application to the Apparel Industry. Istook, Cynthia L., and Su-Jeong Hwang. Journal of Fashion Marketing and Management 5.2
(2001): 120-32.
Figure 22. Extraction of body measurements (taken by J. H. Park with NCSU 3D body
scanner). 3.5.5 List of measurements
Table 11. Body measurements required for leotard sloper
Bust circumference measure all the way around the fullest part of the chest
Waist circumference measure around the smallest part of the waist
Hip circumference measure around the widest part of the hip
Nape to waist measure straight down from the nape, the point where the neck
intersects with the center back
Neck circumference measure around base of neck
Shoulder length measure from the intersection point of the neck and shoulders to
the intersection point of the shoulder and arms
Across back measure between the two bones at the top of the armhole
Crotch length measure form the crotch up to the waist level using an “L”
square
Source: Designing and Patternmaking for Stretch Fabrics. Richardson, Keith. New York: Fairchild Books, 2008.
Specific body measurements for pattern drafting were calculated and measurements were reduced to 95%, as shown in Table 12. However, reduction is not applied to shoulder pitch, neck, back neck, back neck rise, shoulder length, and across back (Richardson).
Table 12. Specific measurements of dress form for prototype
Original
measurement 95% of original measurement
(1) ¼ Bust circumference 9.848 9.355
(2) ¼ waist circumference 6.905 6.559
(3) ¼ Hip circumference 9.640 9.158
(4) Nape to waist 17.120 16.264
(5) Shoulder pitch=1/11× Nape to waist 1.556 No reduction
(6) Neck 15.310 No reduction
(7) Back neck=1/6×Neck 2.552 No reduction
(8) Back neck rise=1/18×Neck 0.851 No reduction
(9) Shoulder length 5.110 No reduction
(10) ½ Across back 7.340 No reduction
3.5.6 Pattern Design using CAD
The pattern of smart apparel was developed using Gerber Technology’s Accumark® Pattern Design System (PDS). Gerber Technology‘s PDS allows the user to create new patterns or transform existing ones to satisfy new designs. Functions such as darts, fullness, and pleats can be conducted in PDS. Seam allowances can be easily added to multiple patterns at once, and grading can be applied to patterns (Sharp and Elsasser). The system can remember the position of patterns on the workspace so that they are placed in the original position when recalled (Istook). The system allows the user to make facing and interfacing in a short time. Copying, tracing, shrinking and enlargement of the patterns can be conducted quickly. Notches, drill holes, and annotations can be simply added to the pattern pieces. Using PDS reduces the time required for pattern developments. Convenience of storage and modification and accuracy are other advantages of a Pattern Design system, computer-aided design (CAD) system. (Espinoza-Alvarado)
3.5.6.1Drafting a leotard sloper
Figure 23 describes the process to develop leotard patterns (Armstrong; Richardson). The technical design method has been modified for this research. Raw data has been obtained from a 3D body scanner and the patterns have been developed using Gerber Accumark® PDS.
Back
Draw a line AB, AB=(4)
Divide a line AB in half to get a point C
Draw horizontal lines at points A,B, and C
Mark a point D, AD=(7)
Draw a line DE, DE=(8). Draw a back neck line A~E as illustrated.
Mark a point F, AF=(5). Draw a horizontal lines at a point F.
Draw a line EG, EG=(9). A point G is same level with a point F.
Mark a point H, CH=(10). Draw a vertical line HI at a point H.
Mark a point J, CJ=(1). Draw a armhole line G~J as illustrated.
Mark a point K, BK=(2). Draw a side seam JK.
Draw a line BL, BL=(11)
Draw a line LM, LM=(3). Draw a vertical line MN at a point M.
Divide a line MN into 3 equal parts and mark a point O. Draw a horizontal line at a point O.
Divide line MN in half and mark a point P 1”above the point separating line MN. Draw a horizontal line PQ at a point P.
Mark a point R at intersection of a hip line KO and a line PQ.
Mark a point S, LS=1 ½”. Draw a vertical line at point S.
Draw line RS, mark point T, draw R~T~S.
Draw center back line as illustrated considering the back body shape. Front
Copy of a back pattern
Mark U, AU=1 ½”. Draw neck line E~U as illustrated.
Move guideline IH for armhole line as much as ¼” in center front direction.
Draw armhole line as illustrated.
Adjust a side seam line JK into a curve line as illustrated considering body shape.
Divide a line RQ in half and mark a point V.
3.5.7 CAM
3.5.8 Fixing strain gauge on the fabric
3.5.8.1Casing
For prototype of this research, one strain gauge was fixed on the garment on the inside using fabric tape which covered the elastic strain gauge and protected it. The tape covering the gauge was fixed to the material using running stitches on both sides. Strain gauge was connected with non-stretchy tape in order to prevent the garment fabric between the both ends of the strain gauge to stretch (Figure 26).
Figure 26. Casing.
3.5.8.2Zigzag stitch
Figure 27. Zigzag stitch. 3.5.9 Dress form simulation