T-STRESS SOLUTIONS FOR CRACKS IN STRAIGHT PIPES
R A Ainsworth1, M Gintalas1, K Abburi Venkata2
1The University of Manchester, Pariser Building, Sackville Street, Manchester M13 9PL, UK.
2
The University of Bristol, Queen's Building, University Walk, Bristol, BS8 1TR, UK
ABSTRACT
The increasing use of constraint arguments for defect assessments of large-scale components such as pipes requires estimates of suitable parameters to characterise crack tip constraint. The simplest such parameter is the elastic T-stress. However, for pipes, such solutions are not readily available. Therefore, this paper reports the results of an extensive series of finite element calculations to provide normalised T-stress solutions for pipes for a range of geometry and crack sizes. Comparisons with the limited solutions in the literature are used to give confidence in the numerical solutions obtained, which are shown to be sensitive to mesh refinement. The results are provided in a form that is suitable for use in practical defect assessments such as the constraint modified failure assessment diagram approach.
INTRODUCTION
Conventional single parameter fracture mechanics is complemented by a second parameter for more detailed assessment of cracked components. The stress intensity factor, KI, may be paired with the elastic T-stress, for example. Two parameter approaches help to apply material fracture toughness from small-scale laboratory specimens to fracture in large-small-scale components. The KI and T parameters are invoked when some constraint based failure assessment procedures are applied to cracked structural analysis. For example, a constraint-based fracture mechanics methodology based on a two-parameter KI–T characterization of the crack tip fields could be successfully employed for constraint assessments in specimens and pipes (Dadfarnia et al (2011)).
T-stress solutions for two-dimensional geometries, including fracture mechanics specimens, are available in the literature or from compendia in failure assessment codes such as R6 (2015). However, T-stress solutions for 3D cracked bodies are still limited. The works by Huh (2006), Jayadevan et al (2005), Qian (2010) and Lewis and Wang (2008) address T-stress analysis in pipes with circumferential cracks. Only the work of Lewis and Wang (2008) deals with circumferential through-wall cracks in pipes.
This paper presents finite element studies for T-stress and stress intensity factor for circumferentially through-wall cracked pipes using three-dimensional elements. Results are compared with the solutions of Lewis and Wang (2008), which are based on analyses using shell elements.
T-STRESS
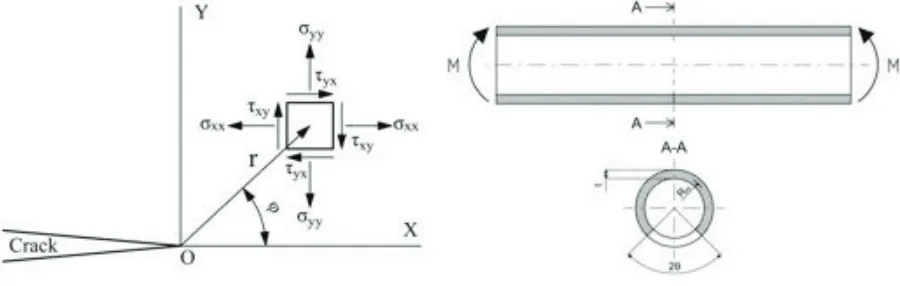
The elastic T-stress is directly proportional to the load applied to a cracked geometry and is the constant stress acting parallel to the crack flank in the near-tip elastic stress field:
(1)
where are the normal and shear stress components, is the opening mode stress intensity
factor, r is distance from the crack tip and is the polar angle (see Fig. 1). Then,
(2)
When specimens with negative values of the T-stress are tested, there is an increase in the measured fracture toughness which is attributed to loss of constraint. The T-stress directly affects the hydrostatic stress. Negative values lower whereas positive values raise the hydrostatic stress. The T-stress may also influence the crack growth path. In general if T < 0, the crack propagation path follows a straight line and for T > 0 it follows a curve (Gupta, et al (2014), Sherry et al (1995) and Meliani et al (2010))
Figure 1. Stress state at the crack tip Figure 2. Pipe under pure bending moment M
The ratio of T-stress to the yield stress of the material is more important than the absolute value ofT
itself. Thus, in practical applications T is normalized by the yield stress of the material. The ratio is
also directly proportional to the plastic collapse parameter employed in the defect assessment procedureR6 (2015) and this is used to define a normalised constraint parameter βT:
(3)
(4)
where Rm is the mean radius, t is the thickness and is the angle subtended by the crack (Figure 2).
ELASTIC FINITE ELEMENT MODEL OF CRACKED PIPE
The finite element (FE) study was preformed to obtain T-stress and stress intensity factor values for the pipes being assessed using fitness-for-service approaches. These cases are addressed by sharp crack modelling in three-dimensional solids. The analyses are described below.
As the stress and strain gradients become large as a crack tip is approached, mesh refinement around the crack tip is required to capture stresses and strains accurately. For sharp crack modelling in a small-strain analysis the singularity at the crack tip should be considered. J-integral, stress intensity factors, and the stress and strain calculations are more accurate if the type of singularity is defined in the mesh at the region close to the crack tip. If r is the distance from the crack tip, the strain, ε, singularity in a small-strain elastic analysis is:
(5)
This type of singularity is achieved by placing the first node away from the crack tip point at one-quarter of the distance to the second point. The crack tip was enclosed by the first contour of full integration wedge type C3D15 (9 integration points) elements. Midside nodes of the first contour elements were moved to the 0.25 points. The second contour and the remaining model were composed from full integration C3D20 (27 integration points) elements.
The accuracy of the results also depends on the angular resolution of the mesh around the crack tip. Stable and path independent results for the J-integral are obtained for LEFM if the crack tip is enclosed by elements, with two edges originating from the crack tip forming a minimum angle in the range from 10°
to 22.5° (Figure 3). All models in this study had 16 elements around half of the crack tip. This results in an angle of 11.25° of single wedge element at the crack tip. A view of the mesh at the crack area is presented in Figure 3.
(a) (b)
(c)
Figure 3. Mesh at the crack tip: (a) Recommended mesh type around crack tip for sharp crack analysis (b) Actual mesh: A view of 1st and 2nd contour around the crack tip (c) A view of the mesh at the crack tip
area
20th. However, path independence of the extracted values of T does not prove mesh convergence and therefore an independent mesh convergence study was performed.
The FE models were meshed with 11 elements through the thickness. Through the thickness, this gives 12 layers of nodes located on an element edge plane and 11 layers of nodes located on element mid-planes. In total, therefore, there are 23 layers of nodes through the thickness. Here, number 1, and hence R1, indicates the external surface and number 23 the inner surface, etc. Since T-stress estimation is inaccurate in regions close to where a crack intersects a free surface (Sherry et al (1995)), results from node layers numbered from 1 to 4 and from 20 to 23 were excluded from analysis. Thus results on node layers from 5 to 19 were considered and in ABAQUS, used in this study, the T-stress is extracted using an interaction integral technique.
In order to induce pure in-plane bending, rotation was applied to the end of a pipe using the MPC (multi-point constraint) constraint type option within ABAQUS. The end surface of the pipe was constrained by one master node located in the middle of the cross section. Then bending was applied to the master node. This constraint type allows rotation to be transferred from the master node via constrained slave surfaces to the pipe. The MPC option ensures that the rotated end surface remains straight during bending.
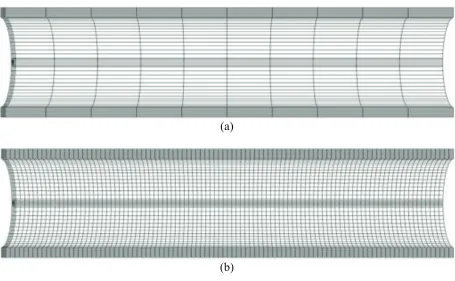
The mesh convergence study was performed for radius to thickness ratios Rm/t=5, 10 and 20, by varying the element length along the pipe length, L (Figure 4). The length, L, was chosen as 100mm and the mean radius as Rm=11mm for all analysed cases. The ratio, Rm /t, was varied by changing thickness, t. Around the semi-circumference of the cylinder, the mesh contained 34 elements resulting in an element size of edge = 1 mm. This number of 34 elements around the semi-circumference was kept constant for all cases. Five steps of mesh refinement were performed for each value of Rm/t as presented in Table 1.
(a)
(b)
Table 1: Dimensions of pipes being simulated and the number of elements N ( ) for each case
Element length in L direction Rm [mm]
Rm/t
t [mm]
L [mm]
10 [mm] 5 [mm] 2.5 1.25[mm] 1 [mm]
11 5
2.2 11 10
1.1 11 20
0.55
100 10 14 23 38 48
FINITE ELEMENT STUDY RESULTS
Stress intensity factor
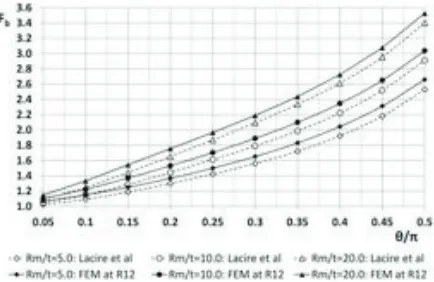
Results for the stress intensity factor from the mesh convergence study are shown in Figures 5-8. The figures contain values of the normalized stress intensity factor, Fb, at the mean radius, R12, obtained from the FE study and a reference solution for Rm/t=5, 10 and 20.
Figure 5. Normalized stress intensity factor Fb for Rm/t=5
Figure 6. Normalized stress intensity factor Fb for Rm/t=10
Figure. 7 Normalized stress intensity factor Fb for Rm/t=20
The normalized stress intensity factor, Fb, of Lacire et al (1999) for circumferential through-wall cracked pipes was used as the reference solution:
(6)
The results indicate that higher values of Rm/t result in higher values of Fb, while an increase in crack angle θ results in higher values of Fb for all Rm/t. The stress intensity factor is not generally influenced by mesh density in this study, with results from the coarsest and finest meshes practically coincident with each other and with the reference solution.
T-stress
Results for the normalized stress from the mesh convergence study are shown in Figures 9 – 12. The T-stress from the current FE study of circumferential through-wall cracked pipes was compared with the solutions of Lewis and Wang (2008). There normalised T-stress solutions are given in the form:
(7)
where the solutions are normalised by the bending stress . The coefficients
in eqn (7) are functions of the radius to thickness ratio :
(8)
where the coefficients are given in Table 2.
Table 2: Coefficients in eqn (8) from Lewis and Wang (2008)
Constraint Coefficient i
1 -0.934 -0.01 0.0005
2 4.3575 1.2671 -0.0451
3 74.273 -35.312 0.9889
4 -680.39 266.98 -6.3389
5 2688.6 -957.82 20.135
6 -3852.8 1325 -25.744
Figure 9. at mean radius for Rm/t=5 Figure 10. at mean radius for Rm/t=10
Figure 11. at mean radius for Rm/t=20 Figure 12. at mean radius for 1 mm
element size
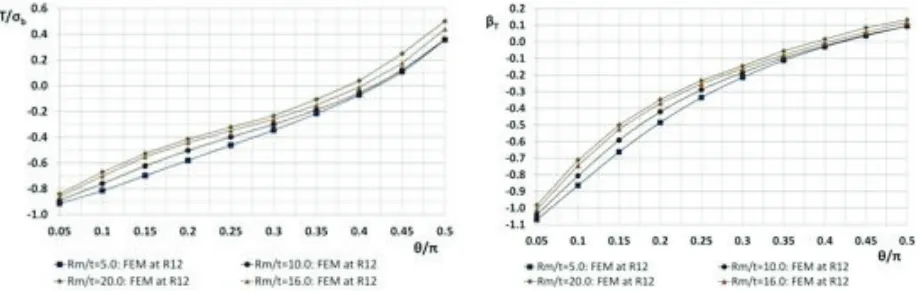
Figure 13. for Rm/t=5, 10, 20 and 16 Figure 14. Constraint parameter for Rm/t=5,
10, 20 and 16
Unlike the stress intensity factor, the T-stress estimate is sensitive to mesh density and this is discussed further below.
transformed into the normalised T-stress using eqns (3) and (4) and are presented in Figure 14. A closed form solution was developed by applying curve fitting for each value of Rm/t leading to:
(9)
where the coefficients from to are given in Table 3.
Table: 3 Coefficients defining normalised constraint in equation (9)
Rm/t
5 296.15 - 558.19 426.24 - 163.76 27.617 2.1243 - 1.2269
10 477.76 - 917.07 686.29 - 244.65 35.891 2.4595 - 1.2267
16 940.06 - 1647.2 1107.5 - 345.34 41.751 3.3122 - 1.2423
20 576.85 - 1032.4 690.28 - 201.63 15.951 5.4587 - 1.2749
DISCUSSION
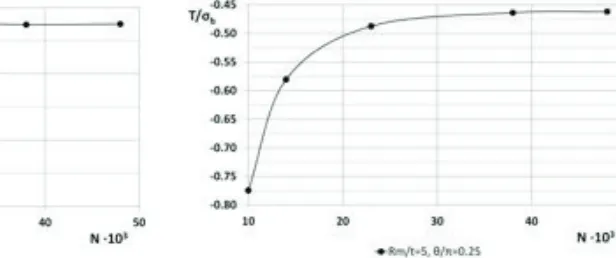
A key finding from this study is that the mesh refinement required to obtain converged T-stress solutions is much greater than that required to obtain converged stress intensity factor results. This is illustrated in Figures 15 and 16. It can be seen that the normalised stress intensity factor, Figure 15, shows little relative variation compared to that for T-stress, Figure 16. For selected cases, independent finite element analyses have been performed by the authors and a range of methods for evaluating T-stress have been used to give confidence in the results.
Figure 15. Normalised stress intensity factor, Fb, versus number of elements, N, in the model
Figure 16. versus number of elements, N, in the model
Two possible reasons for the difference in convergence are as follows. First, an absolute error in stress near the crack tip, and hence in T-stress, leads to a reduced error in KI by a factor proportional to , see equation (1). This would explain why convergence is better for smaller defect sizes, Figures 9-12. Secondly, it was found that the stresses and converged from above and below, respectively; therefore, the error in T-stress was essentially twice the error in either stress component, see equation (2) and Figure 17.
thickness. The results of the convergence studies are shown in Figure 18, in terms of the normalised T-stress of equation (3), and show similar trends to those obtained for the more complex cylinder geometry. Further, the 3-D converged solution is within 10% of the handbook plane strain 2-D solution (R6, 2015) for the bend specimen, giving additional confidence in the accuracy of the converged solutions.
Figure 17. Distribution of σxx and σyy at the position φ
=0° for the case
Rm/t=5, θ/π=0.25Figure 18. Mesh convergence in terms of βT in SENB specimen
Overall, therefore it appears that caution should be exercised in the use of T-stress solutions in the literature, where mesh refinement studies have been limited to demonstration of acceptable stress intensity factor solutions.
CONCLUSIONS
The finite element study of circumferentially through-wall cracked pipes under in plane bending, reported in this paper, indicates that the results for stress intensity factor are much less sensitive to element size than those for T-stress. Therefore, highly refined meshes have been used here to develop T-stress solutions for a range of crack sizes and pipe radius to thickness ratio. The solutions have been fitted by a polynomial with coefficients defined for a range of radius to thickness ratios, and thus are in a form suitable for use in practical fitness-for-service assessment approaches.
ACKNOWLEDGEMENTS
Support from the Engineering and Physical Sciences Research Council (EPSRC) under grant reference EP/K007815/1 is gratefully acknowledged.
REFERENCES
Dadfarnia, M., Sofronis, P., Somerday, B. P., Balch, D. K, Schembri, P., and Melcher, R. (2011). “On the environmental similitude for fracture in the SENT specimen and a cracked hydrogen gas pipeline,”
Engng FractMech 78, 2429-2438.
Gupta, M., et al, (2014). “A review of T-stress and its effects in fracture mechanics,” Engng Fract Mech,
http://dx.doi.org/10.1016/j.engfracmech.2014.10.013
Huh, N-S (2006). “Elastic T stress estimates for circumferential surface-cracked cylinders,” Fatique Fract Engng Mater Struct 29, 57-59.
Lacire, M. H., Chapuliot, S. and Marie, S. (1999). “Stress intensity factors of through wall cracks in plates and tubes with circumferential cracks,” ASME PVP 388, 13–21.
Lewis, T. and Wang, X. (2008). “The T-stress solutions for through-wall circumferential cracks in cylinders subjected to general loading conditions,” Engng Fract Mech 75, 3206-3225.
Meliani, M. H., Azari, Z., Pluvinage, G. and Matvienko, Y. G. (2010). “The effective T-stress estimation and cracks emanating from U-notches,” Engng Fract Mech 77, 1682-1692.
Moustabchir, H., Azari, Z., Hariri, S., and Dmytrakh, I. (2012) “Experimental and computed stress distribution ahead of a notch in a pressure vessel: Application of T-stress conception,” Comp Mater Sci 58, 59-66.
Qian, X. (2010). “KI-T estimation for embedded flaws in pipes-Part II: Circumferentially oriented cracks,” Int J Pres Ves Piping 87, 150-164.
R6: Assessment of the integrity of structures containing defects, Revision 4, including subsequent updates (2015). EDF Energy Generation, Gloucester, UK.
Sherry, A. H., France, C. C. and Goldthorpe, M. R. (1995). “Compendium of T-stress solutions for two and three dimensional cracked geometries,” Fatigue Fract Engng Mater Struct 18(1),141-155. Shlyannikov, VN., et al (2014). “The elastic and plastic constraint parameters for three-dimensional
problems, Engng Fract Mech, http://dx.doi.org/10.1016/j.engfracmech.2014.05.015
Zhao, J. and Guo, W. (2012). “Three-parameter K-T-Tz characterization of the crack-tip field in compact-tension-shear specimens,” Engng Fract Mech 92, 72-88.