Cyclic Shear Strain Threshold on Clean Sand
due to Cyclic Loading
Rini Kusumawardani
1, Untoro Nugroho
1, Hanggoro Tri Cahyo A
1, Lashari
1Lecturer, Soil Mecahnics Laboratory, Dept. of Civil Engineering, Universitas Negeri Semarang, Indonesia1
ABSTRACT: When a soil subjected by a cyclic loading, it induced a movement between soil particles. The first movement which caused a change of soil particle initial position was known as cyclic threshold of soil. This research was conducted in order to investigate a cyclic shear strain threshold by using conventional triaxial testing apparatus. A repeated monotonic loading and unloading at various densities relatives of soil, frequency of loading and strain amplitude are shown to be linked as the cyclic behaviour in a cyclic shear controlled triaxial testing program. An excess pore water pressure build up during the testing are shown as a main parameter to identify the cyclic threshold. Specimen were used at relative density (Dr) 25%, 60 % and 80%, with effective pressure σ3’ = 50, 100, 200 kPa and frequency of loading (f) applied 0.05 Hz and 0.1 Hz. The results obtained range γt was 1,5. 10-2 % - 2. 10-2 %.
KEYWORDS:cyclic loading, threshold cyclic shear strain, clean sand, triaxial testing
I. INTRODUCTION
Extensively researches were conducted in order to gained comprehensive results of movement soil granular due to cyclic loading. In nature, cyclic loading are presented by earthquake loading, pile driving vibration, traffic loading, ocean wave, machine foundation vibration, etc. Secondary phenomenon caused by cyclic loading is an occurrence of liquefaction phenomenon. In laboratory, this phenomenon could be seen in behaviour of pore water pressure inside of soil sample. Research method were commonly used by researchers are cyclic shear strain-controlled, cyclic shear stress-controlled and strain energy concept.
Fundamental parameter which could determine an increasing of pore water pressure when cyclic loading was applied is the threshold shear strain (γt). This parameter informs a minimum of cyclic strain amplitude applied which could
trigger the build up of pore water pressure on soil sample during the laboratory testing. Previous researches focused on pore water pressure behaviour caused by an application of cyclic loading were conducted since 1971’s. The shear stress controlled is the most popular method was used by researchers to obtain a threshold cyclic shear strain. Initial experimental results pointed out the presence of cyclic threshold shear strain were presented by Silver and Seed (1971), Youd (1972) and Stoll and Kald (1977). Furthermore, it continued by Dobry et al. (1982), Dyvik et al. (1984) and Ladd et al. (1989) with well explanation and introducing the concept of cyclic threshold shear strain in sands. Correlation between pore water pressure and amplitude of cyclic shear strain were introduced in order to indentify threshold point.
Various type of soil was examined by researches both in clean sand and cohesive soil. Dobry et al. (1982), Ladd et al. (1989) and Hsu and Vucetic (2004) confirmed their extensive investigation of buildup pore water pressure many sands due to cyclic loading is generally around γt = 0.01 %. Later on Vucetic (1994), Hsu and Vucetic (2004) and Uchida
Table 1. Previous research concerning to cyclic threshold shear strain
Reference Soil classification according
to ASTM standard
Plasticity Index, PI (%)
Cyclic threshold shear strain, γt (%)
Silver and Seed, 1971 Andreasson, 1979 Ladd et al., 1989 Hsu and Vucetic., 2006 Uchida et al., 2001
Clean sand Clay Clean sand Cohesive soil Clean sand NP 40 - 50
NP 14 - 30
NP
0.020 - 0.030 0.040 - 0.100
0.011 0.024 - 0.06
-II. CONCEPT OF THRESHOLD CYCLIC SHEAR STRAIN FOR PORE WATER PRESSURE
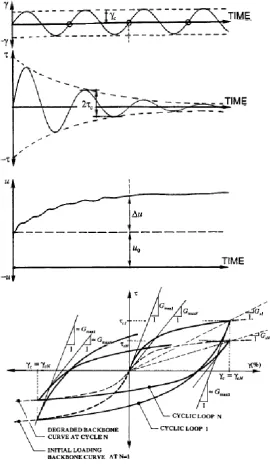
Threshold cyclic shear strain identified a microstructure change of soil granular when a cyclic loading subjected an element of soil. This parameter appears when the soil in undrained fully saturated condition subjected by a moderate or large shear strain amplitudes. The existing of threshold cyclic shear strain was identified by increasing of pore water pressure. The presence of pore water pressure (u=u0) changes with number of cyclic loading applied (N). During the cyclic loading was applied, pore water pressure (u=u0) become cyclic pore pressure (Δu) which is known by the excess pore-water pressure. It represents the pressure in the excess of u0.
III.MATERIALS AND METHODS
A. Physical properties of soil used in the study
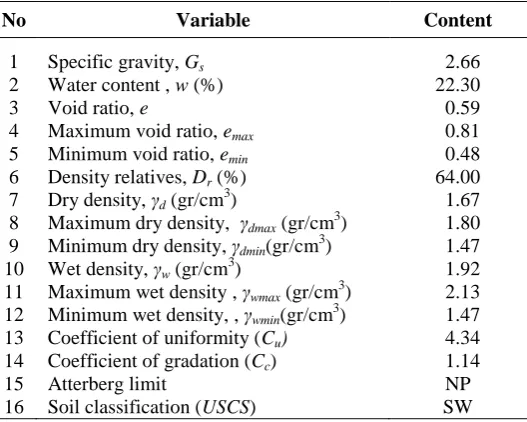
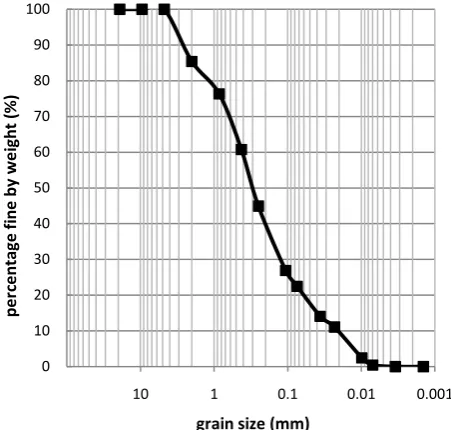
The soil sample employed in this research was collected from Yogyakarta city. Figure 2 shows the grain size distribution of the soil sample which classified as fine medium clean sand according to Unified Soil Classification System (USCS) and have angular shape. The soils were obtained -2.5 m below the ground surface as an undisturbed sample. Physical properties of soils demonstrate that overall sandy soil has specific gravity 2.66. The average of water content and void ratio are 22.7 % and 0.59 respectively. The soil properties of soil sample are listed completely in Table 2.
Table 2. Physical properties of soil sample
No Variable Content
1 2 3 4 5 6 7 8 9 10 11 12 13 14 15 16
Specific gravity, Gs
Water content , w (%) Void ratio, e
Maximum void ratio, emax
Minimum void ratio, emin
Density relatives, Dr (%)
Dry density, γd (gr/cm3)
Maximum dry density, γdmax (gr/cm
3 ) Minimum dry density, γdmin(gr/cm3)
Wet density, γw (gr/cm3)
Maximum wet density , γwmax (gr/cm3)
Minimum wet density, , γwmin(gr/cm3)
Coefficient of uniformity (Cu)
Coefficient of gradation (Cc)
Atterberg limit
Soil classification (USCS)
According to Fig. 2, we obtained some parameter, there are the mean size of soil particle (d50) are 0,4 mm, d10 = 0.116 mm, d30 = 0.258 mm, d60 = 0504 mm.and quantity of fines content (Fc) is less than 10 %. The granulometri testing identified that the value of uniformity coefficient and gradation coefficient are 4.34 and 1.14.
B. Testing equipment
This research were carried out by using cyclic triaxial testing which equipped with a set of controller, consisted of controller axial load, a controller confining pressure and controller pore water pressure. A soil sample with diameter 50 mm and height 100 mm were used as a specimen during the testing. At the bottom of soil sample was installed a porous stone. Illustration of triaxial testing equipment can be seen in Figure 3.
0 10 20 30 40 50 60 70 80 90 100
0.001 0.01
0.1 1
10
p
e
rc
e
n
tag
e
f
in
e
b
y we
ig
h
t (
%
)
grain size (mm)
Fig 2. Soil distribution curve of soil sample
O-ring
Porous stone Soil specimen
enclosed with rubber membrane
Top cap with porous stone at the
bottom Submersible
load cell
Cell pressure line Pore water pressure
C. Sample preparation
A disturbed sample was chosen to facilitate the preparation of the test specimen before the test was commenced. For each sample were prepared 350 gram of dry soil were prepared. Dry pluviation was chosen as a sample preparation method. Firstly, soils were dropped to the mold soil sample with 50 mm diameter and 100 mm height and the other side water adjusted to the value Dr = 25%, 60%, and 80%. Then it continued by enclosed a soil sample with rubber membrane. A porous stone was attached at the triaxial cell base below the soil sample before the testing. During this process, the soil will absorb the water slowly. After the specimen has been prepared, then it is transferred to the triaxial cell. Before starting the next proces, the triaxial cell must be fully fulfilled using de-aered and de-mineralised water.
Before the test started, the specimen was isotropically consolidated and this process was conducted for one night in triaxial apparatus. Thus it continued by saturation process. During the saturation process, applied an increasing the back pressure and cell pressure until reach the Skempton value greater than 0.95.
IV.EXPERIMENTAL RESULTS
A. Threshold cyclic shear strain
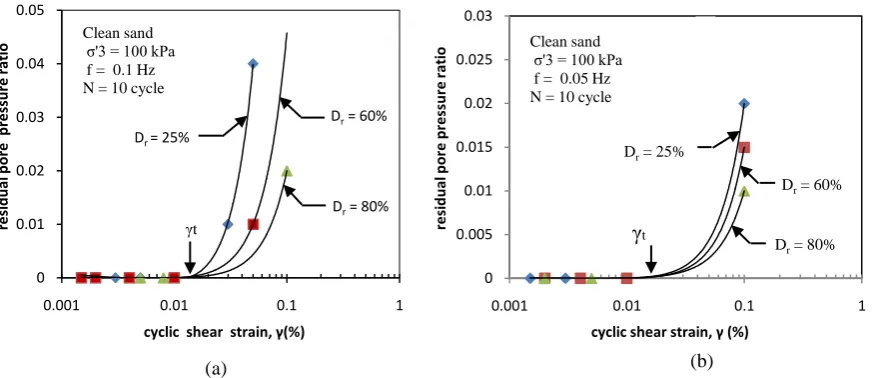
A series of test were carried out at various effective confining pressure (σ’3), relative densities (Dr) and frequency (f) of loading applied. Thus, the data was plotted with the amplitude of cyclic strain against excess pore water pressure. The relationship between amplitude of cyclic strain and excess pore water pressure could identify the threshold of clean sand cyclic shear strain. The results confirmed at Figure 4 when the effective confining stress (σ’3) = 100 kPa applied on the sample with different relative density of 25%, 60% and 80%. Two various frequencies (f) of loading was subjected on soil sample, there were 0.05 Hz and 0.1 Hz. For those two frequencies, it depict an increasing of the pore water pressure occurs when the threshold cyclic shear strain (γt) reaches 1.5.10-2 %. Increasing of density relative influenced the amplitude of cyclic strain applied which trigger the soil particle slide each other. From figure 4 (a) and (b) confirmed those frequencies (f) of loading trigger an increasing of residual pore water pressure. Nevertheless, between f = 0.5 Hz and f = 0.01 Hz, they obtained the similar threshold cyclic shear strain.
0 0.01 0.02 0.03 0.04 0.05
0.001 0.01 0.1 1
re
si
dual
pore
pre
ss
ur
e
r
at
io
cyclic shear strain, γ(%)
Clean sand σ'3 = 100 kPa f = 0.1 Hz N = 10 cycle
Dr = 25%
Dr= 60%
Dr= 80%
γt
0 0.005 0.01 0.015 0.02 0.025 0.03
0.001 0.01 0.1 1
re
si
dual
pore
pr
e
ss
ur
e
r
at
io
cyclic shear strain, γ (%)
Clean sand σ'3 = 100 kPa f = 0.05 Hz N = 10 cycle
γ
tDr= 25%
Dr= 60%
Dr= 80%
(a) (b)
Various level of effective confining pressure (σ’3) were applied on a series of testing, there are 50 kPa, 100 kPa and 200 kPa. The results of testing which illustrated a comparison behavior of soil subjected by a different effective confining pressure could be seen at Figure 5. This figure revealed a comparison behavior of clean sand at Dr = 60% with f = 0.1 Hz and 0.05 Hz. The buildup of residual pore water pressure (Δur) was noted on the different variation of σ’3. This figure depicted that the testing obtained the same value of γt when applied σ’3 between 50 kPa up to 100 kPa. Furthermore when σ’3.equal to 200 kPa was applied, it depicted the increasing of γt. It could be concluded that increasing of confining effective stress on soil, it induced the increasing of resistance of soil against the shear stress. According to the Figure 5, the frequency (f) of loading applied influenced a residual pore water pressure ratio behavior at the cyclic shear strain considered and they have a positive relation.
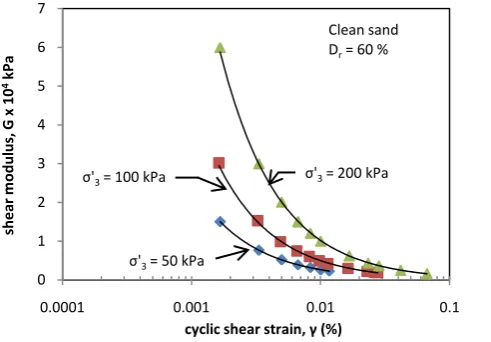
B. Shear Modulus
A soil parameter which could identify the soil strength against shear stress of soil is known as shear modulus. The relation between shear modulus (G) and cyclic shear strain at first cycle of loading in dense specimen (Dr = 60 %) is illustrated in Figure 6.
0 0.02 0.04 0.06 0.08 0.1 0.12 0.14 0.16 0.18
0.001 0.01 0.1 1
re si dual pore pr e ss ur e r at io
cyclic shear strain, γ (%) σ'3=50kPa
σ'3=100kPa σ'3=200kPa Clean sand
Dr = 60 % f = 0.1 Hz N = 10 cycle
σ'3= 200 kPa
50 kPa ≤ σ'3≤ 100 kPa
γt γt
0 0.005 0.01 0.015 0.02 0.025
0.001 0.01 0.1
re si dual pore pr e ss ur e r at io
cyclic shear strain, γ (%) σ'3=50kPa
σ'3=100kPa σ'3=200kPa Clean sand
Dr= 60 % f = 0.05Hz N = 10 cycle
50 kPa ≤ σ'3≤ 100 kPa
σ'3= 200 kPa
γt γt 0 1 2 3 4 5 6 7
0.0001 0.001 0.01 0.1
she ar m odul us , G x 10 4kPa
cyclic shear strain, γ (%)
σ'3= 200 kPa
σ'3= 50 kPa
σ'3= 100 kPa
Clean sand
Dr= 60 %
Fig 5. Cyclic shear strain γt of soil sample at different effective confining pressure
During the testing, the effective cell pressures applied were 50 kPa, 100 kPa and 200 kPa respectively. From the figure, it depicted that effective cell pressure have an influence to shear modulus of soil sample. For clean sand, an increasing of cyclic shear strain caused a decreasing of shear modulus of soil. This phenomenon represents the soil resistance of soil when a cyclic loading applied. Thus, a confining cell pressure was represented as a support for soil to against a shear stress
V. CONCLUSION
The cyclic shear strain γt is the fundamental parameter in soil dynamic behaviour analysis. Since could distinct into two zone of pore water pressure build up during the loading, this parameter represent the initial movement of soil particle. Due to of cyclic loading, the soil particles slide each other on their surface. Fist movement of sliding trigger the development of pore water pressure and this phenomenon could be represented as a threshold of pore water pressure. Two distinction of two zones as follows, first, a zone with an application of γ < γt does not induced an increasing of the pore water pressure. Second, a zone with an application of γ > γt, it revealed a build up of pore water pressure due to cyclic loading. Furthermore, a shear modulus of soil was influenced by frequency (f) of cyclic loading, an effective confining pressure and amplitude of cyclic shear strain. These parameters have a negative relation to shear modulus of soil. If we increase these parameters, it triggers a decreasing of shear modulus of soil.
ACKNOWLEDGMENT
The authors would like thanks to Directorate General of Higher Education (Dikti) of Indonesia which supported a funding of this research through DIPA FT UNNES 2015.
REFERENCES
[1] Andreasson, B.A., “Deformation characteristics of soft, high-plastic clays under dynamic loadimg condition”, Phd thesis, Departement of
Geotechnical Engineering, Chalmers University of Technology, Gothenberg, Swedia, 1979
[2] Dobry, R., Ladd, R.S., Yokel\, F.Y., Chung, R. M. and Powell, D., “ Prediction of pore water pressure buildup and liquefaction of sands during earthquakes by the cyclic strain method”, National Bureau of Standard Building Science Series 138, National Bureau of Standard Tehnology, 1982
[3] Dyvik, R., Dobry, R., Thomas, G. E. and Pierce, W. G., “Influence of consolidation shear stresses and relative density on threshold strain and
pore pressure during cyclic straining of saturated sands”, Miscellaneous Paper GL-84-15, Departement of The Army Corps of Engineering, Washington DC, 73, 1984
[4] Hsu, C. and Vucetic, M., “Volumetric threshold shear strain for cyclic settlement”, Journal of Geotechnical and Geoenvironmental
Engineering, Vol. 130, No. 1, pp. 58-70, 2004.
[5] Hsu, C.C and Vucetic, M., “Threshold Shear Strain for Cyclic Pore Water Pressure in Cohesive Soils”, Journal of Geotechnical and
Geoenvironmental Engineering, ASCE, Vol. 132, No.10, pp 1325-1335 , October 2006
[6] Ladd, R.S., Dobry, R., Dutko, P., Yokel, F.Y., and Chung, R.M., “Pore-Water Pressure Buildup in Clean Sands Because of Cyclic Straining”,
Geotechnical Testing Journal, Vol. 12 No.1, pp 77-86 , March 1989
[7] Silver, M.L. and Seed, H.D., “Volume change in sands during cyclic loading”, Journal Soil Mechanics and Foundation, Div. ASCE, Vol. 97,
No. 9, pp. 1171 – 1182
[8] Stoll, R.D. and Kald, L., “Threshold of dilatation under cyclic loading”, Journal of Geotechnical Engineering, Div. ASCE, Vol. 103, No. 10,
pp. 1174-1178
[9] Uchida, K. and Stedman, J.D., “Liquefaction Behavior of Toyura Sand Under Cyclic Strain Controlled Triaxial Testing”, Proceedings of the
Eleventh International Offshore and Polar Engineering Conference, pp 350-356 , June 2001
[10] Vucetic, M., “ Cyclic Threshold Shear Strain”, Journal Geotechnic Engineering, Vol 120, pp. 2208-2228, 1994