Smart Thermostat:
To Measure & Control the Temperature
based on Bio-Sensing Technique
Rahul Gandhi1
M.Tech, Dept. of Electronics & Communication (Embedded System), Ganpat University, Mehsana, Gujarat, India1
Ravi Parmar2
M.Tech, Dept. of Electronics & Communication (Embedded System), Ganpat University, Mehsana, Gujarat, India2
Mohit Sinha3
Fellow - IP Group (PES), eInfochips, Pune, India3 [email protected]
Prof. Kaushal Patel
U.V. Patel College of Engineering, Ganpat University, Mehsana, Gujarat, India
ABSTRACT
Since few years, Humans were trying to control various parameters of natural (nature made) system. They were succeeded in Fire, wind, water, temperature etc. These measuring and control mechanisms are called as smart mechanism or automation. Smart Thermostat is one to measure and control the temperature of any specific area.
A Smart Thermostat is having a bidirectional communication to receive (Measure) the data and process (Control) on it. Temperature sensors is used to measure temperature, PIR sensors to detect the movement in the room by using LabVIEW and Arduino as a user interface and processing units to make it automatic. System allows user to feed desired reference temperature which is required in a room. LabVIEW will display the change in room condition so any one can easily visualize it.
Keywords:LabVIEW, Arduino UNO, PIR sensor,
LM35 (temperature sensor)
INTRODUCTION
Smart Thermostat
A thermostat is a component of a control system which senses the temperature of a system so that the system's temperature is maintained near a desired set point. The thermostat does this by switching heating or cooling devices on or off, or regulating the flow of a heat transfer fluid as needed, to maintain the correct temperature.[2] It works by sensing the air temperature, switching on the heating when the air temperature falls below the thermostat setting, and switching it off once this set temperature has been reached. Turning a room thermostat to a higher setting will not make the room heat up any faster. How quickly the room heats up depends on the design of the heating system, for example, the size of boiler and radiators. This system is very important and essential for various industrial experimental setups to measure and control the temperature as per requirements. Measuring and controlling of physical parameters by embedded system using various processing units like Arduino and LabVIEW are very effective in industry to provide automation in some stage.
In Smart Thermostat, Temperature measurement is done by LabVIEW and LM35 while Temperature control is done by LabVIEW, Arduino and PIR sensor which follows equations likes of Heat Exchange Equation and many more.[6]
Heat Exchange Equation
Where,
T (t) = Temperature at time t
TA = Ambient temperature (Temperature of
Surroundings)
TH = Temperature of Hot object at time T0
k = Positive constant and t =time
Figure 1: Heat Exchange Equation Graph: Temperature vs Time
Equation of Cooling:
Where,
Tcooling = Temperature at time t, TAC = Temperature of AC,
TSensor = Temperature at particular Sensor,
Fr = Flow rate,
V = Volume of a Room,
Alpha and Beta are constant and ndt is time constant.
Equation of Heating:
Where,
THeating = Temperature at time t,
TExtAmb Temp = External Ambient Temperature,
TSensor = Temperature at particular Sensor,
Fr = Flow rate,
V = Volume of a Room,
Alpha' and Beta' are constant and ndt is time constant.
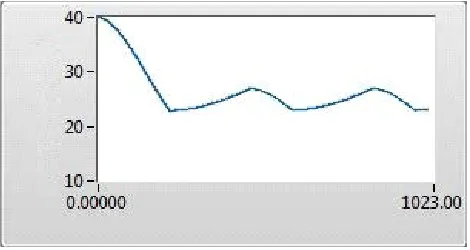
Figure 2: Graph of Cooling-Heating: Time vs Temperature
For simulation model, we can consider the temperature near any particular Sensor by following equation.
Heat and Temperature Distribution Equation (For Simulation model only)
Where,
(x,y) indicates position of Sensor & (a,b) indicates position of AC
R =constant which should be <= (a2 + b2)½
Note that, this equation is only for simulation model otherwise we have temperature sensors to measure the temperature.
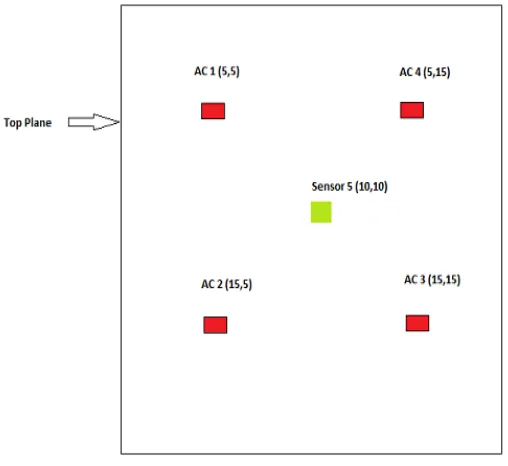
A Smart Thermostat had been implemented using four ACs (connected with PIR) and five temperature sensors. Position of ACs and Sensors are shown in figure 3. Sensor 1 to Sensor 4 are as nearer as to ACs to measure the temperature of that respective ACs. Sensor 5 is in Center to measure the average temperature of room which is in the range of desired or reference temperature.
Figure 3: Position of ACs and Sensors
The main aim to design the Smart Thermostat is to use multiple ACs and Sensors together using LabVIEW that works like if any one AC fails/Switched Off, it will not affect the average room temperature measured at center i.e. temperature will be in the range of desired or reference temperature. If 3 among 4 AC fails/Switched Off at a same time, load at the remaining AC will be increased to set desired temperature.
GUI of Smart Thermostat
Figure 4: GUI of Smart Thermostat
As mentioned earlier, this project is developed using LabVIEW. GUI of Smart Thermostat is shown in figure 4. At room condition (named as Temperature control in figure 4), graphs has been made to visualize the change in temperature at a particular ACs (named as Temp at AC in figure 4) and center (named as Ts5) done easily. Graph and Indicators shows whether that particular AC is ON or OFF. All ACs are connected to PIR sensors via Arduino Board to make respective ACs automatic. PIR sensors are used to detect the motion of the room. If any person comes in that specific range of sensor, it will be activated and that AC will be ON which can be visualized by Indicators or Graph.
About LabVIEW
LabVIEW stands for Laboratory Virtual Instrumentation Engineering Workbench. It started in 1983 by a company National Instruments which famously stands for NI. NI LabVIEW is a graphical development platform designed for engineers and scientist. Like C, JAVA, the LabVIEW software is known as ‘G’ language. Its
interfacing is in GUI i.e. the complete program is represented in block diagrams instead of having syntaxes. This makes the programming language more easily understandable. LabVIEW application is majorly in Industrial Automation.[4,7]
SOFTWARE DEVELOPMENT
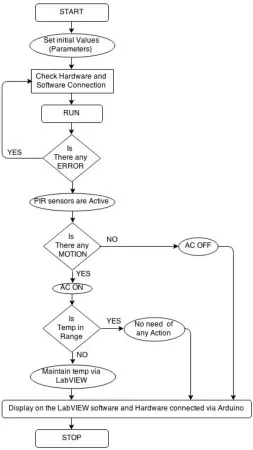
The figure 5 shows the flowchart of working model of Smart Thermostat.
Figure 5: Flowchart of Smart Thermostat
As shown in flow chart, to develop a multiple smart thermostat using bio-sensing technique using LabVIEW, hardware like Arduino, PIR and LM35 sensors has been used.
After starting LabVIEW software, initialize or define all the required set of values and check for the possible connections of hardware with LabVIEW and RUN the code. If error occurs, resolve it. Generally it is due to memory buffer or communicating Baud-Rate which should be around 9600 for both LabVIEW and Arduino to synchronize data serially.
If there is no error, than after 10 seconds (which can be set by developer for initiate sensors, generally it should be in the range of 10 to 60 seconds), all PIR sensors will be activated and it will check for motion. If there is motion, it will start respective AC automatically and temperature has been maintained in a specified range. Output has been displayed on LabVIEW Front Panel Screen as shown in figure 4.
Back panel also called as Block Diagram which consists of actual process and various mathematical equations (implemented in graphical terms) which are used to develop in Smart thermostat.
For Simulation model a project, room of size 20X20 in which we are feeding cubes of ACs and Sensors has been considered. For creating a room, five 2D plane (Top, Bottom, Left, Right and Back) connected in such a manner that it seems like a 3D plane. ACs are placed on Top plane. Position of ACs and Sensors are already shown in figure 3. After Developing 3D plane (which seems like one complete Image), next task is to develop Heating and Cooling equation based on Heat Transfer Equation which are shown above. To decide either heating or cooling operation, Bio sensing technique has been used. It uses PIR sensor to detect the motion available in the room. Heating or cooling operation is based on two conditions. First is, it will check the motion available in the room. If there is motion, it start cooling. Second is, it will check the range of temperature. According to range of temperature it will perform heating/cooling operation.
Switching of ACs as per requirement has been done, but main thing is that to measure the temperature. As the name suggest, Smart Thermostat, multiple Temperature sensors located at different location of the room are used to measure the temperature. All sensors are set as nearer as ACs to measure the temperature flow from ACs when it is ON and near when ACs are OFF. Sensor 5 is in Center to measure the average temperature of room which is in the range of desired or reference temperature. If person stands in center all ACs will be ON, otherwise respective ACs will be ON.
HARDWARE DEVELOPMENT
Figure 6: Hardware of Smart Thermostat
Arduino UNO
As shown in Figure 6, Arduino is an intermediate between LabVIEW and all sensors. Arduino board consist of 8-bit Atmel AVR microcontrollers or 32-bit Atmel ARM processor in it which works on 5 to 12 V and has a 14 Digital (among this 14, 6 provides PWM output) and 6 Analog I/O pins. It has 32 KB (for ATmega328) flash memory of which 0.5 KB used by boot-loader, 2 KB (for ATmega328) of SRAM and 1 KB (for ATmega328) of EEPROM. It has clock speed of 16 MHz.[8]
LM35
LM35 Temperature sensor operates on 4 to 30 V and has a less than 60 uA current Drain. It is calibrated Directly in Celsius (centigrade). It has a Linear Scale Factor of 10 mV/`C. It can give output in the range of -55 `C to +150 `C.[9]
PIR Sensor (HC-SR501)
PIR motion Detector, HC-SR501 is based on infrared technology, automatic control module, using Germany imported LH1778 probe Design, high sensitivity, high reliability, ultralow voltage operating mode, widely used in various auto sensing electrical equipment, especially for battery powered automatic controlled product. It works on voltage which ranges in 5 to 20 V and has a power consumption of 65 mA. It has sensing range of less than 120 degree, within 7 meters and can work in -15 to +70 `C.[5]
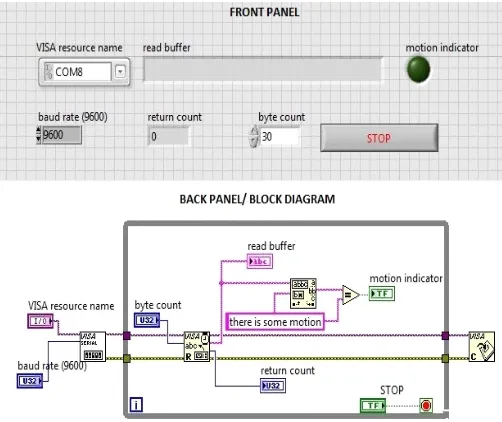
LabVIEW has its own hardware known as DAQ card and it supports to 3rd party hardware known as Arduino. Simple configuration to interface Arduino and LabVIEW is shown in figure 7. Data are transmitted serially from LabVIEW to Arduino and vice versa.
Figure 7: Interface between LabVIEW and Arduino
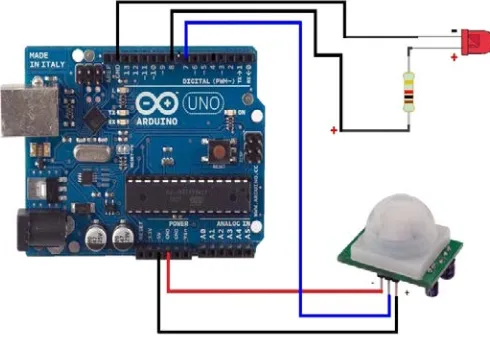
As discussed, PIR is connected with Arduino. When there will be motion, it will blink the light and display that "there is some motion". This text will be serially transmitted to LabVIEW and it will compare the text. If it is matched, it will start the lights on LabVIEW and connected to Arduino. This is how this ACs' automation works. This is explained in figure 7. Figure 8 shows the interface of PIR with Arduino. Here we have shown one PIR sensor interfacing with Arduino. In real we are interfacing 4 PIR sensors with Arduino which has same connection shown below:
Figure 8: PIR-Arduino Hardware Interface
CONCLUSION
By using Smart Thermostat it is possible to maintain temperature of a room with multiple ACs usingLabVIEW. It also control the ACs according to presence of person under the ACs using Arduino, PIR and LabVIEW which can save the electricity and lifespans of ACs.
REFERNCES
1) DushyantPande, Jeetender Singh Chauhan, NitinParihar, "The Real Time Hardware Design to Automatically Monitor and Control Light and Temperature", International Journal of Innovative
Research in Science, Engineering and Technology,
Vol. 2, Issue 5, May 2013, ISSN: 2319-8753
2) http://en.wikipedia.org/wiki/Thermostat
3) A thesis, "Design of Temperature Controllers using LabVIEW, completed by Abhilash Mishra &Pinaki Mishra, department of ECE, student of National Institute of Technology, Rourkela, odisha, in year 2013
4) B V Sumangala& K Bhargava Ram, “Advantage of LabVIEW over Embedded System in Home Automations”, International Conference on Advancement in Engineering Studies & Technology, ISBN: 978-93-81693-72-8, 15th JULY, 2012, Puducherry
5) For PIR sensor:
http://www.mysensors.org/motion/HCSR501.pdf
6) Heat Transfer Equation or Newton’s low of cooling:http://vlab.amrita.edu/?sub=1&brch=194& sim=354&cnt=1
7) LabVIEW basics: http://www.free- ebooks.net/ebook/LabVIEW-Graphical-Programming
8) For Arduino basic:
http://arduino.cc/en/main/arduinoBoardUno
9) LM35 Temperature sensor:
http://www.ti.com/lit/ds/symlink/lm35.pdf