Modelling Temperature Variation of
Mushroom Growing Hall Using Artificial
Neural Networks
Sina Ardabili 1, Amir Mosavi 2,3*, Asghar Mahmoudi 4, Tarahom Mesri Gundoshmian 5, Saeed Nosratabadi 6, Annamaria R. Varkonyi-Koczy2,7
1Institute of Advanced Studies Koszeg, Koszeg, Hungary
2Institute of Automation, Kalman Kando Faculty of Electrical Engineering, Obuda
University, Budapest, Hungary
3School of the Built Environment, Oxford Brookes University, Oxford, UK 4Department of Biosystem Engineering, University of Tabriz, Tabriz, Iran 5Department of Biosystem Engineering, University of Mohaghegh Ardabili, Ardabil,
Iran
6 Institute of Business Studies, Szent Istvan University, Godollo 2100, Hungary 7Department of Mathematics and Informatics, J. Selye University, Komarno, Slovakia
Corresponding:[email protected]
Abstract: Recent advancements of computer and electronic systems have motivated the extensive use of intelligent systems for automation of agricultural
industries. In this study, the temperature variation of the mushroom growing
room is modeled through using a multi-layered perceptron (MLP) and radial
basis function (RBF) networks. Modeling has been done based on the
inde-pendent parameters including ambient temperature, water temperature, fresh air
and circulation air dampers, and water tap. According to the obtained results
from the networks, the best network for MLP is found to be the second
repeti-tion with 12 neurons in the hidden layer and 20 neurons in the hidden layer for
radial basis function networks. The obtained results from comparative
parame-ters for two networks showed the highest correlation coefficient (0.966), the
lowest root mean square error (RMSE) (0.787) and the lowest mean absolute
error (MAE) (0.02746) for radial basis function. Therefore, the neural networks
with radial basis function was selected as the optimal predictor for the behavior
of the system.
Keywords: agricultural production; environmental parameters; mushroom growth prediction; machine learning; artificial neural networks (ANN); food
production; food security; multi-layered perceptron (MLP); radial basis
func-tion (RBF)
1 Introduction
Nowadays, Due to issues such as population growth and limited agricultural
resources including land and freshwater, the necessity of attention to new
meth-ods and efficiency in agricultural production, is quite evident [1]. A number of
clinical studies in Japan and the United States of America have shown that a
certain percentage of polysaccharides against breast cancer, lung, liver, prostate
and brain tumors is effective [2, 3]. The benefits of this product is promising to
use this product in the diet. The growth period of this product consists of several
stages and each of these stages requires different controlling condition [1]. The
use of intelligent systems for automation in agriculture industries has been due
to the development of computer systems and electronics in recent decades. With
these systems, we can control the environmental parameters involved in
mush-room production halls. Temperature is one of the parameters that shows a high
impact on mushroom growth, and chemical reactions are intensive at higher
temperatures. In biological processes such as growth, the effect of temperature
can be easily observed where vast quantities of chemical reactions occur. The
optimum temperature for mushrooms, depending on the stage and type of race,
is 17 to 30 degrees Celsius. The metabolism of consumed food by
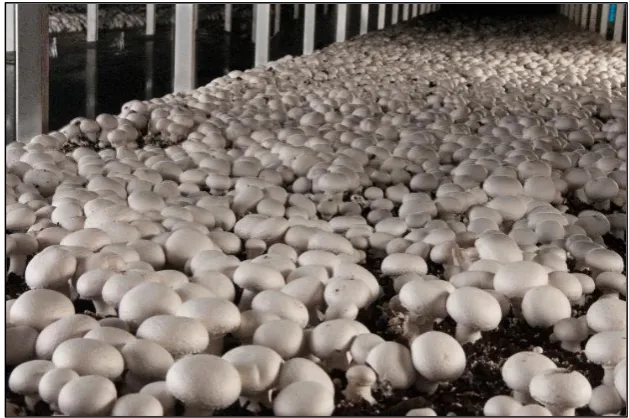
produces the heat. For example, rising compost temperature decreases crop
pro-duction. Figure 1 shows the lack of mushroom production in the middle of the
bed whenthe compost temperature is higher than the standard value [1].
Fig. 1. The effect of temperature value on mushroom production
The successful cultivation of mushroom is possible when parameters such as
temperature, humidity, and carbon dioxide concentration, pests and diseases
and also preparing compost have been controlled and inspected properly.
Envi-ronmental factors have the most influence on the quality of the product on the
growth stage [4]. Problems in the field of parameters controlling on mushroom
cultivation halls forced us to do studies on controlling these parameters.
Man-ually and traditional controlling methods are under the influence of factors such
several studies were carried out with different control methods. Faizollahzadeh
et al[4] presented controlling system using fuzzy and digital controllers to
con-trol the environmental parameters of the mushroom production hall. Previous
studies with presented methods have the complexity of calculation in control
strategies. Today, predictive control is used in industrial applications to develop
control strategies[5]. Among the systems that have the capability to model and
predict the behavior of systems, can point to artificial neural networks. A neural
network consists of a number of processing elements or computing nodes that
are very simple and interconnected. This network is an algorithm information
processing that is processing by dynamic response related to processing
ele-ments and their connections to lateral inputs[6]. The most common neural
net-works are Multi-Layered Perceptron (MLP) and Radial Basis Function (RBF)
networks.
The main aim of this study is to present a predictive model of the temperature
variation of the mushroom growing room by artificial neural networks based
on the variables that are affecting on room temperature (ambient temperature,
water temperature, fresh air dampers, circulation air dampers, and water tap).
To reach this purpose, the study consists of three phases. The first stage is
ana-lyzing the required data. The second stage presents MLP and RBF models and
the last stage presents the results and a comparison of networks and introduces
2 Material and methods
2.1 Data collecting
This research was studied in one of the mushroom production halls of
Saba-lan agro-industry company (SabaSaba-lan Mushroom) in Ardabil province of Iran.
The target hall has dimensions of 22, 5/6, 5/4 m (length, width, height,
respec-tively) and has 1850 compost with a weight of approximately 15 kilograms for
each compost. In order to data collecting operation, three PT-100 sensors were
used. The location of temperature sensors in terms of height and width was in
the middle of the hall height and width and in term of length were located on
three points including the beginning of hall, the middle of the hall and the end
of the hall. This method of the arrangement of sensors was used because the
longitudinal air circulators in two top corners of the hall make airflow in
verse and height directions of Hall and provide thermal equilibrium on
trans-verse and height directions of the hall, and if there is a temperature difference,
this difference will be in the longitudinal direction of hall.
Compost generates heat. There is a need to maintain and stabilize the
tem-perature of compost at every stage of the growth cycle and since the volume of
compost is lower than the indoor air volume of the growing hall, the operation
of stabilizing of compost temperature should be done by changing hall
temper-ature.
Data collecting operations were done in the winter season and due to
varia-tions of ambient temperature, an external temperature logger was used to record
temperature changes. Data collecting operations were performed at different
reps. In order to record the required data, Autonics temperature controller
TKM-B4RC was used that was equipped with RS485 output and related
variations of fresh air dampers, hot water tap and hot water temperature were
as independent variables and indoor temperature of hall was as the only
de-pendent variable. To adjust the room temperature and variation of input
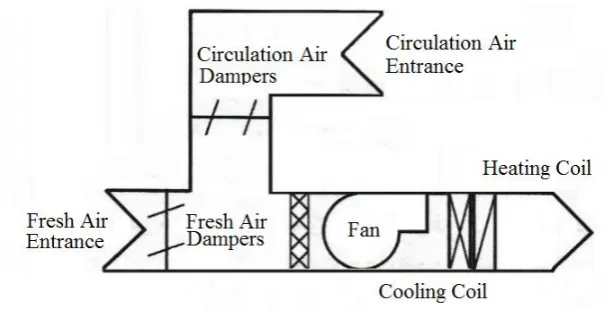
varia-bles, it was using air conditioning systems (Fig. 2).
Fig. 2. Air conditioning system
This system is capable of cooling and heating, generating indoor air
circula-tion by air ducts, providing required relative humidity and reducing the carbon
dioxide concentration using fresh air dampers. Operation of temperature control
in this system is performing by variating hot and cold water Debbie as well as
opening and closing the air dampers. This system has two air inputs
(Circula-tion and fresh air dampers) and an air output that the circula(Circula-tion air damper is
for circulating the hall atmosphere and the fresh air damper is controlling
tem-perature, humidity or carbon dioxide concentration by entering fresh air to
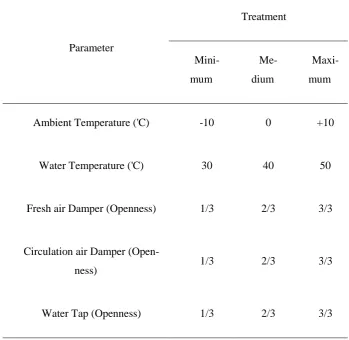
hall[1]. Measurement of independent variables such as the air dampers and hot
water tap were performed at three levels including minimum, medium and
operation season, the outdoor air was used for cooling operations instead of
cold water. Because the cold water would freeze and damage the coils in this
season. Data were collected in 3 treatments and different repetitions to achieve
high accuracy. Table 1 shows the different treatments for independent
varia-bles.
Table 1. Treatments of independent variables for data collecting
Treatment
Parameter
Maxi-mum
Me-dium
Mini-mum
+10 0
-10 Ambient Temperature ('C)
50 40
30 Water Temperature ('C)
3/3 2/3
1/3 Fresh air Damper (Openness)
3/3 2/3
1/3 Circulation air Damper
(Open-ness)
3/3 2/3
2.2 Artificial Neural Networks (ANNs)
Literature includes a vast number of machine learning methods used for the
purpose of the modeling and prediction [7-26]. Machine learning models
gen-erally out-perform most of the statistical and mathematical models in term of
computation cost, efficiency and accuracy [27-40]. ANNs are considered as an
efficient methods for developing reliable models. This study employs two types
of neural networks including multilinear perceptron (MLP) and radial basis
function (RBF). Before starting the training process, data have been divided
into two categories of training data (with a share of 70%) and testing data (with
a share of 30%), randomly. The training process was started with the different
number of neurons in the hidden layer and the function of each parameter was
measured with respect to the base parameter. To determine the optimal number
of neurons in the hidden layer and to obtain the best predictor network, in first
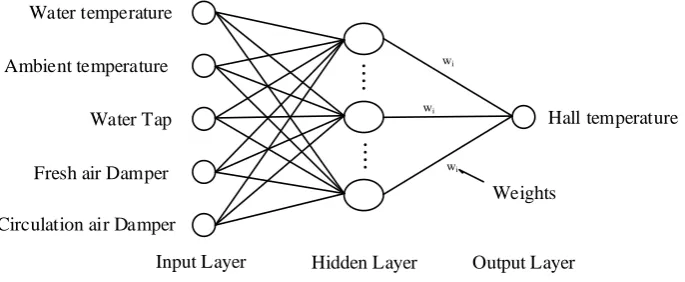
stage the network was trained with one neuron on a hidden layer. Fig. 3 presents
the structure of the RBF network.
Water temperature Ambient temperature
Water Tap Fresh air Damper Circulation air Damper
Hall temperature
wi
wi
wi
Weights
Hidden Layer
Input Layer Output Layer
Evaluating the results have been conducted by employing Root Mean Square
Error (RMSE), correlation coefficient (R) and mean absolute error (MAE) were
used [41] to analyze the output of networks and target values.
21
1 N
i
MSE A P
N
(2)
21
1 N i
RMSE A P
N
(3)1/ 2 2 1 2 1 ( ) 1 n i n i i A P R A
(4) 1 N i A P MAE N
(5)That A is the target value, P is the predicted values and N is the numbers of
data.
3 Results
In this study, the temperature variation of the mushroom growing hall, as an
critical factor of mushroom production, was modeled based on dependent
var-iables including ambient temperature, fresh air damper, circulation air damper,
modeling operations, there is a need to be aware of the general nature of the
system that this is carried out by experimental data related to the system. For
this purpose, the experimental data were obtained from the studied system using
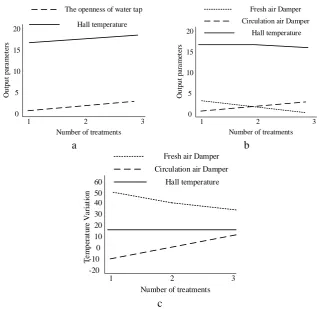
the introduced strategy in table 1. Figure 4 indicates the results of data
collect-ing and the relationship among the actuators and the related parameter.
Circulation air Damper
O u tp u t p ar a m et er s Hall temperature 20 15 10 5 0
1 2 3
Number of treatments Fresh air Damper The openness of water tap
O u tp u t p ar a m et er s Hall temperature 20 15 10 5 0
1 2 3
Number of treatments
b a
Circulation air Damper
T e m p er at u re V a ri at io n Hall temperature 60 40 20 -10 -20
1 2 3
Number of treatments Fresh air Damper
0 10 30 50
c
According to Figure 4 (a) by considering the fixed value of other parameters,
opening hot water tap, increases the growing hall temperature. Figure 4 (b)
shows the variation of growing hall temperature by opening and closing air
dampers when other parameters are fixed. Accordingly, if the rate of opening
and closing of circulation and fresh air dampers be equal, respectively, the hall
temperature almost will be fixed. In Figure 4 (c) by reducing the temperature
of the water and by increasing the ambient temperature during the day, the
growing hall temperature has undergone a constant trend.
3.1 Training process
This section presents the results of choosing the best network for the training
process based on the performance functions for RBF and MLP separately.
Table 2. the result of selecting the best network for MLP model
Value of
perfor-mance function
for testing data Value of
perfor-mance function
for training data Value of
perfor-mance function
for validation
data Numbers of the
neuron on
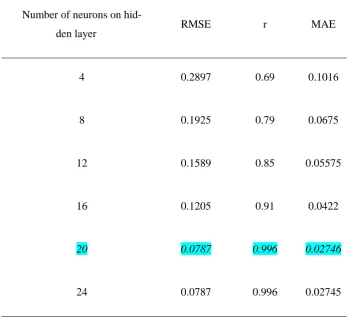
hid-den layer/repe-tition 0.84431 0.42202 0.55064 12/1 0.82541 0.41001 0.53321 12/2 0.84522 0.41056 0.52248 12/3 0.82541 0.41001 0.52248 Minimum value 0.84522 0.42202 0.55064 Maximum value 0.83831 0.41419 0.53544 Average
According to table 2, the best result (lowest values of the performance
func-tion for testing data) is obtained in the second repetifunc-tion of the training process.
prepared to choose the best number of neurons in the hidden layer for RBF
network.
Table 3. the result of selecting the best number of neurons on hidden layer for RBF network
MAE r
RMSE Number of neurons on
hid-den layer
0.1016 0.69
0.2897 4
0.0675 0.79
0.1925 8
0.05575 0.85
0.1589 12
0.0422 0.91
0.1205 16
0.02746 0.996
0.0787 20
0.02745 0.996
0.0787 24
As shown in Table 3, by increasing the number of neurons in the hidden
layer, the correlation coefficient is increased and mean absolute error and root
After 20 neurons, these parameters remained stable and have not changed,
so the number of 20 neurons in the hidden layer were selected as the optimal
number of neurons. The networks were trained after selecting the optimal
num-ber of neurons to neural network Multilayer Perceptron and Radial Basis
Func-tion networks were trained. After the training process, test data were imported
to developed networks and output data were generated to compare with the
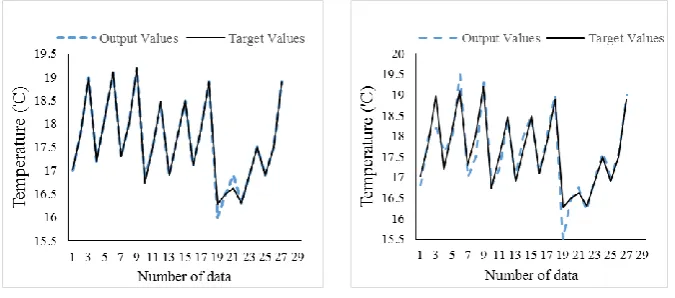
tar-get values. The results of the tartar-get and the predicted values are shown in Figure
5 and Figure 6:
b a
a b
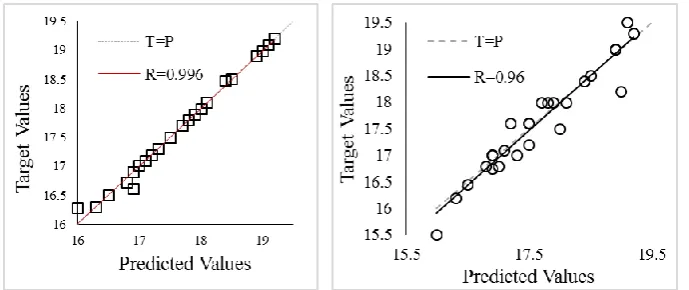
Fig. 6. Scatter plot of predicted and target values a) RBF network b) MLP network
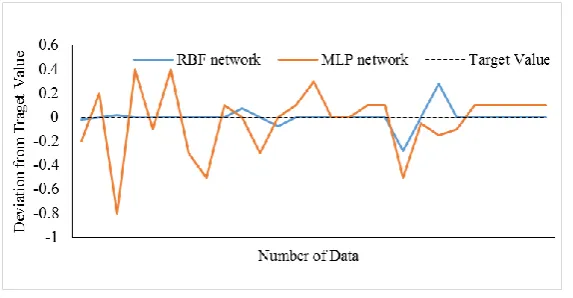
According to Fig. 5.a, the predicted values of RBF network are following
target values well and have less deviation and error from the target value, but
predicted values of MLP network (Fig. 5.b) have a large error and deviation
from target values and has lower compliance with target values compared to
RBF network.
Based on the results of Fig. 6 and according to the description mentioned
about correlation coefficient, it can be said that the output values of RBF
net-work have 99.6% of linearship and the output values of MLP netnet-work have
96% linearship with target values. To display these results as a statistical factor,
parameters that were mentioned in Material and methods. The obtained results
were tabulated in Table 4.
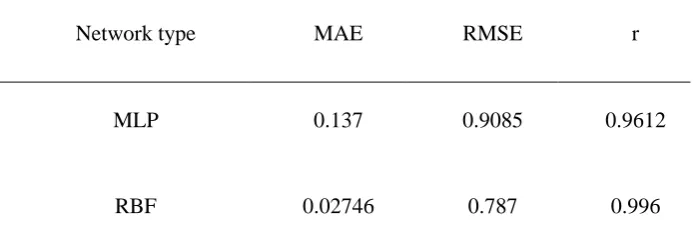
Table 4. the results of comparison parameter for two types of networks
r RMSE
MAE Network type
0.9612 0.9085
0.137 MLP
0.996 0.787
0.02746 RBF
According table 4, the results of comparison parameters indicate that the
re-sults of RBF network have high correlation coefficient (0.996) and low RMSE
and MAE values (0.787 and 0.02746, respectively) compared to MLP network.
Due to the high correlation coefficient for RBF network (0.996), It can be said
that process modeling, compliance and linear correlation predicted by the RBF
network is higher than MLP network that is confirming the obtained results
from Figure 5 and Figure 6.
On the other hand, RBF network with the lowest root mean square error
(0.787) and the lowest mean absolute error (0.02746) generated closest
pre-dicted values with minimal errors compared to the MLP neural network and it
can be said that RBF has high ability to model the temperature variations
com-pared to MLP network in this study. Therefore the designed model based on
RBF is predicting the temperature value more accurate with low deviation to
Faizollahzadeh et al[42] developed a fuzzy modeling system in order to
pre-dict the temperature of the mushroom growing hall that the correlation
coeffi-cient and mean absolute error between the predicted and target values were
cal-culated 0.67 and 0.232, respectively. The present study indicates the
improve-ments in the prediction of temperature variations using artificial neural
net-works. One of the reasons that led to this happening, is that the fuzzy systems
unlike the artificial neural networks, is operating by the defined laws. These
rules can be affected by the accuracy of laws defining and can have a negative
effect on system precision.
Figure 7 presents the error values for the predicted values of each network
from the desired values. The zero value of deviation is related to the Target
value. The blue line indicates the deviations related to RBF network and the red
line indicates the deviations related to MLP network. Based on Fig. 7, MLP
network has the maximum deviation from the target value.
According to figure 7, if the output of networks is compared in the same
input values, it can be said that the deviation of temperature from target values
in RBF network is higher than MLP network. This means that the energy losses
of MLP network are higher than RBF network. This energy losses on MLP
network can be reduced by the changes that can be applied in network inputs.
This losses of energy is equal to increasing the failure risk of the system on
MLP model compared to RBF model.
4 Conclusion
This study is performed in a mushroom growing hall with the aim of
model-ing of temperature variations. Accordmodel-ingly, modelmodel-ing systems includmodel-ing MLP
and RBF networks was used. The results of the data collecting process reflected
the dependence of temperature value to independent variables. Therefore
re-sults were prepared after the modelling process and extracting the output values
of networks and comparing them with target values. This results showed that
the RBF network has high accuracy and better performance compared to MLP
network and also using RBS network will reduce energy consumption, system
failure, and costs. Thus, the neural network with radial basis function was
cho-sen as a predictive network of hall temperature in this study. For the future
works, more sophisticated machine learning methods must come to
considera-tion, e.g., [42-52].
Acknowledgments
This publication has been supported by the Project: "Support of research and
and creative industry" of the Research & Innovation Operational Programme
(ITMS code: NFP313010T504) co-funded by the European Regional
Develop-ment Fund.
References
1. Faizollahzadeh_Ardabili, S., Simulation and Comparison of Control
System in Mushroom Growing Rooms Environment. Thesis of Master
science. Department of mechanic of agricultural machinery
engineering. University of Tabriz. Tabriz, Iran., 2014.
2. Kurashige, S., Y. Akuzawa, and F. Endo, Effects of Lentinus edodes,
Grifola frondosa and Pleurotus ostreatus administration on cancer
outbreak, and activities of macrophages and lymphocytes in mice
treated with a carcinogen, N-butyl-N-butanolnitrosoamine.
Immunopharmacology and immunotoxicology, 1997. 19(2): p. 175-183.
3. Zhang, H., et al., Flammulin Purified from the Fruit Bodies of
Flammulina velutipes (Curt.: Fr.) P. Karst. International Journal of
Medicinal Mushrooms, 1999. 1(1).
4. Faizollahzadeh_Ardabili, et al., Modeling and comparison of fuzzy and
on/off controller in a mushroom growing hall. Measurement, 2016. 90:
5. Fang, Y., J. Fei, and K. Ma, Model reference adaptive sliding mode
control using RBF neural network for active power filter. International
Journal of Electrical Power & Energy Systems, 2015. 73: p. 249-258.
6. Faizollahzadeh_Ardabili, A. Mahmoudi, and T. Mesri Gundoshmian,
Modeling and simulation controlling system of HVAC using fuzzy and
predictive (radial basis function ,RBF) controllers. Journal of Building
Engineering, 2016. 6: p. 301–308.
7. Aram, F., et al., Design and validation of a computational program for
analysing mental maps: Aram mental map analyzer. Sustainability
(Switzerland), 2019. 11(14).
8. Asadi, E., et al., Groundwater Quality Assessment for Drinking and
Agricultural Purposes in Tabriz Aquifer, Iran. 2019.
9. Asghar, M.Z.; Subhan, F.; Imran, M.; Kundi, F.M.; Shamshirband, S.;
Mosavi, A.; Csiba, P.; R. Várkonyi-Kóczy, A. Performance Evaluation
of Supervised Machine Learning Techniques for Efficient Detection of
Emotions from Online Content. Pre-prints 2019, 2019080019 (doi:
10.20944/preprints201908.0019.v1).
10. Bemani, A.; Baghban, A.; Shamshirband, S.; Mosavi, A.; Csiba, P.;
Várkonyi-Kóczy, A.R. Applying ANN, ANFIS, and LSSVM Models
for Estimation of Acid Sol-vent Solubility in Supercritical CO2.
Preprints 2019, 2019060055 (doi: 10.20944/preprints201906.0055.v2).
11. Choubin, B., et al., Snow avalanche hazard prediction using machine
12. Choubin, B., et al., An ensemble prediction of flood susceptibility using
multivariate discriminant analysis, classification and regression trees,
and support vector machines. Science of the Total Environment, 2019.
651: p. 2087-2096.
13. Dehghani, M., et al., Prediction of hydropower generation using Grey
wolf optimization adaptive neuro-fuzzy inference system. Energies,
2019. 12(2).
14. Dineva, A., et al., Review of soft computing models in design and
control of rotating electrical machines. Energies, 2019. 12(6).
15. Dineva, A., et al., Multi-Label Classification for Fault Diagnosis of
Rotating Electrical Machines. 2019.
16. Farzaneh-Gord, M., et al., Numerical simulation of pressure pulsation
effects of a snubber in a CNG station for increasing measurement
accuracy. Engineering Applications of Computational Fluid
Mechanics, 2019. 13(1): p. 642-663.
17. Ghalandari, M., et al., Investigation of submerged structures’ flexibility
on sloshing frequency using a boundary element method and finite
element analysis. Engineering Applications of Computational Fluid
Mechanics, 2019. 13(1): p. 519-528.
18. Ghalandari, M., et al., Flutter speed estimation using presented
differential quadrature method formulation. Engineering Applications
of Computational Fluid Mechanics, 2019. 13(1): p. 804-810.
19. Karballaeezadeh, N., et al., Prediction of remaining service life of
Semnan–Firuzkuh road). Engineering Applications of Computational
Fluid Mechanics, 2019. 13(1): p. 188-198.
20. Menad, N.A., et al., Modeling temperature dependency of oil - water
relative permeability in thermal enhanced oil recovery processes using
group method of data handling and gene expression programming.
Engineering Applications of Computational Fluid Mechanics, 2019.
13(1): p. 724-743.
21. Mohammadzadeh, S., et al., Prediction of Compression Index of
Fine-Grained Soils Using a Gene Expression Programming Model.
Infrastructures, 2019. 4(2): p. 26.
22. Mosavi, A. and M. Edalatifar, A Hybrid Neuro-Fuzzy Algorithm for
Prediction of Reference Evapotranspiration, in Lecture Notes in
Networks and Systems. 2019, Springer. p. 235-243.
23. Mosavi, A., A. Lopez, and A.R. Varkonyi-Koczy, Industrial
applications of big data: State of the art survey, D. Luca, L. Sirghi, and
C. Costin, Editors. 2018, Springer Verlag. p. 225-232.
24. Mosavi, A., P. Ozturk, and K.W. Chau, Flood prediction using
machine learning models: Literature review. Water (Switzerland),
2018. 10(11).
25. Mosavi, A. and T. Rabczuk, Learning and intelligent optimization for
material design innovation, D.E. Kvasov, et al., Editors. 2017, Springer
26. Mosavi, A., T. Rabczuk, and A.R. Varkonyi-Koczy, Reviewing the
novel machine learning tools for materials design, D. Luca, L. Sirghi,
and C. Costin, Editors. 2018, Springer Verlag. p. 50-58.
27. Mosavi, A., et al., State of the art of machine learning models in energy
systems, a systematic review. Energies, 2019. 12(7).
28. Mosavi, A., et al., Prediction of multi-inputs bubble column reactor
using a novel hybrid model of computational fluid dynamics and
machine learning. Engineering Applications of Computational Fluid
Mechanics, 2019. 13(1): p. 482-492.
29. Mosavi, A. and A.R. Varkonyi-Koczy, Integration of machine learning
and optimization for robot learning, R. Jablonski and R. Szewczyk,
Editors. 2017, Springer Verlag. p. 349-355.
30. Nosratabadi, S., et al., Sustainable business models: A review.
Sustainability (Switzerland), 2019. 11(6).
31. Qasem, S.N., et al., Estimating daily dew point temperature using
machine learning algorithms. Water (Switzerland), 2019. 11(3).
32. Rezakazemi, M., A. Mosavi, and S. Shirazian, ANFIS pattern for
molecular membranes separation optimization. Journal of Molecular
Liquids, 2019. 274: p. 470-476.
33. Riahi-Madvar, H., et al., Comparative analysis of soft computing
techniques RBF, MLP, and ANFIS with MLR and MNLR for predicting
grade-control scour hole geometry. Engineering Applications of
34. Shabani, S.; Samadianfard, S.; Taghi Sattari, M.; Shamshirband, S.;
Mosavi, A.; Kmet, T.; R. Várkonyi-Kóczy, A. Modeling Daily Pan
Evaporation in Humid Cli-mates Using Gaussian Process Regression.
Preprints 2019, 2019070351 (doi: 10.20944/preprints201907.0351.v1).
35. Shamshirband, S.; Hadipoor, M.; Baghban, A.; Mosavi, A.; Bukor J.;
Annamaria R. Varkonyi-Koczy, Developing an ANFIS-PSO Model to
predict mercury emissions in Combustion Flue Gases. Preprints 2019,
2019070165 (doi: 10.20944/preprints201907.0165.v1).
36. Shamshirband, S., et al., Ensemble models with uncertainty analysis for
multi-day ahead forecasting of chlorophyll a concentration in coastal
waters. Engineering Applications of Computational Fluid Mechanics,
2019. 13(1): p. 91-101.
37. Shamshirband, S., A. Mosavi, and T. Rabczuk, Particle swarm
optimization model to predict scour depth around bridge pier. arXiv
preprint arXiv:1906.08863, 2019.
38. Taherei Ghazvinei, P., et al., Sugarcane growth prediction based on
meteorological parameters using extreme learning machine and
artificial neural network. Engineering Applications of Computational
Fluid Mechanics, 2018. 12(1): p. 738-749.
39. Torabi, M., et al., A Hybrid clustering and classification technique for
forecasting short-term energy consumption. Environmental Progress
and Sustainable Energy, 2019. 38(1): p. 66-76.
40. Torabi, M., et al., A Hybrid Machine Learning Approach for Daily
Prediction of Solar Radiation, in Lecture Notes in Networks and
41. Gundoshmian, T.M., et al., Application of artificial neural network in
prediction of the combine harvester performance. J Food Agric
Environ, 2010. 8(2): p. 721-724.
42. Faizollahzadeh Ardabili, S., A. Mahmoudi, and T. Mesri
Gundoshmian, Modeling of controlling system on temperature
controlling of mushroom growing halls, in Ninth National Congress of
biosystem engineering and mechanization. 2015: Karaj, Iran.
43. Ardabili, S., Mosavi, A., Mahmoudi, Mesri Gundoshmian, T,
Nosratabadi, S., Var-konyi-Koczy, A., Modelling temperature
variation of mushroom growing hall us-ing artificial neural networks,
Preprints 2019.
44. Mesri Gundoshmian, T., Ardabili, S., Mosavi, A., Varkonyi-Koczy, A.,
Prediction of combine harvester performance using hybrid machine
learning modeling and re-sponse surface methodology, Preprints 2019.
45. Ardabili, S., Mosavi, A., Varkonyi-Koczy, A., Systematic review of
deep learning and machine learning models in biofuels research,
Preprints 2019.
46. Ardabili, S., Mosavi, A., Varkonyi-Koczy, A., Advances in machine
learning model-ing reviewing hybrid and ensemble methods, Preprints
2019.
47. Ardabili, S., Mosavi, A., Varkonyi-Koczy, A., Building Energy
information: demand and consumption prediction with Machine
48. Ardabili, S., Mosavi, A., Dehghani, M., Varkonyi-Koczy, A., Deep
learning and machine learning in hydrological processes climate
change and earth systems a systematic review, Preprints 2019.
49. Mohammadzadeh D., Karballaeezadeh, N., Mohemmi, M., Mosavi, A.,
Varkonyi-Koczy A., Urban Train Soil-Structure Interaction Modeling
and Analysis, Preprints 2019.
50. Mosavi, A., Ardabili, S., Varkonyi-Koczy, A., List of deep learning
models, Preprints 2019.
51. Nosratabadi, S., Mosavi, A., Keivani, R., Ardabili, S., Aram, F., State
of the art sur-vey of deep learning and machine learning models for
smart cities and urban sustainability, Preprints 2019.
52. Perez, H.; Tah, J.H.M.; Mosavi, A. Deep Learning for Detecting
Building Defects Using Convolutional Neural Networks. Sensors 2019,