Article
A Model of extracting building from high
resolution remote sensing image based on
Bayesian Convolutional Neural Networks
Xiaoxia Yang 1,2, Chengming Zhang 1,2,*, Shuai Gao 3,*, Fan Yu 4, Dejuan Song 1,2, Qingdi Wei 1,2, Yan Chen 1,2, Shouyi Wang 1,2
1 College of Information Science and Engineering, ShanDong Agricultural University;
2 Shandong Technology and Engineering Center for Digital Agriculture, ShanDong Agricultural
University; [email protected].
3 Institute of Remote Sensing Application Chinese Academy of Sciences;[email protected].
4 Chinese Academy of Serveying and Mapping;[email protected].
* Correspondence: [email protected]; Tel.: +86-139-538-23659
Abstract: When extract building from high resolution remote sensing image with meter/sub-meter accuracy, the shade of trees and interference of roads are the main factors of reducing the extraction accuracy. Proposed a Bayesian Convolutional Neural Networks(BCNET) model base on standard fully convolutional networks(FCN) to solve these problems. First take building with no shade or artificial removal of shade as Sample-A, woodland as Sample-B, road as Sample-C. Set up 3 sample libraries. Learn these sample libraries respectively, get their own set of feature vector; Mixture Gauss model these feature vector set, evaluate the conditional probability density function of mixture of noise object and roofs; Improve the standard FCN from the 2 aspect:(1) Introduce atrous convolution. (2) Take conditional probability density function as the activation function of the last convolution. Carry out experiment using unmanned aerial vehicle(UVA) image, the results show that BCNET model can effectively eliminate the influence of trees and roads, the building extraction accuracy can reach 97%.
Keywords: High resolution remote sensing image; Convolutional Neural Networks; Full Convolution Networks; Bayesian Convolutional Neural Networks; building extraction; conditional probability density function.
1.Introduce
It is of great significance to obtain the detailed distribution map of urban buildings in the social management and development plan. High resolution remote sensing images contain lots of object features, including color, size, shape, texture and layout of the relationship between objects, which makes it possible to accurately extract buildings from high resolution remote sensing images [1]. The absence of low-cost high resolution multi spectral image with meter/sub-meter accuracy provided reliable source of data for the building extraction. In remote sensing image, the outline of the building is characterized mainly by the shape and distribution of the roof [2]. Because the material, color, shape, size and orientation of the roofs are diverse, and some of the roofs even shaded by trees or other tall buildings, which makes it difficult to extract building from high resolution multi spectral remote sensing image.
Because the urban environment is complicated, the spatial pattern of buildings is relatively complex, object has high spectral variability in remote sensing image. The
phenomenon of different objects with the same spectrum and the
same objects with different spectrum is common in the urban remote sensing image. Thus it is difficult for auto/semi-auto classification base on pixel spectral signature [3]. Studies have shown that although the 4 multi spectral bands of high resolution remote sensing image can be able to distinguish the land cover types of town's water, bare soil, vegetation, shadow and impervious ground [4,5]. But only with these low level spectral statistical characteristics, it is hard to extract road, parking and building from impervious ground [6]. In recent years, methods combining spatial and spectral analysis have been put forward. It is considered that spatial characteristics are complementary information with spectral characteristics [7]. We can extract building by the use of structural information, context information and spectral information [2,8,9]. Meanwhile, the object oriented analysis method based on segmentation is also applied, [10,11] proposed a integration method based on Support Vector Machine (SVM), which combines object oriented and pixel based methods to classify urban objects. [12] use improved classification of pixel level and object level remote sensing images to distinguish different objects. In view of the special form of urban objects, people also put forward some spatial characteristics calculation methods, such as pixel shape index (PSI) [13], morphological sequence [14-17], and multiscale urban complexity index(MUCI) based on wavelet texture [14,15]. In order to enhance the efficiency of automatic extraction of buildings, some new methods have been proposed [17-21]. The main problems existing in these algorithms are the extraction mainly based on low-level features or feature combinations, which makes it difficult for the sheltered buildings to be extracted completely [22].
With the in-depth study of deep learning, the role of Convolutional Neural Networks (CNN) in image understanding is gradually paid attention to. CNN is a deep neural network based on convolution operation. Convolution structure can reduce the amount of memory occupied by deep network, and also reduce the number of network parameters, alleviate the over fitting problem of the model. In 2012, Krizhevskywin the ImageNet competition image classification task by the use of a CNN called AlexNet [23], which illustrate the prominent advantage of CNN in image understanding [24-31]. Especially since Zeiler [32] put forward the deconvolution network model, people subsequently developed FCN [33-35], UNET [36,37], Deeplab [38,39], which greatly improved the accuracy of image segmentation.
Due to the existing CNN based image segmentation model belongs to supervised learning model, sample quality determines the model quality. So in order to improve the extraction ability of the model, the sample used in the model training process always the building with complete outer shape. These models are poor in extraction building with shade. Through in-depth analysis of the model structure and the forward propagation process, found the root cause of the above problems is that the forward propagation of standard CNN has not considered the impact of low-layer noise on the high-layer features.
The paper propose an improved CNN, called Bayesian Convolutional Neural Networks (BCNET , to improve the extraction ability of buildings with shade. The main works are:
)
(1) Respectively learn the 3 sample set of building, woodland, road using a 5 layers CNN, get their own set of feature vector.
(2) Mixture Gauss model these feature vector set, evaluate the conditional probability density function of mixture of noise object and roofs.
(3) Improve the standard FCN from the 2 aspect: Introduce atrous convolution; Take conditional probability density function as the activation function of the last convolution.
2. Method
2.1 Basic structure of FCN
The power of CNN lies in its multilayer structure can automatically learn the features, and can learn features of multiple levels: the domain of low convolution layer is small, can learn some features of local area; the domain of high convolution layer is large, can learn some abstract features. These abstract features are less sensitive to the size, location, and direction of the object, which helps to improve the recognition performance. But because of the loss of details, they cannot get the specific outline of objects.
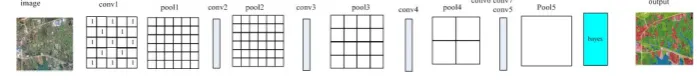
Jonathan Long et.al [33] proposed FCN to solve this problem. FCN transforms the full connection layer in the standard CNN into convolution layers. FCN can restore the category of each pixel from the abstract features, which means further extended from the classification of the image level to the classification of the pixel level. Figure 1 illustrate the structure of FCN.
Figure 1. The Structure of FCN
2.2 Analyse of FCN
FCN use standard convolution, in this way the feature of higher level is the aggregation and abstraction of the lower level features. As the layers of convolution increase, the domain is getting larger and larger, so the effect of a noise pixel block on the high layer features must be smaller and smaller (Figure 2). This is consistent with the way of observation of the real world, when we are close with the observed object, we can get the details, otherwise, the details are less influence.
Figure 2. The influence of a noise pixel block on the high layer feature
The impact of a noise pixel block on high layer feature is not only related to size, but also related to location. When the noise block is in the middle of the object, as the domain becomes larger, the number of positive sample pixels is increasing, and the proportion of noise will be reduced rapidly. But when the noise block is at the edge of the object, as the domain becomes larger, positive sample pixels and noisy pixels increase together, and the proportion of noise will be reduced slowly.
2.3 BCNET Model
First quantitative analysis the impact of pixel size on different layers of abstract features. Then improved standard FCN from the following 2 aspects: (1) Introduce new convolution method to reduce the effect of noise on the features (2) Take the quantitative analysis results as a priori knowledge, introduce the idea of probability judgment, construct new activation function, improve the accuracy of pixel classification. Through the above improvement, the BCNET model that can be used to extract shaded buildings is established. Figure 3 illustrate the structure of BCNET.
Figure 3.The structure of BCNET
2.3.1 Atrous convolution
The repeated combination of pooling and striding at consecutive layers significantly reduces the spatial resolution of the resulting feature image. For high resolution remote sensing image classification tasks, such operations lead to a serious loss of spatial information. Liang-Chieh Chen et al. [40], inspired by the Wavelet Transform, proposed the "atrous" convolution for generating dense feature maps. Compared with the standard convolution, the atrous convolution generates a high resolution feature map, while keeping the size of receptive field. Besides, there is no extra parameter involved.
2.3.2 Design of activation function
When the building is shaded by trees or other tall buildings, the pixels of shaded part are hard to classify, which reduce the extraction accuracy. Proposed a judgment method based on Bayesian, transform the pixel judgment problem to the maximum posterior probability estimation problem, improve the extraction accuracy of the shaded part.
We will establish a judgment method based on the Bayesian, in order to transform the pixel judgment problem to the maximum posterior probability estimation problem, and improve the accuracy of the partial pixel class attribution. The transformation steps are as follows:
1. In the urban image, trees are the main objects that shade the buildings, and the roads are close to the top of the roof in the spectrum and texture. They are easily confused, and are the main sources of noise. So take building with no shade or artificial removal of shade as Sample-A, woodland as Sample-B, road as Sample-C. Take Sample-A as positive sample, Sample-B and Sample-C as noise, train the model.
2. Respectively learn the 3 sample set of building, woodland, road using a 5 layers CNN, get their own set of feature vector.
3. Mixture Gauss model these feature vector set, evaluate the conditional probability density function of mixture of noise object and roofs. Due to the density function of Gauss's mixed distribution can approximate any continuous probability density function with a finite break point, so we can assume that conditional probability density distribution of feature vector set conforms to the Gauss distribution. Set number of mixed components is r, and its probability density model can be expressed as:
p(x|ω) = ∑ z f (x) (1)
In which, zi is weight factor of the ith Gauss distribution component, and satisfy the
∑ z = 1 and z > 0 (2)
fi(x) is the density function of the ith Gauss component, ui is the mean vector, Ʃi is the
covariance matrix, d is the dimension of the feature vector x. The parameters of the mixed Gauss probability density model can be calculated by EM algorithm. ω indicate that this pixel is a class of noise, x indicate that this pixel is a class of building roof. Take the probability density function as activation function.
3.Experimental results and analysis
As the shortage of FCN in extracting urban building from high resolution remote sensing image with meter\sub-meter accuracy. The main target of BCNET is to solve the problem of shelter of tree and road, to improve the accuracy of extraction. In this section carry out experiment to validate the performance of BCNET.
3.1 Experiment scheme
Around the experimental target, this section expounds the experimental scheme from the aspects of data source selection, sample mark, test case and so on.
3.1.1 Data source selection
The experiment site are selected in Zhangqiu city of Shandong Province Mingshui town, there is a certain interval between different residents. The buildings in the residential area are mostly flat or two storeys buildings, as a result of the implementation of the unified planning of villages and towns, the structure of the building is basically unified. This experiment site has lots of big trees, these big trees have a different coverage of the house. Some buildings are shaded only at the edge, and some of the shaded percentage is up to 30%. The road of the experiment site is hardened road, which is basically the same as the material of the urban road. We got 17 images from the UAV (2017.5.14-2017.6.10), take 2 of them as test data of BCNET, the rest as samples.
Besides UAV images, we also obtained 4 GF2 remote sensing images and 1 GF1 remote sensing images of the same period. The spatial resolution of GF2 panchromatic band is 0.8m, and the spatial resolution of GF1 optical image is 2 meters.
3.1.2 Sample labeling
The sample labeling is the key step of the model operation, and the quality of the label determines the effect of the test directly. Unlike other sample labeling method, we use JX5 photogrammetry software. JX5 can auto or semi auto extract linear features such as roads, buildings, waters. Combined with manual operation, subtle information at the corner can be accurately depicted. Then the extracted vector data is converted into grid data by GIS software to form a label.
The UAV image can be labeled directly. For GF images, first use ENVI to fuse the total color band of GF2 and the RGB band of GF1, obtain the remote sensing image of 0.8m spatial resolution, then label the fused image. The labeled categories are mainly: building, road, woodland, farmland. For the shaded building, after the process of JX5, use the station survey
2 ) ( ) ( 2 1 2 d i
)
2
(
1
)
x
(
f
i Ti i x u
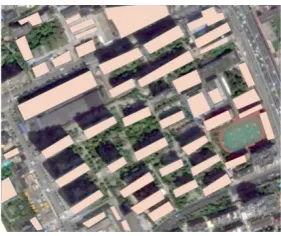
data to complete the outer shape of the building, get the label. Then use PS, render the shaded part. Figure 4 shows a labeled image.
Figure 4. A labeled sample
3.1.3 Testing Samples
One of the image for testing is shown in Figure 5. In this testing sample, there are road, building, farmland, tree. Some of the building are shaded, the biggest shaded area reaches 30%.
Figure 5. One of the image for testing
3.2 Experiment Result
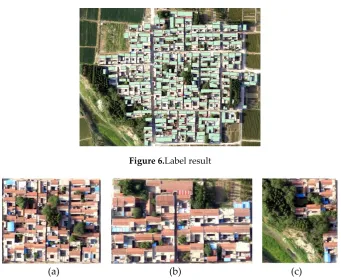
Figure 6.Label result
(a) (b) (c)
Figure 7. The original figure of the 3 selected regions
(a) (b) (c)
Figure 8. The labeled result of the 3 selected regions
(a) (b)
Figure 9. Another testing image: (a) The original image. (b) Labeled result. A section of road marked in the red rectangle is wrongly labeled as a building
+FN). Branch factor and missing factor are mainly related to the performance of the boundary description of the building extraction. Table 1 illustrate the performance evaluation of BCNET.
Table 1. Performance evaluation of BCNE
BCNET Standard FCN
Branch factor 0.25 0.37
Missing factor 0.11 0.53
Integrity 73.3% 52.8%
Extraction rate 90.1% 65.5%
3.3 Result analyse
The goal of the BCNET is to eliminate the effects of trees and roads on the extraction of buildings, and to improve the accuracy of the building extraction. This section analyzes the reasons why BCNET can improve the accuracy of extraction, and points out problems that the BCNET has not solved.
3.3.1 The influence of trees
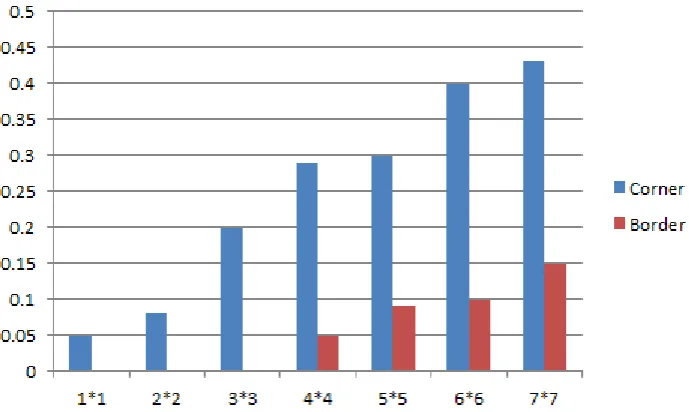
Trees may shade the building roof, which makes the edge of the building incomplete. The effect of the noise block on the extraction precision depends mainly on 2 factors: (1) The relative position of the noise block and the building. (2) The size of the noise block. In these 2 factors, the relative position of the noise block and the building is the leading factor. Figure 10 shows the influence degree of the 2 factors on building extraction. In Figure 10, the vertical axis indicates the degree of influence, cross axis representation block size, blue bar represents the noise block in the corner, red ones represents the noise block on the border.
Figure 10. The influence degree of the 2 factors on building extraction
3.3.2 The influence of road
The spectral characteristics of the hardened rode are similar to those of the building roof. Except spectral signature, BCNET also introduce spatial and abstract features. Especially the introduction of the atrous convolution can quickly enlarge the domain. Because the road is narrower than the building roof, when the domain become larger, the road blocks will be mixed into other categories earlier. Therefore, the feature value of the road is easily different from that of the roof, which increases the separability of these two object. At the same time, BCNET adopt probability density function as activation function, which further improve the accuracy of extraction.
4. Conclusion
Extraction building from high resolution remote sensing image is a difficult problem to be solved. Aim at the problem that the trees (or other tall building) and road may reduce the extraction accuracy, based on standard FCN, propose BCNET to solve the problem. But BCNET still has shortcomings, for example, how to get the best value of the parameters of network. In addition, when the shaded lies in the corner, the extraction accuracy of BCNET is not ideal. In further study, we need improve convolution way considering the position of noise block.
Acknowledgments: The work was supported by the project of National Key R&D Program of China (2017YFA0603004), the National Science Foundation of China (41471299,41671440), Science Foundation of Shandong (ZR2017MD018, ZR2016DP01), Open research project of Key Laboratory on meteorological disaster monitoring, early warning and risk management in characteristic agricultural areas of arid area (CAMF-201701).
References
1.
Hu Rongming; HUANG Xiaobing; HUANG Yuancheng. An Enhanced Morphological BuildingIndex for Building Extraction from High-resolution Images. Acta Geodaetica et Cartographica
Sinica2014, 43(5), 514-520.
2.
TAN Qulin. Urban Building Extraction from VHR Multi-spectral Images Using Object-basedClassification. Acta Geodaetica et Cartographica Sinica2010, 39(6), 618-626.
3. DAVIS .C.H; WANG.X.Y. Urban Land Cover Classification from High Resolution Multi-spectral
IKONOS Imagery. IEEE International Geoscience & Remote Sensing Symposium 2002, 2(2), 1204-1206.
4.
HEROLD.M; GARDNE R.M; ROBERTS.D. Spectral Resolution Requirement for Mapping UrbanAreas. IEEE Transactions on Geoscience and Remote Sensing2003, 41(9), 1907-1919.
5. FRAUMAN. E; WOLFF. E. Segmentation of Very High Spatial Resolution Satellite Images in Urban
Areas for Segments-based Classification. Proceedings of the 3rd International Symposium Remote Sensing
and Data Fusion over Urban Areas2005, 3, 24-27.
6. BAUER.T; STEINNOCHER.K. Per-parcel Land Use Classification in Urban Areas Applying a
Rule-based Technique. Geo-Information System 2001, 6, 28-33.
7. Fauvel.M; Tarabalka.Y; Bennediktsson.J.A et al. Advances in Spectral-spatial Classification of
Hyperspectral Images. Proceeding of IEEE2013, 101(3), 652-675.
8. JIN.X; DAVIS.D.H. Automated Building Extraction from High-resolution Satellite Imagery in Urban
Processing2005, 2005(14), 2196-2206.
9. LEE.D.S; SHAN.J; BETHEL.J.S. Class-guided Building Extraction from lkonos Imagery.
Photogrammetric Engineering and Remote Sensing2003, 69(2), 143-150.
10. HUANG.X; ZHANG.L. An SVM Ensemble Approach Combining Spectral, Structural, and Semantic
Features for the Classification of High-resolution Remotely Sensed Imagery. IEEE Transactions on
Geoscience and Remote Sensing2013, 51(1), 257-272.
11. HUANG.X; ZHANG.L. An Adaptive Mean-shift Analysis Approach for Object Extraction and
Classification from Urban Hyperspectral Imagery. IEEE Transactions on Geoscience and Remote Sensing
2008, 46(12), 4173-4185.
12. LI Gang; WAN Youchuan. Synthesis Classification of Remote Sensing Image Based on Improved
Pixel-level and Object-level Methods. Acta Geodaetica et Cartographica Sinica2012, 41(6), 891-897.
13. HUANG.X; ZHANG.L; LI.P. Classification and Extraction of Spatial Features in Urban Areas Using
High Resolution Multispectral Imagery. IEEE Geoscience Remote Sensing Letter2007, 4(2), 260-264.
14. FAUVEL.M; BENEDIKTSSON.J.A; CHANUSSOT.J et al. Spectral and Spatial Classification of
Hyperspectral Data Using SVMs and Morphological Profiles. IEEE Transactions on Geoscience and
Remote Sensing2008, 46(11), 3804-3814.
15. HUANG.X; ZHANG.L.A Multiscale Urban Complexity Index Based on 3D Wavelet Transform for
Spectral-spatial Feature Extraction and Classification: An Evaluation on the 8-channel Worldview-2
Imagery. International Journal of Remote Sensing2012, 33(8), 2614-2656.
16. OUMA.Y.O; NGIGI.T.G; TATEISHI.R. On the Optimization and Selection of Wavelet Texture for
Feature Extraction from High-resolution Satellite Imagery with Application towards Urban: Tree
Delineation. International Journal of Remote Sensing2006, 27(1), 73-104.
17. LHOMME.S; HE.D.C; WEBER.C et al. A New Approach to Building Identification from
Very-high-spatial Resolution Images. International Journal of Remote Sensing2009, 30(5), 1341-1354.
18. PEAARESI.M; GERHARDINGER.A; KAYITAKIRE.F. A Robust Built-up Area Presence Index by
Anisotropic Rotation-invariant Textural Measure. IEEE Journal of Selected Topics in Applied Earth
Observation and Remote Sensing2008, 1(3), 180-192.
19. HUANG.X; ZHANG.L.A Multidirectional and Multiscale Morphological Index for Automatic
Building Extraction from Multispectral GeoEys-1 Imagery. Photogrammetric Engineering and Remote
Sensing2011, 77(7), 721-732.
20. LU.D; HETRCK.S; MORAN.E. Impervious Surface Mapping with QuickBird Imagery. International
Journal of Remote Sensing2011, 32(9), 2519-2533.
21. WU.C; MURRAY.A.T. Estimating Impervious Surface Distribution by Spectral Mixture Analysis.
Remote Sensing of Environment2003, 84(4), 483-505.
22. HE Xiaofei; ZOU Zhengrong; TAO Chao et al. Combine dsaliency with multi-convolutional neural
network for high resolution remote sensing scene classification .Acta Geodaetica et Cartographica
23. Krizhevsky.A; Sutskever.I; Hinton.G.E. ImageNet classification with deep convolutional neural
networks. Proceedings of Advances in Neural Information Processing Systems 25 2012, 5(3), 1097-1105
24. Girshick.R; Donahue.J; Darrell.T; Malik.J. Rich feature hierarchies for accurate object detection and
semantic segmentation. Proceedings of the 2014 IEEE Conference on Computer Vision and Pattern
Recognition2014, 4(2),5 80-587
25. He.K.M; Zhang.X.Y; Ren.S.Q; Sun.J. Spatial pyramid pooling in deep convolutional networks for
visual recognition. IEEE Transactions on Pattern Analysis and Machine Intelligence2015, 37(9),
1904-1916.
26. Szegedy.C; Liu.W; Jia.Y.Q; Sermanet.P; Reed.S; Anguelov.D; Erhan.D; Vanhouc.V; Rabinovich.A.
Going deeper with convolutions. Proceedings of the 2015 IEEE Conference on Computer Vision and
Pattern Recognition2015, 1-9.
27. Simonyan.K; Zisserman.A. Very deep convolutional networks for large-scale image recognition
2016,http://arxiv.org/abs/1409.1556.
28. He.K.M; Zhang.X.Y; Ren.S.Q; Sun.J. Deep residual learning for image recognition 2016,
http://arxiv.org/abs/1512.03385.
29. Stankov.K; He.D.C. Detection of buildings in multispectral very high spatial resolution images using
the percentage occupancy hit-or-miss transform. IEEE J. Sel. Top. Appl. Earth Obs. Remote Sens. 2014, 7,
4069–4080.
30. Ok.A.O; Baseski.E. Circular oil tank detection from panchromatic satellite images: A new automated
approach. IEEE Geosci. Remote Sens. Lett. 2015,12,1347–1351.
31. Haoning Lin; Zhenwei Shi; Zhengxia Zou. Maritime Semantic Labeling of Optical Remote Sensing
Images with Multi-Scale Fully Convolutional Network. Remote Sens. 2017, 9, 480, 10.3390/rs9050480
32. Zeiler.M.D; Krishnan.D; Taylor.G.W et al. Deconvolutional networks. Proceedings of the IEEE
Conference on Computer Vision and Pattern Recognition2010, 6(2), 2528-2535.
33. Jonathan Long, Evan Shelhamer, Trevor Darrell; Fully Convolutional Networks for Semantic Segmentation.The IEEE Conference on Computer Vision and Pattern Recognition (CVPR) 2015
,3431-3440
34. Bertinetto.L; Valmadre.J; Henriques.J.F; VedaldiA; TorrP.H.S. Fully-Convolutional Siamese Networks for Object Tracking. Lecture Notes in Computer Science2016, 9914, 850-865.
35. Shelhamer.E; Long.J; Darrell.T. Fully Convolutional Networks for Semantic Segmentation. IEEE Transactions on Pattern Analysis & Machine Intelligence2014, 39(4), 640-651.
36. Ronneberger.O; Fischer.P; Brox.T. U-Net: Convolutional Networks for Biomedical Image
Segmentation. International Conference on Medical Image Computing and Computer-Assisted Intervention
2015, 234–241.
37. Ronneberger .O; Fischer.P;Brox.T; U-Net: Convolutional Networks for Biomedical Image
Segmentation. Springer International Publishing2015, 9351, 234-241.
38. Chen. L.C; Papandreou.G; Kokkinos.I; Merphy.K; Yuille.A.L. DeepLab: Semantic Image
Transactions on Pattern Analysis & Machine Intelligence 2016, 99, 1-1.
39. Liang-Chieh Chen; Yi Yang;Jiang Wang; Wei Xu;Alan L. Yuille. Attention to Scale: Scale-Aware
Semantic Image Segmentation. The IEEE Conference on Computer Vision and Pattern Recognition2016,
3640-3649.
40. Chen, L.C; Kokkinos, I; Murphy, K; Yuille, A.L. Semantic Image Segmentation with Deep
Convolutional Nets and Fully Connected CRFs. In Proceedings of the International Conference on
Learning Representations2015, 7–9.
41. TAO Chao; TAN Yihua; CAI Huajie; DU Bo; TIAN Jinwen. Object-oriented Method of Hierarchical
Urban Building Extraction from High-resolution Remote-Sensing Imagery. Acta Geodaetic et