Article
Airflow sensitivity assessment based on the
underground mine ventilation systems modeling
Wacław Dziurzyński*, Andrzej Krach and Teresa Pałka
Strata Mechanics Institute of the Polish Academy of Sciences, 27 Reymonta Street, 30-059 Krakow, Poland
* Correspondence: [email protected]
Abstract: This paper presents a methodology for determining the sensitivity of the main air flow directions in ventilation subnetworks to changes of aerodynamic resistance and of air density in mine workings. Formulae for determination of the sensitivity of the main subnetwork air flows by establishing the degree of dependency of the air volume stream in a given working on the variations in resistance or air density of other workings of the network have been developed. They have been
implemented in the VentGraph mine ventilation network simulator. This software, widely used in
Polish collieries provides an extended possibility to predict the process of ventilation, air distribution and, in the case of underground fire, also the spread of combustion gasses. The new method facilitates assessment by mine ventilation services of the stability of ventilation systems in exploitation areas and determine of the sensitivity of the main subnetwork air flow directions to changes of aerodynamic resistance and air density. Recently in some Polish collieries new longwalls are developed in seams located deeper then the bottom of the intake shaft. Such solution is called “exploitation below the level of access” or “sublevel”. The new approach may be applied to such developments to assess the potential of changes of direction and air flow rates. In addition, interpretation of the developed sensitivity indicator is presented. While analyzing air distributions for sublevel exploitation, application of current numerical models for calculations of the distribution results in tangible benefits,
such as the evaluation of the safety or risk levels for such exploitation. Application of the VentGraph
computer program, and particularly the module POŻAR (fire) with the newly developed options,
enables an additional approach to the sensitivity indicator in evaluating air flow safety levels for the risks present during exploitation below the level of the intake shaft. The analyses performed and examples presented enabled useful conclusions in mining practice to be drawn.
Keywords: ventilation process prediction; safety of mine ventilation system; sensitivity of the main air flows in ventilation subnetworks
1. Introduction
New possibilities for calculation tools enabling mine ventilation services to determine safety
indices for the operation of a ventilation system based on a system of VentGraph computer programs
have been presented [3], [4], [5], [6]. The system of VentGraph programs is used in a number of Polish
coal mines, as well as in Australian, North American, Vietnamese and Czech coal mines [8], [15]. At the same time a systematic use of 2D and 3D dimensional flow modelling [13], [14], [16] resulting from new development of the Computational Fluid Dynamics provides insight, which is more detailed but limited to one or a few workings. So far modelling large ventilation systems is practically possible only with one dimensional flow approximation, used by programs like Ventgraph, which justifies their further development. The results thus obtained open new possibilities for study and analysis, particularly of phenomena caused by the methane inflow to areas of mining longwalls and goaf.
Good results in terms of the assessment of ventilation system operational safety are obtained with an analysis of ventilation systems based on stability indicators, which when supplemented with a
sensitivity assessment of the local area air flows, brings interesting elements to the evaluation of natural risks.
The subject of the stability of flows bringing air to the longwall is of utmost importance. In the event of fire, weak and unstable air flows pose the risk of reversed flow. Stability of ventilation in exploitation areas is important not only for underground fires, but also while ventilating zones of methane hazard [1], [15]. Changes in ventilation conditions in those zones may lead to a build-up of hazardous methane concentrations at the workplace. This results not only from the lack of a sufficient air volume needed to dilute the methane, but is also due to the gaseous dynamic processes present at the longwalls. The vital issue while ventilating mining areas is the variability in time for the output of the existing methane sources, which depends largely on the exploitation advance and ventilation conditions. Ventilation disturbances cause the air volumes migrating through the goaf to change and, consequently, result in changes of methane quantities released from the goaf. Liberation of methane from the worked out area (goaf) is one of the most variable and difficult to control methane sources at the longwall, the activity of which depends mainly on the stability of air flow through the area. Therefore, the problem of the possible flow irregularities apparent in changed air output and its flow directions in specific branches of the ventilation network is of utmost importance for the fire and methane safety of every mine.
A useful addition to the evaluation of air flow stability is the determination of the indices of the sensitivity of the main flows in ventilation subnetworks to the changes of aerodynamic resistance of workings [10], [11], [12]. This parameter shows the degree of dependency of air volume stream in a given working to the resistance of other workings forming the network. Recently in some Polish collieries new longwalls are developed in seams located deeper then the bottom of the intake shaft. Such solution is called “exploitation below the level of access”. For ventilation subnetworks located below the level of access, it is important to study the potential for changes of the stream volume and fire gasses when a fire develops. Therefore, a new approach is proposed to the subject of air flow assessment in workings below the level of access, and formulas are developed for determination of the sensitivity of local air flows for the change (decrease) of air density.
For the formulae and equations presented, algorithms are proposed, based on which new
procedures for the VentGraph program have been developed [5]. Examples are presented to illustrate
the performance of new calculation capacities of the VentGraph program. The results prove their
usefulness for analyzing the changes of air flow direction and distribution in a ventilation system of an underground mine.
2. Calculation of airflows in workings of a mine ventilation network with the VentGraph software
The mine ventilation system may be represented as a network, in which shafts, galleries and longwalls are branches and places where they intersect are nodes. Then the flow distribution may be calculatated from following system of matrix equations:
- equation of the mass flows balance in the network nodes (Kirchhoff’s First Law)
0
q
a
⋅
=
(1)- equation of pressure balance for independent loops (circuits) of ventilation network ( Kirchhoff’s Second Law)
0
p
b
⋅
=
(2)- equation linking the air mass streams in branches with loop streams
Q
b
q
=
T(3)
where a - matrix of node-branch incidence of I x J dimension,
ai,j = 1 - branch j is oriented towards node i,
ai,j = -1 - branch j is oriented from node i,
b - matrix of loop-branch incidence of K x J dimension,
bk,j = 1 - loop k contains branch j, and the branch and loop orientations are consistent,
bk,j = 1 - loop k contains branch j, and the branch and loop orientations are opposite,
bk,j = 1 - loop k does not contain branch j,
I - number of network nodes,
J - number of branches in the network,
K - number of independent loops in the network, K = J – I + 1,
q - column matrix of air mass streams in branches qm j of dimension J,
p - column matrix of branch pressure differences Δpj of dimension J,
Q - column matrix of loop air mass streams Qk of dimension K
0 - column zero matrix of dimension J.
The difference in branch pressures Δpj for branch j is given by the formula [17]:
(
bj lj)
j j avj(
j Lj)
wj jL j
j
p
p
R
R
q
q
g
z
z
h
p
=
−
=
+
−
−
−
Δ
0ρ
0 (4)where p0 j, pL j - static pressures at the beginning and at the end of branch j,
q j - air volume stream in branch j,
Rb j - aerodynamic resistance of branch j,
Rl j - local aerodynamic resistance in branch j (e.g. a ventilation door),
g - acceleration of gravity,
ρav j - average air density in branch j,
z0 j, zL j - elevation of the beginning and of the end of branch j,
hw j - pressure of a fan (if present) in branch j .
Aerodynamic resistance of branch Rb and local aerodynamic resistance Rl for the air mass stream
are given by formulae:
3
8
A
PL
R
av b
=
ρ
λ
and
2
A
2R
av
l
=
ρ
ζ
(5)where λ, ζ - dimensionless coefficients of the branch resistance and of the local resistance,
ρav - average air density in the branch,
A - area of branch cross-section,
P - circumference of the branch cross-section,
L - length of the branch.
There is a relationship between air mass stream q and volume stream qV
V av
q
q
=
ρ
(6)The average air density in the branch is given by the formula:
=
ℜ
=
Nn
n M n av
av av
C
T
p
1
ρ
(7)
where pav - average atmospheric pressure in the branch
2
0 L
av
p
p
p
≈
+
p0, pL - atmospheric pressures at the beginning and at the end of the branch,
Tav - average air temperature (in K) in the branch
2
0 L
av
T
T
T
≈
+
T0, TL - air temperature at the beginning and at the end of air split,
ℜn - gas constant of n-th air component,
The Ventgraph software, developed at the IMG-PAN [5], is a typical representative of computer software, in which a numerical method for airflow distribution is based on the Kirchhoff’s Second Law (2). The algorithm of the steady state computation is based the one-dimensional mathematical model of air flow in the network, given above. This model is based on the equation describing the air flow in ventilation network branches (4), (5), [17]. The software adopts a numerical algorithm for this system solution based on the modified Euler method, provided by Hardy Cross [2], [9], [18]. It is necessary to emphasise here, that the adopted mathematical model of flow takes into account changes of air density caused by changes of atmospheric pressure and caused by changes of air composition and of temperature (4), (5), (7). As a result, most phenomena, which could affect the airflows the network, have been considered.
The software algorithm contains a number of possibilities related to the regulation of the ventilation network (calculations of the ventilation door resistance value or of the auxiliary fan pressure), including the control of network condition, and designing new workings, etc. The software contains an interactive graphical user interface. Results of calculations are presented in an isometric diagram of specific ventilation network.
3. Sensitivity of local area air flows
An important parameter for evaluation and analysis of the ventilation systems is the sensitivity of local area air flows. This parameter shows the degree of sensitivity of an air volume stream in a given working to disturbances in the workings forming the network. In the study, it has been assumed that the disturbances can be resistance changes of ventilation branches and air density variations in those branches as a result of fire or methane inflow.
3.1. Indicator of volume stream sensitivity in branch i to resistance change in branch j
The volume stream sensitivity in branch i to resistance changes in the ventilation network branches
can be determined with the aid of the resistance sensitivity indicator, defined as follows [11], [12]:
j i V j i
R
q
∂
∂
=
,
ε
(8)where: qVi – air volume stream in branch i;
Rj – aerodynamic resistance in branch j.
The resistance sensitivity indicator shows, how the air stream in branch i changes due to the
changed resistance of branch j. The higher is the indicator’s absolute value, the higher is the change of
air stream in branch i resulting from the change of branch j resistance. Indicator’s sign shows the
direction of change (decrease for negative) .
A good approximation of this derivative value
∂
q
Vi/
∂
R
i in the surroundings Rj is the followingexpression:
j i j j i j
i V
a
R
a
R
q
, 1 ,
2
2
+
=
∂
∂
(9)
where aR i,j and bR i,j are factors of the parabola estimating the dependency
q
Vi=
f
( )
R
j :j i j j i j j i i
V
a
R
a
R
a
q
2 1,, 0,,, ,
2
+
+
=
(10)Calculation of those factors requires the solution of the ventilation network for three resistance values Rj:
( )
,1 1, j
i
V
f
R
Now, the factors a0,i,j, a1,i,j and a2,i,jj can be calculated by solving the system of equations, which takes the following form in matrix notation:
A
R
Q
=
(12)where
=
3 , 2 , 1 , i V i V i Vq
q
q
Q
,
=
1
1
1
3 , 2 3 , 2 , 2 2 , 1 , 2 1 , j j j j j jR
R
R
R
R
R
R
,
=
j i j i j ia
a
a
, , 0 , , 1 , , 2A
.
(13)This system solution has the form
Q
R
A
=
−1 (14)where
R
K
RD
1
1=
−(15)
Determinant DR equals
3 , 2 1 , 1 , 2 2 , 2 , 2 3 , 1 , 2 3 , 3 , 2 2 , 2 , 2 1
, j j j j j j j j j j j
j
R R R R R R R R R R R R R
D = + + − − − (16)
and K is the matrix of cofactors of the transpose of matrix, RT
The factors a1,i,j and a2,i,j calculated from (14) equal:
R i V i V i V j i R
D
q
K
q
K
q
K
a
,=
1,1 ,1+
1,2 ,2+
1,3 ,3 (17)R i V i V i V j i R
D
q
K
q
K
q
K
b
,=
2,1 ,1+
2,2 ,2+
2,3 ,3 (18)Matrix cofactors in the formulas (17) and (18) equal:
3 , 2 , 1 ,
1 Rj Rj
K = − K1,2=Rj,3−Rj,1 K1,3=Rj,1−Rj,2 2 2 , 2 3 , 1 ,
2 Rj Rj
K = − 2
3 , 2 1 , 2 ,
2 Rj Rj
K = − 2
1 , 2 2 , 3 ,
2 Rj Rj
K = − (19)
Having calculated the factors a1i,j and a2i,j from the formulae (17) and (18), from formulae (5) and
(9), the resistance sensitivity indicator showing the air volume stream sensitivity in branch i to the
change of resistance in branch j can be calculated.
j R i V j R i V j R i V j R j i
D
q
A
q
A
q
A
,1 ,1 ,2 ,2 ,3 ,3 ,+
+
=
ε
(20)where: qV i,1, qV i,2, qV i,3 – air volume streams in branch i calculated for resistance values Rj1, Rj2, Rj3
of branch j.
Values of the factors AR j,1, AR j,2, AR j,3 are determined by the formulae:
1 , 2 , 1 , 1 , 1
,
2
j R j Rjj
R
R
K
K
A
=
+
,
A
Rj,2=
2
R
jK
Rj,1,2+
K
Rj,2,2,
3 , 2 , 3 , 1 , 3,
2
j Rj Rjj
R
R
K
K
A
=
+
(21)For resistance values of branch j expressed as a fraction uR, the following computational formulae
were developed. In calculations, the following resistance for branch j is assumed:
j j R
Let ΔR be some fraction uR of the resistance value Rj then:
(
R)
jj u R
R ,2= 1+
,
Rj,3=(
1−uR)
Rj (23)where Rj – aerodynamic resistance in branch j.
The resistance sensitivity indicator equals:
j R
i V i V j i
R
u
q
q
2
3 , 2 , ,
−
=
ε
(24)The solution of a ventilation network for two resistance values Rj enables calculation of sensitivity
indicator [εi,j] for all sensitivity indicator located in column j of the sensitivity indicator matrix with
dimensions J x J, where J is the number of branches in the ventilation network.
3.2 Interpretation of the sensitivity indicator in terms of resistance change in the branch
Having analyzed the indicators of air volume stream sensitivity to resistance changes in branches calculated for a ventilation network in terms of the value module and sign, it may be concluded that:
• A negative sign for the indicator corresponds to the basic dependency between the air
volume stream and aerodynamic resistance, i.e. the volume stream decreases with an increase in the branch resistance.
• The module of indicator values enables selection of the branches in which the resistance
change considerably affects the volume stream in a selected branch, i.e. parameters significant for the network regulation.
For example, when the indicator of air volume stream sensitivity in branch i to resistance change
in branch j equals εi,j = −2, it means that an increase of resistance in branch j of 10% will cause the volume
stream value in branch i to decrease by approximately 20%. The approximation results from the fact
that the dependency between the air stream volume in branch i and the resistance in branch j is not
linear.
3.3. Indicator of volume stream sensitivity in branch i to air density change in branch j
Similarly to the branch resistance, the density sensitivity indicator showing the volume stream
sensitivity in a branch to air density changes in the ventilation network may be defined:
j i V j i
q
ρ
κ
∂
∂
=
, (25)
where:qVi – air volume stream in branch i;ρj – air density in branch j.
The indicator of sensitivity to air density change is calculated in the same way as the indicator of sensitivity to branch resistance change, with the difference that in formulae (9), (10) and (11) the
resistance of j-th branch Rj is replaced with the air density in this branch ρj, and formula (12) takes the
form:
A
G
Q
=
(26)where matrix G equals
=
1
1
1
3 , 2
3 ,
2 , 2
2 ,
1 , 2
1 ,
j j
j j
j j
ρ
ρ
ρ
ρ
ρ
ρ
G
(27)j j ρ
ρ =,1
,
ρj,2 =ρj+Δρ,
ρj,3=ρj−Δρ (28)Let Δρbe some factor u of air density value ρj then:
(
)
j j u ρρ ,2= 1+ ρ
,
ρj,3=(
1−uρ)
ρj (29)where: ρj – aerodynamic resistance in branch j.
The density sensitivity indicator equals:
j j i V j i V j
i u
Q Q
ρ
κ
ρ 2
3 , , 2 , , ,
−
=
(30)
The solution of a ventilation network for two air density values ρj enables calculation of density
sensitivity indicator [κi,j] for all network branches in column j of the sensitivity factor matrices with
dimensions J x J, where J is the number of branches in the ventilation network.
3.4 Interpretation of the sensitivity indicator in terms of air density changes
Having analyzed the indicators of air volume stream sensitivity to air density changes in the branches in terms of the value module and sign, it may be concluded that:
• A positive sign for the indicator means an increase in the air volume stream value in the
branch together with an increase in air density in a different branch, and a decrease in the stream value with decreasing air density in another branch.
• A decrease in air density in a working occurs in the case of fire or methane inflow.
• The module of indicator values enables selection of the branches in which the air density
change considerably affects the volume stream in a selected branch. In combination with a positive sign for the indicator, this may indicate the possibility of reversing the air flow direction.
For example, when the sensitivity indicator of the air volume stream in branch i to air density
change in branch j is κi,j > 2, this means that, in branch i, there is the probability of reversing the air flow
direction. The limit value of the indicator κi,j = 2 results from the assumption that the air density value
in the case of fire in branch j could drop by as much as 50%, and would be accompanied by an air
volume stream reduction in branch i of as much as 100%.
4. New procedures with the VentGraph program
The above formulae, enabling the determination of the sensitivity of local area air flows, have
enabled development of a series of new procedures for the VentGraph program.
In the GRAS module of the VentGraph program, a new option––‘Indicators’––has been added. This
Fig. 1. VentGraph program window, GRAS module in rectangles – air flow volume stream, in nodes – potential (relative pressure) values.
Details of the network structures, workings of the area and parameters describing the flow in the
workings region are listed in figure 2. [6], which is a copy of a VentGraph screen.
Fig.2. Details of the network structures.
The mine working area (subnetwork), as shown in figure 1, has been selected to exemplify
calculations of the sensitivity indicator εi,j. In the GRAS steady flow calculation module of the VentGraph
program, an additional ‘Indicators’ option is provided in the program menu. To make calculations after using this option, choose the ‘Sensitivity indicators for selected branch’ sub-option. When selected, and
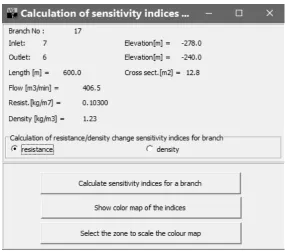
Fig. 3. Calculating sensitivity indicators for branch 17.
From the window shown in figure 3, sensitivity indicators may be calculated for branches of the selected area, due to the change of aerodynamic resistance of branch 17 or the change of density in that branch. Click on the active option button to make the selection.
With this function, sensitivity indicators shall be calculated for the network branches, due to the change in the chosen branch:
• resistance – left-hand button of the window;
• density – right-hand button of the window.
The matrix of sensitivity indicators created may be saved as a file with an extension ‘name.wrR’ or ‘name.wRo’, where the name is given by the user. This saving is enabled by the program option
‘Sensitivity from R’ and ‘Sensitivity from Ro’ available in the top bar of the VentGraph program.
The data are saved in a text file that can be read by MS Excel or Notepad. The sensitivity matrix εi,j
Table 1. Complete sensitivity matrix εi,j of a network of mine workings for aerodynamic resistance changes.
Br.nr. 1 2 3 4 5 6 7 8 9 10 11 12 13 14 15 16 17 18 19
1
-2,853 -2,597 -1,469 -1,101 -0,643 -0,553 -0,425 -0,042 -0,022 -0,023 -0,590 -1,164 -2,692 -0,031
-0,025 0,001
-0,063 -0,176 -0,011
2
-2,853 -2,597 -1,469 -1,101 -0,643 -0,553 -0,425 -0,042 -0,022 -0,023 -0,590 -1,164 -2,692 -0,031
-0,025 0,001
-0,063 -0,176 -0,011
3
-2,853 -2,597 -1,469 -1,101 -0,643 -0,553 -0,425 -0,042 -0,022 -0,023 -0,590 -1,164 -2,692 -0,031
-0,025 0,001
-0,063 -0,176 -0,011
4
-2,300 -2,107 -1,076 -2,670 -1,391 -0,885 -1,065 -0,061 -0,028 -0,042 -1,563 -0,763 -2,193 -0,057
-0,039 0,000
-0,221
-0,498 0,114
5
-1,621 -1,464 -0,942 -2,261 -1,830 -1,045 -1,437 -0,063 -0,028 -0,050 -2,138 -2,025
-1,520 0,133 0,145
-0,003
-0,318
-0,692 0,096
6
-1,379 -1,265 -0,643 -2,209 -1,843 -2,772 -3,308 -0,077 -0,042 -0,073 -1,951 -1,831
-1,316 0,119 0,133 0,044
-1,058
-0,551 0,087
7
-1,379 -1,265 -0,643 -2,209 -1,843 -2,772 -3,308 -0,077 -0,042 -0,073 -1,951 -1,831
-1,316 0,119 0,133 0,044
-1,058
-0,551 0,087
8
-0,423 -0,395 -0,125 -0,470 -0,389 -0,247 -0,592 -2,679 -2,528 -2,643 -0,557 -0,528
-0,411 0,038 0,041 0,004 4,236 6,992 0,025
9
-0,423 -0,395 -0,125 -0,470 -0,389 -0,247 -0,592 -2,679 -2,528 -2,643 -0,557 -0,528
-0,411 0,038 0,041 0,004 4,236 6,992 0,025
10
-0,423 -0,395 -0,125 -0,470 -0,389 -0,247 -0,592 -2,679 -2,528 -2,643 -0,557 -0,528
-0,411 0,038 0,041 0,004 4,236 6,992 0,025
11
-1,621 -1,464 -0,942 -2,261 -1,830 -1,045 -1,437 -0,063 -0,028 -0,050 -2,138 -2,025
-1,520 0,133 0,145
-0,003
-0,318
-0,692 0,096
12
-2,173 -1,954 -1,334 -0,693 -1,082 -0,713 -0,797 -0,044 -0,021 -0,031 -1,165 -2,426
-2,019 0,159 0,159
-0,002 -0,160 -0,370 -0,029
13
-2,853 -2,597 -1,469 -1,101 -0,643 -0,553 -0,425 -0,042 -0,022 -0,023 -0,590 -1,164 -2,692 -0,031
-0,025 0,001
-0,063 -0,176 -0,011
14
-0,679 -0,642 -0,134
-0,409 0,439 0,160 0,372 0,003 0,000 0,009 0,575 1,263
-0,673
-0,190
-0,184 0,003 0,097 0,194 0,017
15
-0,679 -0,642 -0,134
-0,409 0,439 0,160 0,372 0,003 0,000 0,009 0,575 1,263
-0,673
-0,190
-0,184 0,003 0,097 0,194 0,017
16
-0,242 -0,199 -0,298
-0,052 0,013 1,726 1,871 0,014 0,014 0,022
-0,187
-0,194
-0,204 0,014 0,012
-0,047 0,739
-0,140 0,009
doi:10.20944/preprints201707.0050.v1
Peer-reviewed version available at
17
-0,956 -0,870
-0,518
-1,739
-1,454
-2,525
-2,715 2,601 2,486 2,570
-1,394
-1,303
-0,905 0,081 0,093 0,040
-5,293
-7,543 0,062
18
-1,198 -1,069
-0,816
-1,791
-1,440
-0,798
-0,844 2,616 2,500 2,592
-1,581
-1,497
-1,109 0,094 0,104
-0,007
-4,554
-7,684 0,071
19
-0,552 -0,490
-0,393 1,569 0,748 0,332 0,640 0,019 0,007 0,019 0,973
-0,401
-0,499 0,026 0,015 0,001 0,158 0,322
-0,125
Table 2. Complete sensitivity matrix κi,j of a network of mine workings for air density changes in branches.
Br. nr. 1 2 3 4 5 6 7 8 9 10 11 12 13 14 15 16 17 18 19
1 2,570 8,222 0,321 0,196 0,232 0,053 0,245 0,025 0,007 0,007 0,830 1,511 8,952 0,574 0,290
-0,036 0,011 0,035 0,345
2 2,570 8,222 0,321 0,196 0,232 0,053 0,245 0,025 0,007 0,007 0,830 1,511 8,952 0,574 0,290
-0,036 0,011 0,035 0,345
3 2,570 8,222 0,321 0,196 0,232 0,053 0,245 0,025 0,007 0,007 0,830 1,511 8,952 0,574 0,290
-0,036 0,011 0,035 0,345
4 2,079 6,688 0,249 0,507 0,608 0,098 0,618 0,053 0,013 0,013 2,211 0,818 7,293 1,010 0,485
-0,024 0,039 0,100
-3,086
5 1,452 4,630 0,183 0,409 0,842 0,118 0,834 0,067 0,015 0,015 3,023 2,637 5,045
-2,001
-1,144 0,092 0,055 0,140
-2,613
6 1,247 4,020 0,148 0,368 0,772 0,270 1,928 0,092 0,022 0,022 2,754 2,315 4,382
-1,769 -1,019
-1,489 0,173 0,110
-2,335
7 1,247 4,020 0,148 0,368 0,772 0,270 1,928 0,092 0,022 0,022 2,754 2,315 4,382
-1,769 -1,019
-1,489 0,173 0,110
-2,335
8 0,387 1,259 0,043 0,105 0,221 0,038 0,346 2,220 0,678 0,798 0,789 0,723 1,374
-0,566 -0,324
-0,147
-0,723
-1,417
-0,712
9 0,387 1,259 0,043 0,105 0,221 0,038 0,346 2,220 0,678 0,798 0,789 0,723 1,374
-0,566 -0,324
-0,147
-0,723
-1,417
-0,712
10 0,387 1,259 0,043 0,105 0,221 0,038 0,346 2,220 0,678 0,798 0,789 0,723 1,374
-0,566 -0,324
-0,147
-0,723
-1,417
-0,712
11 1,452 4,630 0,183 0,409 0,842 0,118 0,834 0,067 0,015 0,015 3,023 2,637 5,045
-2,001
-1,144 0,092 0,055 0,140
-2,613
12 1,943 6,164 0,256 0,098 0,466 0,073 0,461 0,039 0,009 0,010 1,642 3,330 6,703
-2,437
-1,338 0,079 0,028 0,075 0,818
13 2,570 8,222 0,321 0,196 0,232 0,053 0,245 0,025 0,007 0,007 0,830 1,511 8,952 0,574 0,290
-0,036 0,011 0,035 0,345
doi:10.20944/preprints201707.0050.v1
Peer-reviewed version available at
Energies
2017
,
10
, 1451;
14 0,628 2,058 0,066 0,097 -0,234
-0,020
-0,216
-0,013
-0,003
-0,003
-0,812
-1,819 2,248 3,011 1,628
-0,116
-0,017
-0,039
-0,473
15 0,628 2,058 0,066 0,097
-0,234 -0,020
-0,216
-0,013
-0,003
-0,003
-0,812
-1,819 2,248 3,011 1,628
-0,116
-0,017
-0,039
-0,473
16 0,204 0,610 0,035 0,041 0,070
-0,153 -1,094
-0,026
-0,007
-0,007 0,269 0,323 0,663
-0,232
-0,124 1,581
-0,118 0,029
-0,278
17 0,860 2,761 0,105 0,263 0,551 0,233 1,582
-2,128 -0,655
-0,775 1,966 1,591 3,008
-1,203
-0,695
-1,343 0,897 1,527
-1,623
18 1,064 3,370 0,141 0,304 0,621 0,080 0,488
-2,153 -0,662
-0,782 2,235 1,914 3,671
-1,435
-0,819 0,239 0,778 1,557
-1,901
19 0,491 1,534 0,073
-0,311 -0,376
-0,045
-0,372
-0,028
-0,006
-0,006
-1,381 0,693 1,658
-0,436
-0,195
-0,013
-0,028
-0,065 3,431
doi:10.20944/preprints201707.0050.v1
Peer-reviewed version available at
Energies
2017
,
10
, 1451;
An important part of working with a computer program is to adopt a ‘useful and friendly’ way
1
of presenting the results of any determined sensitivity matrix, so that the information presented will
2
be useful in practice, particularly regarding air flow adjustment in a complex network of workings.
3
Therefore, a graphic presentation of the results directly in an isometric diagram of the network of
4
workings was proposed. Existing experience proves that, from a practical point of view, such a
5
presentation of results provides useful data for a ventilation engineer.
6
7
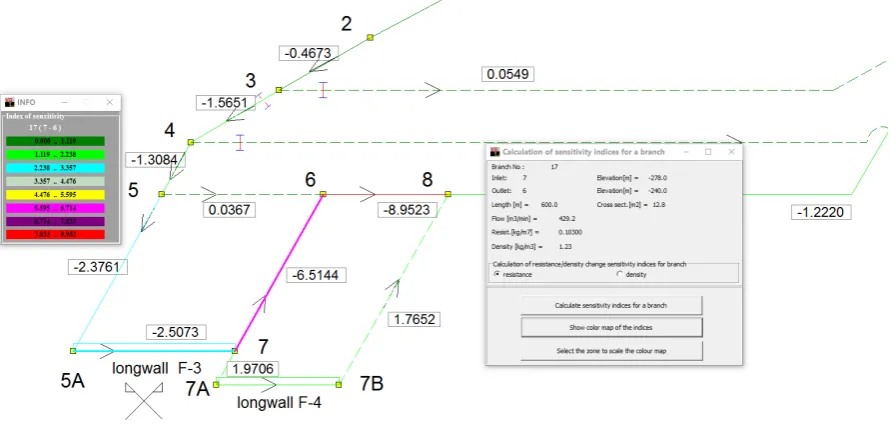
Fig. 4. Ventilation network area with presentation of a sensitivity indicator for resistance changes of
8
a branch in the adopted color scale.
9
Because of the size of the sensitivity matrix
ε
i,j and the availability of only up to eight colors10
in the VentGraph program, it was proposed to show only the results for the given area of workings
11
selected in the diagram. After choosing the option in the lower window shown in figure 3, ‘Select
12
network area to display indicators in color scale’, click the left mouse button and, keeping it pressed,
13
drag the mouse to expand the white rectangular contours. Release the mouse button to finish
14
selection of the network area to display. Then, place the mouse cursor in the white rectangle area
15
(cursor form changes) and click the mouse to display the sensitivity indicator in the selected color
16
scale.
17
After their values are calculated by the program, the network branches shall be displayed in
18
colors from the color scale presented in a separate panel. The borders of the colors scale are calculated
19
from the indicator module, starting from 0, to the maximum absolute value of the indicator (divided
20
equally into 8 colors). Branches for which the indicator value is positive are represented with dashed
21
lines, and the negative ones with continuous lines. The branch for which the indicators are calculated
22
is additionally marked with a double line in the relevant color.
23
Figure 4 shows, on the basis of a test example, the result of the calculation of sensitivity
24
indicators
ε
j=1...19,i=17 for the change of branch resistanceno. 17 (inlet-node 7 – outlet-node 6); this25
branch is marked with two bold lines and, in this case, in red color.
26
Figure 5 shows the area of longwall N-15, for which the sensitivity indicators determined are
27
presented graphically, for density change in working no. 377, i.e. longwall N-15. The sample
28
ventilation network of mine ‘K’ is created from 498 workings (branches). For the ‘K’ mine, the module
29
of sensitivity indicator value, for the changes of aerodynamic resistance, falls within the range of 0 to
30
3134, and for the sensitivity factor, for the density changes, from 0 to 6.8. Interpretation of the
31
sensitivity indicators is given in par. 3.2 and 3.4.
33
34
Fig. 5. Ventilation network area with presentation of a sensitivity indicator for density changes in the
35
adopted color scale.
36
5. Summary
37
This paper presents new options for determining the sensitivity of local subnetwork flows to the
38
change of air flow directions. The method chosen to meet the objective involves an extended
39
possibility to predict the process of ventilation, air distribution and, in the case of underground fire,
40
also the spread of fire gasses. Widespread use of computer programs, including the VentGraph
41
system, facilitates assessment by mine ventilation services of the stability of ventilation systems in
42
exploitation areas and determination of the sensitivity of local area flows to changes of air flow
43
directions.
44
While analyzing air distributions for the exploitation below the level of access, application of
45
current numerical models for calculations of the distributions results in tangible benefits, such as the
46
evaluation of the safety or risk levels for such exploitation. Application of the VentGraph computer
47
program, and particularly the module POŻAR (fire) [8], together with the newly developed options
48
enables a comprehensive analysis of distribution for the real risks present in a specific case during
49
exploitation below the level of access. The analyses performed and examples presented support the
50
following statements:
51
• For the evaluation of air flow in workings below the level of access, a new approach to
52
the problem has been proposed and formulae have been developed to determine the
53
sensitivity of local area air flows due to the change (decrease) of air density.
54
Determination of the sensitivity of the local area air flows presents the degree of
55
dependency of the air volume stream in a given working on the changes of resistance or
56
density in other workings included in the network. Interpretations of the sensitivity
57
indicator are presented in par. 2.3 and 2.4.
58
• Since it is difficult to predict the distribution of fire gasses in the case of an underground
59
fire, for newly designed working areas below the level of access, it is recommended to
60
investigate the possibility of changes of the volume (mass) of air flow (fire gasses) during
61
a fire, using the POŻAR (fire) module of the VentGraph program. Currently, this is the
62
only tool enabling the prediction of variation in the duration of a fire and its impact on
63
the distribution pattern of air and fire gasses. The results obtained confirm the
64
usefulness of the algorithms developed for the analysis and assessment of changes in
65
the direction and the volume stream of air flowing in the ventilation system of an
66
underground mine.
Acknowledgments: This work was supported by The National Centre for Research and Development, Poland,
68
Research project entitled “Improving occupational safety in mines” [SP/K/2/143445/11, 2011 - 2013].
69
References
70
1.
H. Bystroń, An Approach to Mine Ventilation based on Aerodynamic Potential of Ventilating Air with71
Reference to Unit Mass of Dry Air, in: D. C. Panigrahi (Ed.). Mine Environment and Ventilation, Abingdon,
72
Oxon, UK ; New York : Taylor & Francis, 2001, pp. 29-41.
73
2.
H. Cross, Analysis of flow in networks of conduits or conductors, Engineering Experiment Station.74
University of Illinois Bulletin 286 (1936).
75
3.
W. Dziurzyński, J. Krawczyk, Unsteady flow of gases in a mine ventilation network – numerical simulation,76
Archives of Mining Sciences 46/2 (2001) 19-137,
77
4.
W. Dziurzyński, J. Kruczkowski, Validation of the mathematical model used the Ventgraph program on78
the example of the introduction of new headings to the ventilation network of mine, Archives of Mining
79
Sciences 52/2 (2007) 155-169.
80
5.
W. Dziurzyński, T. Pałka, J. Krawczyk, Ventgraph for Windows – Ventilation Engineer’s Program System81
for Analyzing the Ventilation Network under Normal and Emergency Conditions – Simulation of Transient
82
Flow of Air and Fire Gases – Manuals, Transaction of Strata Mechanics Research Institute (2013) 1-100.
83
6.
W. Dziurzyński, T. Pałka, A. Krach, A reliable method of completing and compensating the results of84
measurements of flow parameters in a network of headings, Archives of Mining Sciences 60/1 (2015) 3-24.
85
7.
A.D.S. Gillies, H.W. Wu,A.M. Wala, Australian Mine Emergency Exercises Aided by Fire Simulation,86
Archives of Mining Sciences 50/1 (2005) 17-47.
87
8.
A.D.S. Gillies, A.M. Wala, H.W. Wu, Simulation of the Effects of Inertisation of Fires on Mine Ventilation88
Systems, Proceedings of the Eighth International Mine Ventilation Congress, Brisbane, Australia (2005)
317-89
324.
90
9.
H.L. Hartman, J.M. Mutmansky, R.V. Ramani, Y. J. Wang, Mine Ventilation and Air Conditioning, John91
Wiley & Sons, third ed. 1997.
92
10.
G. Li, C. Kocsi, S. Hardcastle, Sensitivity analysis on parameter changes in underground mine ventilation93
Systems, Journal of Coal Science & Engineering 17/3 (2011) 251–255.
94
11.
Liming Hu, Shuguang Jiang, Shibao Dong, Selection and Application of Ventilation System’s Sensitive95
Branches Based on the Sensitivity, Advanced Materials Research 1010-1012 (2014) 1471-1474.
96
12.
M. Kolarczyk, Wpływ struktury kopalnianej sieci wentylacyjnej na wrażliwość prądów powietrza przy97
zmianach oporów, Zeszyty Naukowe Politechniki Śląskiej - Górnictwo 214, WPŚ, Gliwice, (1993) 1- 204.
98
13.
J. Krawczyk, J. Janus,Modelling of the propagation of methane from the longwall goaf, performed by99
means of a two-dimensional description, Archives of Mining Sciences 59/4(2014) 851-868.
100
14.
Jundika C. Kurnia, Agus P. Sasmito, Arun S. Mujumda: CFD simulation of methane dispersion and101
innovative methane management in underground mining faces, Applied Mathematical Modelling, 38
102
(2014), p. 3467-3484
103
15.
C.J. Pritchard, Validation of the Ventgraph program for use in metal/non-metal mines, Proceedings of the104
13th United States/North American Mine Ventilation Symposium, Sudbury, June Canada (2010) 455-462.
105
16.
P. Skotniczny, Transient states in the flow of the air-methane mixture at the longwall outlet, induced by a106
sudden methane outflow,Archives of Mining Sciences 59/4(2014) 887-896.
107
17.
W. Trutwin, On transients of airflow in mine workings. Mining Science and Technology 6 (1988) 247-254.108
18.
K.Yu. Volokh, On foundations of the Hardy Cross method, International Journal of Solids and Structures109
39 (2002) 4197–4200.