Scholarship@Western
Scholarship@Western
Electronic Thesis and Dissertation Repository
8-16-2013 12:00 AM
Development and Application of an Experimental Model for the
Development and Application of an Experimental Model for the
Fluid Coking Process
Fluid Coking Process
Carolina B. Morales
The University of Western Ontario
Supervisor Briens, Cedric
The University of Western Ontario Joint Supervisor Berruti, Franco.
The University of Western Ontario
Graduate Program in Chemical and Biochemical Engineering
A thesis submitted in partial fulfillment of the requirements for the degree in Master of Engineering Science
© Carolina B. Morales 2013
Follow this and additional works at: https://ir.lib.uwo.ca/etd
Part of the Other Chemical Engineering Commons, and the Petroleum Engineering Commons
Recommended Citation Recommended Citation
Morales, Carolina B., "Development and Application of an Experimental Model for the Fluid Coking Process" (2013). Electronic Thesis and Dissertation Repository. 1484.
https://ir.lib.uwo.ca/etd/1484
This Dissertation/Thesis is brought to you for free and open access by Scholarship@Western. It has been accepted for inclusion in Electronic Thesis and Dissertation Repository by an authorized administrator of
(Thesis format: Integrated Article)
by
Carolina B. Morales M.
Graduate Program in Chemical and Biochemical Engineering
A thesis submitted in partial fulfillment of the requirements for the degree of
Master of Engineering Science
The School of Graduate and Postdoctoral Studies The University of Western Ontario
London, Ontario, Canada
ii
Abstract
Liquid injection into a fluidized bed is used in industrial applications such as the Fluid
CokingTM process for heavy oil thermal cracking. Poor initial liquid-solid contact results in
the formation of agglomerates that limit heat and mass transfer processes, reduce the yield of
valuable compounds and create operating problems. The present study develops a new
experimental model to simulate the complex phenomena that occur when heavy oil is
injected in a Fluid Coker through two-phase nozzles. The model is applied in a pilot scale
fluidized bed using scaled-down industrial spray nozzles. The experimental results indicate
that agglomerate formation slows down liquid vaporization and that process conditions, such
as bed hydrodynamics and temperature, have a significant impact on agglomerate properties.
The experimental results also suggest how to modify spray nozzles to improve their
performance in Fluid Cokers. Important information is provided for the development of the
theoretical models that are needed to better understand the effect of agglomerating
phenomena on bitumen upgrading.
Keywords
Fluid CokingTM, Fluidized bed, Experimental modeling, Hydrodynamics, Agglomerates,
iii
Co-Authorship Statement
Chapter 2 Article Title:
Experimental Modeling of Liquid Injection in a Fluidized Bed: Effect of Spray Nozzle Operating Conditions
Authors:
Carolina B. Morales M., Tarek J. Jamaleddine, Cedric Briens, Franco Berruti, Jennifer McMillan
Status:
Unpublished
Contributions:
Carolina B. Morales M. conducted all experimental work, analyzed the data and wrote the manuscript. Tarek J. Jamaleddine provided general guidance. The work was jointly supervised by Cedric Briens and Franco Berruti, who reviewed several drafts of this work. Jennifer McMillan provided useful advice throughout the project, ensured that the study was relevant to Fluid CokingTM and reviewed the final draft of the manuscript.
Chapter 3 Article Title:
Effect of Liquid Properties and Spray Nozzle Design on Agglomerate Properties in a Fluidized Bed
Authors:
Carolina B. Morales M., Tarek J. Jamaleddine, Cedric Briens, Franco Berruti, Jennifer McMillan
Status:
Unpublished
Contributions:
iv Chapter 4
Article Title:
Effect of Bed Hydrodynamics and Liquid Vaporization Rate on Agglomerate Properties in a Fluidized Bed
Authors:
Carolina B. Morales M., Tarek J. Jamaleddine, Cedric Briens, Franco Berruti, Jennifer McMillan
Status:
Unpublished
Contributions:
v
Acknowledgments
I would like to thank my supervisors, Dr. Cedric Briens and Dr. Franco Berruti, for their
guidance and support. Their research experience and mentorship has been crucial to
successfully complete this project. Thank you for providing me with a rewarding student
experience, which includes the participation in an international conference in The
Netherlands.
I would also like to thank Syncrude Canada Ltd. and the Natural Sciences and Engineering
Research Council of Canada (NSERC) for their financial support for this project and my
master studies. Special thanks to Dr. Jennifer McMillan and the research team at Syncrude
Canada Ltd. for their contribution in this project through many technical discussions. Your
invaluable knowledge in the field and advice is greatly appreciated.
I also want to extend my gratitude to the community of students and staff at the Institute for
Chemicals and Fuels from Alternative Resources (ICFAR). Special thanks to Dr. Tarek J.
Jamaleddine, post-doctoral fellow, for providing me with valuable technical advices and
assistance in my experimental work. I would also like to extend my appreciation to Rob
Taylor, mechanical technician, for his contribution to my experimental set-up.
Finally, I would like to thank my friends and family for their support and encouragement.
vi
Table of Contents
Abstract ... ii
Co-Authorship Statement... iii
Acknowledgments... v
Table of Contents ... vi
List of Tables ... ix
List of Figures ... x
List of Appendices ... xiii
Nomenclature ... xiv
Chapter 1 ... 1
1 Introduction ... 1
1.1 The Fluid CokingTM Process ... 1
1.2 Mechanism for Agglomerate Formation ... 3
1.3 Physical Properties of Bitumen ... 6
1.4 Objectives of the Research ... 8
1.5 References ... 9
Chapter 2 ... 12
2 Experimental Modeling of Liquid Injection in a Fluidized Bed: Effect of Spray Nozzle Operating Conditions ... 12
2.1 Introduction ... 12
2.2 Experimental Set-up and Methodology ... 15
2.3 Results and Discussion ... 23
2.3.1 Development of the Model ... 23
2.3.2 Testing of the Model in a Large Scale Fluidized Bed ... 26
2.3.3 Effect of GLR on Agglomerate Properties ... 28
vii
2.4 Conclusion ... 33
2.5 References ... 34
Chapter 3 ... 36
3 Effect of Liquid Properties and Spray Nozzle Design on Agglomerate Formation and Liquid Vaporization ... 36
3.1 Introduction ... 36
3.2 Experimental Set-up and Methodology ... 39
3.3 Results and Discussion ... 44
3.3.1 Effect of Liquid Properties on Agglomerate Formation and Liquid Distribution ... 44
3.3.2 Effect of Nozzle Design on Agglomerate Properties and Liquid Vaporization ... 49
3.4 Conclusions ... 59
3.5 References ... 60
Chapter 4 ... 64
4 Effect of Bed Hydrodynamics and Vaporization Rate on Agglomerate Properties .... 64
4.1 Introduction ... 64
4.2 Experimental Set-up and Methodology ... 66
4.3 Results and Discussion ... 70
4.3.1 Effect of Fluidization Velocity on Agglomerate Properties ... 70
4.3.2 Effect of Vaporization Rate on Agglomerate Properties ... 73
4.4 Conclusions ... 79
4.5 References ... 79
Chapter 5 ... 82
5 Conclusions and Recommendations ... 82
5.1 Conclusions ... 82
viii
Appendices ... 85
ix
List of Tables
Table 2-1: Heat of vaporization for different systems ... 15
Table 2-2: Heat of vaporization for AVR from Syncrude Canada Ltd. (i.e. bitumen) and Model Solution... 24
Table 2-3: Wettability of liquid solution determined by the Washburn technique ... 25
Table 2-4: Physical Properties of Model Solution (10% Plexiglas – 80% Acetone – 10% Pentane)... 25
Table 2-5: Operating Conditions for Validation Experiments ... 27
Table 3-1: Physical Properties of Model Solution ... 41
Table 3-2: Effect of Satellite nozzle on liquid vaporization ... 57
x
List of Figures
Figure 1-1: Schematic representation of Fluid CokingTM Process ... 2
Figure 2-1: Schematic Representation of Fluid CokingTM Process ... 12
Figure 2-2: Schematic of the Large Scale Fluidized Bed ... 17
Figure 2-3: Particle Size Distribution of Washed Sand for a 355 µm - 425 µm Size Cut ... 19
Figure 2-5: Comparison of the proposed model (10 wt% Plexiglas – 80 wt% acetone – 10 wt% pentane) with the sucrose solution model. ... 28
Figure 2-6: Repeatability of Methodology used for determination of agglomerate mass and size distribution, ṁ: 30 g/s, Vg: 0.30 m/s ... 29
Figure 2-7: Effect of GLR on the total mass of agglomerates formed ... 30
Figure 2-8: Effect of GLR on the initial liquid concentration in agglomerates ... 30
Figure 2-9: Dissipation time and residual liquid representation ... 31
Figure 2-10: Effect of GLR on vaporization rate by means of dissipation time. Comparison between model solution (10 wt% Plexiglas – 80 wt% acetone – 10 wt% pentane) and solvent only. ... 32
Figure 2-11: Effect of GLR and Agglomerate Formation on Vaporization rate by means of residual liquid. Comparison between model solution (10 wt% Plexiglas – 80 wt% acetone – 10 wt% pentane) and solvent only ... 33
Figure 3-1: Schematic of Fluid CokingTM Process ... 36
Figure 3-2: Cross-Sectional View of TEB Nozzle4 ... 37
Figure 3-3: Schematic of the Large Scale Fluidized Bed ... 40
xi
Figure 3-5: 2.7 mm TEB Nozzle with three 0.40 mm Satellite Jets10 ... 42
Figure 3-6: Mechanism for wet agglomeration in the Fluid CokingTM process... 45
Figure 3-7: Effect of Liquid Properties on Agglomerate Formation ... 47
Figure 3-8: Effect of Physical Properties on Agglomerate Properties ... 48
Figure 3-9: Effect of Physical Properties of the System on Liquid Distribution ... 48
Figure 3-10: Effect of Nozzle Attachment on Agglomerate Formation for 2 w% GLR ... 50
Figure 3-11: Effect of Nozzle Attachment for Different GLR ... 51
Figure 3-12: Effect of nozzle attachment on liquid vaporization (dissipation time) ... 52
Figure 3-13: Effect of nozzle attachment on liquid vaporization (residual liquid) ... 52
Figure 3-14: Effect of nozzle attachment on agglomerate properties ... 53
Figure 3-15: Effect of nozzle attachment on liquid distribution ... 54
Figure 3-16: Effect of Satellite jets on macro-agglomerate mass ... 55
Figure 3-17: Effect of Satellite jets on micro-agglomerate mass ... 56
Figure 3-18: Effect of Satellite jets on agglomerate properties ... 57
Figure 3-19: Effect of Satellite Nozzles on liquid distribution ... 58
Figure 3-20: Effect of Satellite jets on solids entrainment ... 59
Figure 4-1: Schematic representation of the large scale fluidized bed ... 68
Figure 4-2: Effect of fluidization velocity on the formation of Macro-Agglomerates ... 70
Figure 4-3: Effect of fluidization velocity on the formation of Micro-Agglomerates ... 71
xii
Figure 4-5: Effect of fluidization velocity on liquid distribution ... 72
Figure 4-6: Effect of fluidized bed temperature on liquid vaporization ... 73
Figure 4-7: Effect of fluidized bed temperature on agglomerate formation ... 74
Figure 4-8: Effect of bed temperature on total mass of Macro-Agglomerates recovered ... 75
Figure 4-9: Effect of bed temperature on total mass of micro-agglomerates recovered ... 77
Figure 4-10: Effect of liquid vaporization on the initial liquid concentration in the surviving agglomerates ... 78
xiii
List of Appendices
xiv
Nomenclature
GLR: Gas-to-liquid ratio (% wt/wt)
daggl: Agglomerate diameter (µm)
L/S: Liquid-to-solid ratio (g/g)
dpsm: Sauter mean diameter (µm)
ɳ: dynamic viscosity (mPa.s)
Vg: fluidization velocity (m/s)
ṁ: Liquid flowrate (g/s)
mc: mass of clean fines (g)
mp: mass of Plexiglas (g)
maggl,sample: mass of agglomerates in sample (g)
Fvap: Molar flow of vapors (mol/s)
FN2,in: Inlet flow of nitrogen (mol/s)
Tbed: Temperature of fluidized bed (°C)
P: Pressure in the system (Pa)
V: volume of gases (m3)
n: total moles of vapors (mol)
∆P: cyclone pressure drop (Pa)
R: Universal gas constant 8.314 Pa-m3/mol-K
M: Molecular weight of vapors (g/mol)
Tor: Temperature at the orifice (°C)
xout: fraction of vapors leaving the system
xin: fraction of vapors evolving from the fluidized bed
Ao: Initial Agglomerates
Af: Final Agglomerates
ms: flux of solid (kg/s)
ml : Liquid flowrate (kg/s)
mvl: vapors flowrate
Cp: heat capacity (kJ/kg)
Chapter 1
1
Introduction
Nowadays, the limited availability of light to mid-heavy oil reservoirs has resulted in the
production of crude oil from non-conventional feedstocks such as heavy oil and
bitumen1. Bitumen differs from conventional crude oil in its higher molecular weight and
physical transport properties such as density and viscosity, thus making it unsuitable for
pipeline transportation and for processing in conventional refineries. Therefore, it is
necessary to upgrade this kind of heavy oil to produce distillates that can be transported
and processed by conventional refineries2.
Delayed coking and Fluid CokingTM are the most commonly used commercial
technologies for the production of distillates from bitumen through thermal cracking3. In
the Fluid CokingTM process, bitumen is sprayed into a fluidized bed of hot coke particles
that serve as heating medium for the thermal cracking of hydrocarbons. The reaction
takes place in liquid films deposited on the surface of the particles and the product
hydrocarbon vapors rise to the top of the reactor counter-currently to the down-flowing
coke particles. The high viscosity of bituminous feeds facilitates the formation of
agglomerates with a thick liquid film that limits mass and heat diffusion from the
particles, resulting in a decrease in liquid yield and increased production of undesired
coke4, 5.
This section includes an overview of the Fluid CokingTM process and its associated
agglomeration phenomena. Furthermore, the theory required for the development of a
new experimental model applied to this process is presented here, to provide the
background needed to fully understand its technical challenges and the experimental
approach taken in this study.
1.1
The Fluid Coking
TMProcess
A Fluid Coker consists of a circulating fluidized bed of coke particles acting as the heat
heavy oil feedstock with 0° - 20° API6. When this process is used for bitumen upgrading,
the feed oil is pre-heated to temperatures of 300 to 400 °C to make it flowable and
injected with steam into the fluidized bed through several two-phase spray nozzles
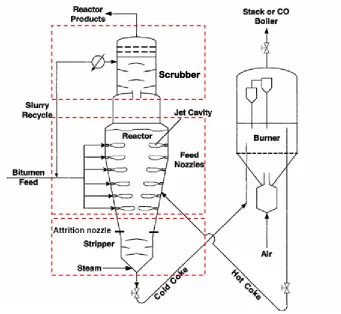
located at different axial and radial positions in the reactor section7. Figure 1-1 shows a
diagram of the Fluid Coker where three main zones can be identified: a reactor section,
where cracking and devolatilization of heavy hydrocarbon compounds take place, a
scrubber section at the plenum of the reactor, and a stripper section of reduced diameter
located at the bottom of the unit.
Figure 1-1: Schematic representation of Fluid CokingTM Process8
Reaction takes place in a dense vapors-solids suspension at temperatures between 500
and 530 °C to produce permanent gases, oil vapors and coke. The permanent gases and
vapor products are mixed with the steam used for fluidization and flow upward through a
dilute phase freeboard, entraining some coke particles, which are recovered from the gas
phase by cyclones and are returned to the bed through diplegs8. The product stream Scrubber
exiting the cyclones enters the scrubber section, where the heavier compounds are
condensed and recycled to the dense fluidized bed, while the lighter gases and vapors
continue on to the fractionation section (not shown in Figure 1-1) where they are
condensed to undergo further processing6.
Depending on the effectiveness of the initial liquid-solid contact in the dense suspension,
agglomerates of bitumen and coke particles may form and will descend with the rest of
the coke particles or, if excessively large, more rapidly segregate downward to the
stripper section. The coke particles then grow larger as the coke byproduct of the
hydrocarbon cracking reactions deposits on their surface. Supersonic steam attrition
nozzles are used to maintain the particle size within the optimum range for good process
operability. The stripper section uses steam to displace the hydrocarbon vapors from the
voids in-between the downflowing particles, and the dry coke particles, free of
hydrocarbons, are then sent to the burner drum, where they are re-heated from 480 to 700
°C and then recycled to the reactor7.
1.2
Mechanism for Agglomerate Formation
Particle wetting and agglomerate formation have been previously described through two
main mechanisms9:
1. In wetting by distribution, liquid droplets distribute on the surface of the particles
and initial nuclei result from successful collision between wetted particles and
wetted and dry particles, provided that certain energetic conditions are met. This
type of mechanism predominates when the droplets mean size and the particle
size are within the same range10. Therefore, this mechanism is promoted when the
droplet size is minimized through an optimum nozzle design, a reduction in liquid
viscosity or a high flowrate of atomization gas, for example
2. In wetting by immersion, initial nuclei are formed when a large droplet captures
individual particles on its surface due to capillary forces11.
In wetting by distribution, rather than wetting by immersion, the wettability of the
system plays a significant role on agglomerate growth. Agglomerates are formed more
easily if the surfaces of colliding particles are uniformly wet12. Otherwise, some of the
be formed. It is, therefore, expected that liquids displaying low contact angles with the
solid surfaces will facilitate this agglomeration mechanism.
Once nuclei are formed, agglomerates might growth from a balance between coalescence
and breakage, due to the shear forces in the fluidized bed. The resulting agglomerate is a
function of the strength of the initial aggregate formed which, in turn, depends on the
amount and distribution of binding material holding the particles together. If these
aggregates are strong enough, agglomerate growth will be dominated by coalescence of
individual particles, whereas if the aggregates are weaker, they will exhibit significant
fragmentation.10
In the Fluid CokingTM process, bitumen is injected together with steam through specially
designed spray nozzles to form fine droplets that maximize liquid-solid contact and
reduce agglomerate formation. The objective is to achieve a droplet size of 200 to
300 µm7 and most of the agglomeration taking place is believed to occur via wetting by
distribution at the end of the jet cavity created by the steam-bitumen sprays11. Given the
high, average, concentration of dry particles in Fluid Cokers, it is expected that, in this
particular case, agglomeration may also result from collisions between wet and dry
particles, as the wet particles move from the tip of the jet cavity to the relatively dry bed.
Moreover, due to the wide size distribution of coke particles in the Fluid Coker, some
nuclei might also result from wetting by immersion of the particles. A more complex
situation occurs when several small droplets hit the same area in quick succession: the
droplets may then coalesce and capture several particles, combining wetting by
distribution with wetting by immersion.
Gray et al.12 proposed a mechanism for agglomerate formation in the Fluid CokingTM
process composed by three main steps: in stage 1, liquid feed is introduced in the form of
gas-atomized droplets in the fluidized bed and form a gas-liquid jet that entrains particles
from the bed. Then, liquid droplets wet particles and agglomerates are formed in stage 2,
which can break-up in stage 3, due to bed hydrodynamics and constant vapor evolution,
resulting in smaller granules coated by a liquid film. However, the exact mechanism and
Darabi et al.13 developed a mathematical model to describe the agglomerating outcome
when bitumen droplets collide with coke particles and considered that agglomerates form
when coke particles coated with a uniform bitumen film of a certain thickness collide,
provided that specific conditions are met for successful collision to occur. Although their
model incorporated the time-dependence of the physical properties of bitumen, breakage
of agglomerates in stage 3 as proposed by Gray et al.12 was not considered and a
maximum agglomerate size was estimated without considering successful agglomeration
between non-wetted particles.
Using X-ray movies of a gas-liquid spray interacting with a fluidized bed, Ariyapadi et
al.14 showed that wet agglomerates are formed near the tip of the spray jet cavity, where
the liquid droplets meet with solid particles entrained through the jet and particles from
the dense, emulsion phase of the fluidized bed. Ariyapadi et al.15 developed a theoretical
model to show that enhancing the mixing of entrained particles and liquid droplets within
the jet cavity resulted in drier and weaker agglomerates; this was confirmed with
experiments using a draft tube that enhanced radial mixing within the jet cavity.
Weber et al.16 and Parveen et al.17 studied the breakage of manufactured agglomerates in
fluidized beds. They studied the impacts on agglomerate breakage of fluidization
conditions, agglomerate size and shape, and liquid concentration in the agglomerates.
They also investigated the effects of the properties of the constituent liquid and particles,
such as viscosity, wettability, particle size, shape and density. Finally, Weber et al.17
studied the stability of typical coke-bitumen agglomerates in a fluidized bed of coke
particles at reacting conditions and showed there was extensive fragmentation of the
agglomerates during fluidization; they also found that larger and wetter agglomerates
were more stable.
Furthermore, the effect of process variables on the kinetics of agglomerate formation in
the Fluid CokingTM process is still under study. Terrazas-Velarde et al.19 demonstrated
through a micro-scale modelling approach that the size distribution of agglomerates
formed during fluidized bed spray drying is greatly affected by the binder properties, and
fluidization velocity. Therefore, in this study, attention is given to the effect of liquid
properties, process parameters, and spray nozzle operating conditions on the three stages
involved in agglomerate formation in Fluid Cokers.
1.3
Physical Properties of Bitumen
Previous studies have indicated that the main physical properties affecting liquid
dispersion on particles and agglomerate formation are viscosity, surface tension and
wettability, which is characterized with the contact angle20. Surface tension and viscosity
are the main properties governing droplet size and spray quality in liquid atomization,
while wetting of the particles and spreading on their surface is mainly a function of the
contact angle21. It is then necessary to review these properties for bitumen at operating
conditions and use these values as a reference for the development of a new experimental
model that can mimic liquid dispersion on fluidized particles from gas atomized spray
nozzles.
In the Fluid CokingTM process, bitumen is injected at temperatures 300 – 400 °C through
steam atomized nozzles. There is limited information on the accurate value for the
viscosity of bitumen, due to the complexity associated with using current measurement
techniques at elevated temperatures. However, it has been observed that bitumen
viscosity is highly sensitive to temperature and reaction time. Aminu et al.22 measured
the viscosity of non – reacting Athabasca Vacuum Residue (AVR) bitumen provided by
Syncrude Canada Ltd. at 180 °C and 270 °C, reporting values of 270 mPa.s and 150
mPa.s, respectively. The authors extrapolated these data and reported a value for bitumen
viscosity at 400 °C in the range of 1 – 2 mPa.s. Other authors have reported bitumen
viscosity at injection condition in the range of 3 – 4 mPa.s11, 20 which could be associated
to the viscosity at a lower temperature between 300 – 350 °C.
Once bitumen reaches 400 °C upon contact with the hot coke particles and the cracking
reactions and devolatilization of the product start to occur, bitumen viscosity increases
sharply with reaction time. Aminu et al.22 also found that bitumen viscosity increased by
four orders of magnitude, from its initial value of 1 – 2 mPa.s, to values in the order of
associated with the evaporation of lighter compounds in the feed and the cracking
reactions resulting in a liquid film of much heavier and highly viscous hydrocarbon
compounds.
On the other hand, the surface tension of bitumen is less sensitive to temperature at non –
reacting conditions. However, some differences have been observed between dynamic
and equilibrium surface tension. In this study, bitumen injection and rapid contact with
the particles is believed to occur before bitumen reaches equilibrium conditions. Li et
al.21 studied the effect of temperature on the dynamic surface tension of nitrogen–
saturated AVR bitumen from Syncrude Canada Ltd. The authors found that bitumen
surface tension reaches equilibrium only after several hours and a linear relationship
between the dynamic surface tension (γDyn) and the temperature was given by:
= 30.44 − 0.0376 (1.3)
Using Equation 1.3, the surface tension of bitumen can be then estimated in the range of
15.40 - 19.16 mN/m for temperatures of 300 to 400 °C. The authors also found that
oxidation of bitumen with air or oxygen increases the surface tension of bitumen by 4%,
resulting from changes in the distribution of polar groups upon oxidation. This effect of
bitumen oxidation on the surface tension should be considered when running experiments
in lab facilities where nitrogen–saturation conditions are not as well controlled as in the
reactor unit.
Aminu et al.22 also studied the surface tension of Athabasca bitumen at reacting
conditions and, unlike viscosity dependence with reaction time, they found that the
surface tension of bitumen was not affected by the extent of the reaction. Experiments
were conducted at temperatures 400 – 530 °C and extrapolation of their values to lower
temperatures were in good agreement with the results reported by Li et al.21.
Wettability data for bitumen and coke are not available in the literature. To the best
knowledge of the author, there is no direct measurement of the contact angle between
bitumen and coke at temperatures of 300 – 400 °C. McDougall et al.20 studied the effect
diameter of 135 µm, as the ones encountered in Fluid Coker. It was observed that for a
liquid viscosity above 4 mPa.s, coke particles will always form agglomerates, regardless
of the contact angle. However, as the liquid viscosity decreases below 4 mPa.s, as it is
expected for bitumen at injection conditions, higher contact angles are needed for the
formation of agglomerates, with a contact angle of 30° – 40° needed to form
agglomerates of coke particles with a liquid viscosity close to 1 mPa.s.
When bitumen is injected in the Fluid Coker, the liquid jet is characterized by high
velocities and bitumen droplets are believed to contact and wet entrained particles before
they can reach higher temperatures. Then, a liquid viscosity at temperatures of 300 – 400
°C is considered in this study and, based on the agglomerating tendency of coke particles
presented by McDougall et al.20, a contact angle higher than 0° is expected for bitumen
and coke at operating conditions.
1.4
Objectives of the Research
This thesis focuses on the development of a new experimental model than can be used to
simulate in a lab facility the complex and interacting phenomena involved when bitumen
is injected through steam atomized nozzles into a fluidized bed of hot coke particles.
Efforts were concentrated on the development of a system that can be used at near
ambient conditions and with scaled-down but realistic spray nozzles. This work has been
divided in three sections:
Paper 1 (Chapter 2): A new model system comprised of a liquid solution and a solid is developed based on the physical properties of bitumen and coke at operating conditions,
as reported in the literature. The model is tested in a large scale fluidized bed using a
scaled down version of an industrial spray nozzle to study the effect of its operating
conditions on the liquid distribution, agglomerate properties, and liquid vaporization.
Paper 2 (Chapter 3): Given the uncertainty in the physical properties of bitumen at injection conditions, this paper investigates the effects of liquid viscosity and wettability
on agglomerate properties. The model is then extended to study the effect of spray nozzle
Paper 3 (Chapter4): The proposed model is used to study the effect of bed hydrodynamics and bed temperature on the agglomerating phenomena observed in the
Fluid CokingTM process. The results obtained are expected to provide valuable
information needed for a more systematic modeling of agglomerating mechanism, and its
effect on the kinetics of thermal cracking of bitumen.
1.5
References
1
Deemter, J. J., “The countercurrent flow model of has-solids fluidized bed”, Netherland
University press, 1967
2
Darabi, P., “Mathematical modeling of interaction of wet particles and application to
fluidized beds”, University of British Columbia, Phd Thesis, 2006
3
Li, T., Grace, J., Bi, X., Reid, K., Wormsbecker, M., “Numerical investigation of fluid
coking units, part II: hydrodynamics of a scaled cold flow model”, The Canadian Journal
of Chemical Engineering, 2012, 90, 457 – 471
4
House, P. K., Saberian, M., Briens, C. L., Berruti, F., and Chan, E., “Injection of a
Liquid Spray into a Fluidized Bed: Particle-Liquid Mixing and Impact on Fluid Coker
Yields”, Ind. Eng. Chem. Res., 2004,43, 5663-5669
5
Radmanesh, R., Chan, E., Gray, M. R., “Modeling of mass transfer and thermal cracking
during the coking of Athabasca residues”, Chemical Engineering Science, 2008, 63, 1683
– 1691
6
Pfeiffer et al., “Fluid coking of heavy hydrocarbons”, US Patent 2881130, 1959
7
Chan, E., Davuluri, R., Kiel, D., Knapper, B., McMillan, J., Mueller, E., Tyler, J., “Fluid
Injection Nozzle for Fluid Bed Reactors”, US Patent 20120063961 A1, 2012
8
Gray, M., “Upgrading of Petroleum Residues and Heavy Oil”, M. Dekker: New York,
9
Schaefer, T., Mathiesen, C., “Melt pelletization in a high shear mixer. XI. Effect of
binder particle size”, International Journal of Pharmaceutics, 1996, 139, 139 – 148
10
Johansen, A., Schæfer, T., “Effects of interactions between powder particle size and
binder viscosity on agglomerate growth mechanisms in a high share mixer”, European
Journal of Pharmaceutical Sciences, 2001, 12, 297–309
11
House, P., “Interaction of Gas-Liquid Jets with Gas-Solid Fluidized Beds: Effect on
Liquid-Solid Contact and Impact on Fluid Coker Operation”, University of Western
Ontario, PhD. Thesis, 2007
12
Gray, M. R., “Fundamentals of Bitumen Coking Processes Analogous to Granulations:
A Critical Review”, The Canadian Journal of Chemical Engineering, 2002, 80, 393 –
401
13
Darabi, P., Pougatch, K., Salcudean, M., Grecov, D., “Agglomeration of
Bitumen-Coated Coke Particles in Fluid Cokers”, International Journal of Chemical Reactor
Engineering, 2010, 8, A122
14
Ariyapadi, S., Holdsworth, D. W., Norley, C. J. D., Berruti, F., Briens, C., “Digital
X-ray Imaging Technique to Study the Horizontal Injection of Gas-Liquid Jets into
Fluidized Beds”, International Journal of Chemical Reactor Engineering, 2003, V.1,
A56
15
Ariyapadi,S., McMillan, J., Zhou, D., Berruti F., Briens, C., Chan E., “Modeling the
mixing of a gas–liquidspray jet injectedin a gas–solid fluidized bed: The effect of the
draft tube”, Chemical Engineering Science, 2005, 60, 5738 – 5750
16
Weber, S., “Agglomerate Stability in Fluidized Beds”, University of Western Ontario,
PhD. Thesis, 2009
17
Parveen, F., Briens C., Berruti, F., McMillan, J., “Effect of particle size, liquid content
and location on the stability of agglomerates in a fluidized bed”, Powder Technology,
18
Weber, S., Gray, M. R., Briens, C., Berruti, F., Chan, E., “Stability of Coke-Bitumen
Agglomerates at Non-Reacting and Reacting Conditions in a Fluidized Bed”, Submitted
to Fuel, 2013
19
Terrazas-Velarde, K., Peglow, M., Tsotsas, E., “Stochastic simulation of agglomerate
formation in fluidized bed spray drying: A micro-scale approach”, Chemical Engineering
Science, 2009, 69, 2631 -- 2643
20
McDougall, S., Saberian, M., Briens, C., Berruti F., Chan, E., “Effect of liquid
properties on the agglomerating tendency of a wet gas–solid fluidized bed”, Powder
Technology, 2005, 149, 61– 67
21
Li, X-S., Elliott, J.A.W., McCaffrey, W.C., Yana, D., Li, D., Famulak, D., “Dynamic
surface tensions of Athabasca bitumen vacuum residue including the effect of dissolved
air”, Journal of Colloid and Interface Science, 2005, 287, 640–646
22
Aminu, M. O., Elliott, J. A. W., McCaffrey, W.C, Gray, M. R., “Fluid Properties at
Chapter 2
2
Experimental Modeling of Liquid Injection in a Fluidized
Bed: Effect of Spray Nozzle Operating Conditions
2.1
Introduction
In the Fluid CokingTM process, bitumen is sprayed through a series of steam atomized
spray nozzles into a fluidized bed of recirculating hot coke particles. These particles act
as the heating medium for thermal cracking of large hydrocarbon compounds at a
temperature range between 500 – 530 oC, to produce a range of distillate products and
coke as a by-product1. The by-product coke is deposited on the particles and, as a result,
they grow in size. Once the coke particles reach the bottom of the reactor section, they
enter the stripping section where they are exposed to high velocity steam jets which,
through attrition, break large agglomerates and reduce the particle size, removing any
hydrocarbon residue that might be trapped within the particles, before they are fed back
to the burner bed. In the burner, the coke particles are reheated through partial
combustion of coke and are fed back to the reactor at its top section. Figure 2-1 shows a
simplified schematic representation of the process.
Unlike the granulation process, where wet agglomeration of particles is desired, in the
Fluid CokingTM process, agglomerate formation is undesirable, since it results in heat and
mass transfer limitations for the production of desired lighter compounds. As a result,
lower liquid yields and higher coke yields are observed when agglomerates with a high
liquid content are formed2.
Several researchers have modeled the effect of agglomerates and agglomerate properties
on heat and mass transfer limitations in the Fluid CokingTM process. House et al.2,
showed that increasing the liquid to solid ratio (L/S) within the agglomerates reduces
significantly the conversion of high boiling point compounds, which in turn results in
higher coke yields. Similarly, Gray et al.3 proposed a model to estimate the effect of mass
transfer limitations on the liquid and coke yields, based on the relationship between the
thickness of the liquid film and the diffusional resistance; this model predicted that
thicker films of bitumen on particles would result in a higher coke yield.
Thermal cracking of large hydrocarbon compounds in the bituminous feed is followed by
vaporization of the resulting lighter compounds from the liquid film. Li et al4. showed
that the rate of vapors generation from the hydrocarbons injected in the Fluid Cokers has
a significant impact on the hydrodynamics of the reactor, thus affecting the distribution of
the injected liquid on the fluidized particles. However, their model did not consider
agglomerate formation and breakup, which also affect the vaporization of the liquid.
The formation of agglomerates is a result of the imperfect initial liquid–solid contact,
when bitumen is sprayed through steam atomized nozzles in the fluidized bed of coke
particles. The study of these phenomena at a pilot plant scale level, using bitumen and
steam at reacting conditions, would be impractical, expensive and relatively unsafe. As a
result, different systems have been proposed to simulate, at near ambient conditions, the
phenomena involved in the Fluid CokingTM process when bitumen is sprayed with
specially designed two phase nozzles. In this type of nozzle, atomization of the liquid and
droplet size is a function of liquid flowrate and properties (viscosity, surface tension, and
density), nozzle geometry, gas to liquid ratio (GLR), and fluid turbulence. However, the
involved5. In a Fluid Coker, the bitumen will react, producing a mixture of vapors and
permanent gases and a solid coke deposit on the bed particles.
Among these systems, water and silica sand have been used extensively to mimic liquid
injection in the Fluid CokingTM process using scaled down industrial spray nozzles, due
to the similarity of the viscosity of water at ambient temperature and bitumen at injection
temperature. However, the surface tension of water at ambient conditions (70 mN/m) is
about three times higher than that of bitumen (15 – 20 mN/m), as presented in Chapter 1.
Moreover, agglomerates formed in water – sand systems are easily broken upon drying,
thus limiting this system only to the study of the initial dispersion of liquid within
particles using indirect measurement techniques.
Similarly, coke particles along with an aqueous sucrose solution at ambient temperature
have been used to characterize the initial liquid – solid contact of sprayed droplets on
fluidized bed particles2. In this system, liquid viscosity is adjusted by selecting the proper
sucrose concentration that will result in a similar value as that for bitumen at the injection
temperature. Using this system at ambient conditions, it was possible to obtain stable
agglomerates resulting from the binding action of the sugar upon drying that could be
recovered after injection. These recovered agglomerates provided information on the size
distribution of initial agglomerates and their liquid content. However, the high latent heat
of vaporization of water was of concern for this model (Table 2-1). At ambient
temperature, the evaporation of water is too slow to simulate the rapid evolution of
vapors and gases in Fluid CokingTM, which may have an impact on the formation and
stability of agglomerates.
The sucrose solution was then used in a bed of coke particles at a much higher
temperature in order to mimic the coke formation by caramelizing the sucrose content in
the solution6. The fast evaporation of water also simulated the evolution of vapors and
gases in Fluid CokingTM, although the high latent heat of vaporization of water was still
of concern as it was further increased due to the heat required to bring the liquid to the
bed temperature, as shown in Table 2-1. Furthermore, there is an extra heat required for
once the sucrose was caramelized, much of the resulting caramel became insoluble and it
was no longer possible to obtain information on the liquid content of the agglomerates.
The objective of the present study is to develop a new experimental model to simulate, at
near ambient conditions, the phenomena that occur when bitumen is injected in a Fluid
Coker. Such a model could be used, for example, to determine the effect of spray nozzle
operating conditions on agglomerate formation and liquid distribution within the
agglomerates.
Table 2-1: Heat of vaporization for different systems
Bitumen
TB: 530 °C
Water
TB: 21 °C
Water
TB: 250 °C
Energy required to heat the liquid from injection
temperature to bed temperature (kJ/kg) 544 0 492
Latent Heat of Vaporization (kJ/kg) 430 2441 2441
Heat of Reaction (kJ/kg) 178 - unknown
Total (kJ/kg) 1152 2441 2933
2.2
Experimental Set-up and Methodology
Experiments were performed in a large scale fluidized bed with a rectangular cross
section of 1.2 m by 0.15 m and an expansion zone with a section of 1.2 m by 0.47 m at a
height of 1.5 m from the ground (Figure 2-2). The unit was operated at 68°C with 150 kg
of silica sand particles with a Sauter mean diameter of 210 µm, fluidized at a superficial
gas velocity in the bottom section of 0.3 m/s resulting in an expanded bed height of
0.68 m. The liquid solution proposed for this new model is a mixture of acetone, pentane
and Poly(methyl methacrylate) (PMMA) purchased from McMaster Carr, a polymer resin
commonly known as Acrylic or PlexiglasTM. This mixture of solvents was selected as it
provided a lower latent heat of vaporization as it will be described in section 2.3. The
liquid was injected horizontally in the dense fluidized bed, at 0.38 m above the distributor
plate at 30 g/s for 42 s. This injection time was selected to reach steady-state evaporation
this liquid flowrate, the pressure on the liquid tank, shown as P2 on Figure 2-2, was
adjusted by regulating the pressure of nitrogen from the main line. In this study, a scaled
down version of an industrial nozzle used in the Fluid CokingTM process, known as a
TEB nozzle7, was employed, having an internal diameter of 2.7 mm and using nitrogen at
ambient temperature for atomization. In this case, the pressure on the atomization line,
shown as P1 on Figure 2-2 was adjusted to obtain a specific atomization gas flowrate,
expressed as GLR or Gas-to-Liquid Ratio (wt/wt). The unit was equipped with two
cyclones in series, and the first cyclone recycled its collected fines to the bed through a
dip-leg, while the fines collected by the secondary cyclone were recovered externally.
The bed was kept fluidized at minimum fluidization conditions for 10 min after each
liquid injection in order to dry the bed while preserving the initial size distribution of the
agglomerates. One sample port at the bottom of the unit allowed for the recovery of the
bed material along with the agglomerates for further processing. Then, the collected bed
mass was classified into three major groups:
- Macro-agglomerates: agglomerates recovered from the bed mass after injection
having a diameter 600 µm < daggl < 9500 µm
- Micro – agglomerates: agglomerates recovered from the bed mass after injection
having a diameter 355 µm < daggl < 600 µm
- Individual bed particles: all particles having diameter less than 355 µm
Macro-agglomerates were recovered by sieving the entire bed mass with the desired sieve
size, since there were no initial bed particles with a diameter greater than 600 µm. The
PlexiglasTM concentration in these agglomerates was obtained by breaking up the
agglomerates and using a Soxhlet extraction apparatus with acetone as a solvent to
dissolve the PlexiglasTM binder. Gravimetric analysis of the sample using a balance with
an accuracy of 0.1 mg provided the mass of PlexiglasTM that had been dissolved. In order
to determine the dissolution time required to completely dissolve the PlexiglasTM in the
agglomerates, the samples were re-processed until no difference in the mass of the
moisture analyzer in subsequent washes verified that no dissolved PlexiglasTM was
present. Once the amount of PlexiglasTM in the original solids sample was determined,
the amount of liquid initially trapped in the agglomerates was calculated by mass balance,
knowing the initial concentration of PlexiglasTM in the injected liquid.
Figure 2-2: Schematic of the Large Scale Fluidized Bed
On the other hand, the size of micro-agglomerates falls within the size range of individual
particles originally present in the silica used for the experiments. Then, fines trapped in
these agglomerates were used as tracers to estimate the total mass of micro-agglomerates
formed during the injection. In this case, once the bed mass had been sieved to recover
macro-agglomerates, a representative sample from the bed mass below 600 µm was taken
and processed with the same Soxhlet extraction apparatus described above. Particle size
distribution of this sample was obtained using a laser diffraction method (HELOS of
Sympatec), which provided information on the concentration of fines that were released
upon dissolution of the liquid binder. The procedure involved three main steps:
1. Recovery of micro-agglomerates
Once the bed mass was sieved to recover macro-agglomerates (i.e. particles bigger than
600 µm), a representative sample was taken from the bed mass below 600 µm and sieved Fluidization gas
Exhaust
Secondary cyclone
Differential Pressure Transducer and thermocouples Pressurized
nitrogen
Atomizer Pressurized
nitrogen
Sonic nozzles
Model solution
P1 P3
P2
to be classified into three size cuts: 355 µm < dp < 425 µm, 425 µm dp < 500 µm and
500 µm dp < 600 µm. Each of these size cuts contained individual particles originally in
the sand, along with micro-agglomerates formed during the experiments.
2. Determination of mass of PlexiglasTM in the agglomerates
Samples were processed using a Soxhlet extraction apparatus with acetone as a solvent to
dissolve the PlexiglasTM binder. The washed particles were then dried. Gravimetric
analysis of the sample using a balance with an accuracy of 0.1 mg provided the mass of
dried washed sand particles (msample) and the mass of PlexiglasTM that was been dissolved
(mp).
3. Determination of the mass of fine particles in the agglomerates
If the above mentioned size cuts are defined within a size limit from dpL to dpH, where
each limit represent the smallest and biggest particle size for a given size cut,
respectively, particles with a diameter below dpL would have gone through the screen
during the sieving process unless agglomerated. Then, if Figure 2-3 represents a particle
size distribution (PSD) of the sample once step 2 has been completed, the concentration
of fines (i.e. dp < dpL) in the sample can be determined from the PSD analysis.
Given the weight fraction of fines in the sample (xf), and the weight fraction of fines
originally in the bed mass, the mass of fines (mc) was calculated as:
= ×
(2.1)
where xfbed is the weight fraction of fines in the bed. This assumes that there is no
segregation in the way the different individual sizes of the bed particles are trapped
within an agglomerate.
Then, knowing that the agglomerates are formed from sand and PlexiglasTM only, the
mass of agglomerates in the sample was calculated from the mass of PlexiglasTM (mp)
, = + (2.2)
This quantity represents the mass of micro-agglomerates for a given size cut in the
sample. Then, the total mass of agglomerates was calculated as:
,#$#= ,
×
%&''%(
× ')**+ (2.3)
Particle Size (µm)
0 200 400 600 800
C
u
m
w
t%
o
f
P
a
rt
ic
le
s
0 20 40 60 80 100
Figure 2-3: Particle Size Distribution of Washed Sand for a 355 µµµµm - 425 µµµµm Size
Cut
Finally, differential pressure measurements between the freeboard and the outlet of the
secondary cyclone were taken during the injection and the drying period. A simple flow
model was developed as a first attempt to estimate the rate of injected liquid being
1. Ideal gas behavior
This assumption allowed determination of the total number, ɳ, of gas moles in the
column, including nitrogen and solvent vapors, considering the voids in between the
particles. Then, a molar balance in the system is expressed as:
,-+ ,./,0 = 1,-+ ,./2$3#+
45
46 (2.1)
Using the ideal gas law, the accumulation term was calculated as:
7 =:89 ⇒
45
46 =:9 48
46 (2.2)
The unit is discharging through the cyclones to the constant atmospheric pressure (Pop).
Then, the variation of pressure with time can be expressed as:
8 = 8$+ ∆8 (2.5)
48
46 =4∆846 (2.4)
Substituting this expression in Equation 2.1 results in:
45
46 =:9 4∆8
46 (2.5)
Combining Equations (2.1) and (2.5) gives the final expression for the molar mass
balance expressed as:
,- + ,./,0 = 1,-+ ,./2$3# +:9
4∆8
46 (2.6)
Note that vaporization of liquid in the bed will have an essentially instantaneous effect on
the measured ∆P as the number of gas moles in the freeboard will increase
2. Orifice pressure drop
The standard correlations for cyclone pressure drop show that it is proportional to the gas
density and the square of the gas flowrate9. This can be expressed as:
∆8 =,>?8 (2.7)$@
Then, if the above equation is used for the case of nitrogen as fluidization gas, this gives
the pressure drop before the liquid is injected:
∆8$ =,./,0 > ?
$@
8 (2.8)
Temperature measurements across the cyclones indicated a nearly constant value during
each experiment. Then, combining Equations (2.7) and (2.8), the following expression for
the flowrate of vapors leaving the unit was obtained:
∆8 ∆8$ = B
,$3#, ,./,0C
> B??
./C (2.9)
,$3# = ,./,0 E
∆8 ∆8$
?./
? (2.10)
In the above expression, M is a function of the gas composition. If xout represents the mole
fraction of vapors across the cyclones, it can be expressed as:
? = $3#?+ (1 − $3#)?./ (2.11)
? = ?./F1 + G
?− ?./
? H $3#I (2.12)
In order to determine the mole fraction of vapors in the cyclones (xout), a plug flow model
was assumed to find the oldest gas going through the cyclones, which corresponds to the
fraction of vapor generated in the bed at a given earlier time called tB. Then,
$3#(6) = 0 (6J) (2.13)
From ideal plug flow, ∆ɳ moles leave the bed at a time interval ∆t, and the total number
of moles can be calculated as,
5 = K ∆5 #
#L
(6J)46 (2.14)
Re-writing Equation (2.14) as a function of the molar flowrate evolving from the
fluidized bed results in
5 = K ,0 #
#L
46 (2.13)
where Fin represents the total molar flowrate, including nitrogen and solvent vapors.
Since the flowrate of nitrogen used for fluidization is constant, Equation 2.13 can also be
expressed as,
5 = K 1,./,0+ ,-2
#
#L
46 = (6 − 6J),./,0 + K 1,-2
#
#L
46 (2.14)
Given that ideal gas law is assumed in this model, Equation 2.14 can also be written as:
89
: = (6 − 6J),./,0 + K 1,-2 #
#L
46 (2.15)
Then, the calculation procedure was as follows:
- Determine the value of tB that satisfies Equation (2.15)
- Use this value of tB to determine the fraction of vapors going through the cyclones
- Combine Equations (2.6), (2.10), and (2.12) to calculate the flowrate of vapors
evolving from the bed surface.
2.3
Results and Discussion
2.3.1
Development of the Model
In the present work, an experimental model applicable to the Fluid CokingTM process was
developed in order to overcome some of the limitations of previous models to study the
effect of process parameters on agglomerate formation, liquid distribution and liquid
vaporization. Then, three main phenomena involved in the Fluid CokingTM process were
considered:
- Initial liquid distribution upon spraying in the fluidized bed
- Agglomeration
- Liquid vaporization
In these processes, the physical properties of the liquid play an important factor.
Therefore, a system whose properties were similar to bitumen and coke at operating
conditions had to be identified. Furthermore, given the uncertainty on the properties of
bitumen at injection conditions, it was also desirable to select a model that provided the
flexibility needed to study the above mentioned phenomena under the range of values
available in the literature for the industrial process of study.
In Fluid CokingTM, bitumen acts as a liquid binder for the agglomeration of coke particles
through a similar mechanism as the one observed in conventional granulation processes10.
It has been reported in the literature that 10 to 20 wt% of the bitumen injected in a Fluid
Coker produces a new layer of coke on the surface of the existing coke particles11, 12.
Then, in the proposed model, the concentration of the PlexiglasTM used as a dissolved
binder was initially selected so that the amount of solid residue that remained on the
particles upon vaporization of the liquid was similar to the coke yield observed in the
industrial process (i.e. 10 – 20 wt%).
PlexiglasTM was dissolved in a mixture of acetone and pentane, which was selected for
1) It provides a solution with a low heat of vaporization as shown in Table 2-2,
where the main difference with respect to the Fluid CokingTM system is due to the
higher energy required to increase the temperature from injection to reacting
conditions. The impact of this higher energy could be studied, in the future, by
chilling the model solution before it is injected.
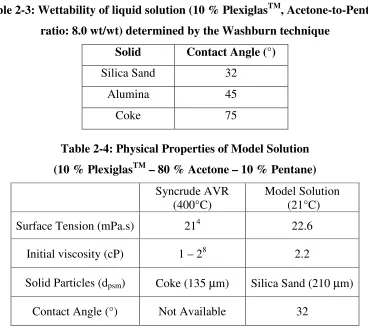
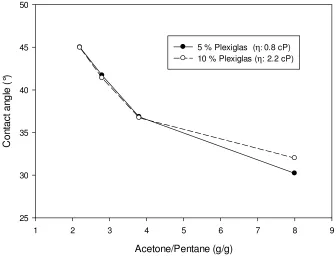
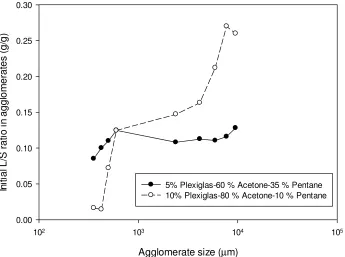
2) The ratio between the solvents can be adjusted to obtain the desired contact angle
(i.e. wettability) for the system. The Washburn technique described in Appendix
A was used to study the effect of the acetone to pentane ratio on the wettability
between the model solution and the silica sand particles. It can be observed from
Figure 2-4 that the PlexiglasTM concentration does not greatly affect the
wettability of the system, unless the acetone-to-pentane ratio is significantly
increased. Moreover, the contact angle can be varied over an even wider range by
using different solids, as shown in Table 2-3. In the present study, a 10 wt% of
PlexiglasTM was selected with an acetone to pentane ratio of 8.0 wt/wt and Silica
Sand particles, as it provided the best wettability for the system. The physical
properties of this solution are presented in Table 2-4.
Table 2-2: Heat of vaporization for AVR from Syncrude Canada Ltd. (i.e. bitumen) and Model Solution (10 wt% PlexiglasTM – 80 wt% Acetone – 10 wt% Pentane)
Syncrude AVR New Model
Energy required to heat the liquid from injection
temperature to bed temperature (kJ/kg) 544 74
Latent Heat of Vaporization (kJ/kg) 430 451
Heat of Reaction (kJ/kg) 178 -
Table 2-3: Wettability of liquid solution (10 % PlexiglasTM, Acetone-to-Pentane ratio: 8.0 wt/wt) determined by the Washburn technique
Solid Contact Angle (°)
Silica Sand 32
Alumina 45
Coke 75
Table 2-4: Physical Properties of Model Solution (10 % PlexiglasTM – 80 % Acetone – 10 % Pentane)
Syncrude AVR (400°C)
Model Solution (21°C)
Surface Tension (mPa.s) 214 22.6
Initial viscosity (cP) 1 – 28 2.2
Solid Particles (dpsm) Coke (135 µm) Silica Sand (210 µm)
Acetone/Pentane (g/g)
1 2 3 4 5 6 7 8 9
C
o
n
ta
c
t
a
n
g
le
(
°)
25 30 35 40 45 50
5 % Plexiglas (η: 0.8 cP)
10 % Plexiglas (η: 2.2 cP)
Figure 2-4: Effect of Acetone-to-Pentane ratio on the wettability of the system as determined from the Washburn technique.
2.3.2
Testing of the Model in a Large Scale Fluidized Bed
The initial experiments were focused on confirming the applicability of the proposed
model for the study of agglomeration phenomena in the Fluid CokingTM process.
Experiments were performed under operating conditions similar to the conditions of
previous studies using the sucrose solution model with caramelization6. The purpose of
these experiments was to compare the impact of the atomization gas flowrate (expressed
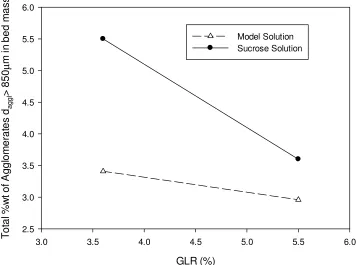
as GLR) in the spray nozzle on the total mass of agglomerates larger than 850 µm.
Figure 2-5 shows that the sucrose model gave a higher total mass of agglomerates than
the proposed model for a given GLR. This could be a result of a higher liquid viscosity
and higher wettability, along with smaller particles for the sucrose solution, as shown on
Table 2-4, which in turn will lead to higher agglomerate population. The larger ratio of
injected liquid mass to bed mass (L/S in Table 2-5) with the sucrose solution also
Table 2-5: Operating Conditions for Validation Experiments
Sucrose Solution6 PlexiglasTM Solution
Spray Nozzle TEB 2.7mm TEB 2.7mm
Solids Coke Silica Sand
Sauter mean diameter 110 µm 210 µm
Liquid viscosity 3 cP 2.2 cP
GLR 3.6 %, 5.5 % 3.6 %, 5.5 %
Liquid Flowrate 30 g/s 30 g/s
Length of Injection 20 s 45 s
Total of liquid injected 600 g 1350 g
Mass of solids 22 kg 250 kg
liquid concentration in fluidized bed (L/S) (wt/wt)
0.0273 0.0054
U - Umf 0.296 0.297
However, as previously indicated, the main objective was to determine the relative
impact of the GLR on the agglomerates mass. Figure 2-5 shows that increasing the GLR
from 3.6 to 5.5 wt% decreases the total mass of agglomerates by 13 wt% with the current
model against 31 wt% with the sucrose model. Increasing the GLR in the spray nozzle
will enhance the liquid-solid contact by decreasing the local L/S in the jet region13.
Lower L/S values means that the liquid wets more particles and, consequently, fewer
agglomerates are formed2. Therefore, these results may be explained by the liquid
concentration in the bed, expressed as L/S in Table 2-4, which was three times higher for
the sucrose model than for the current model, thus giving more opportunity for
GLR (%)
3.0 3.5 4.0 4.5 5.0 5.5 6.0
T o ta l % w t o f A g g lo m e ra te s da g g l > 8 5 0µ m i n b e d m a s s 2.5 3.0 3.5 4.0 4.5 5.0 5.5 6.0 Model Solution Sucrose Solution
Figure 2-5: Comparison of the proposed model (10 wt% PlexiglasTM – 80 wt% acetone – 10 wt% pentane) with the sucrose solution model, ṁ: 30 g/s, Vg: 0.30 m/s.
2.3.3
Effect of GLR on Agglomerate Properties
Further experiments were conducted with the proposed model solution in order to better
understand the effect of the GLR on agglomerate properties. Figure 2-6 shows the
repeatability of the methodology used for determination of agglomerates mass and size
distribution. An average standard deviation of 0.057 wt% was observed for all the size
cuts. Figure 2-7 shows the total mass of agglomerates formed for all the GLR values
tested. The error bars show the variability in the results for two repeated runs. As
expected, increasing the GLR decreases the total mass of agglomerates. These results are
in agreement with findings from Portoghese et al.13, where the effect of GLR on spray
nozzle performance was assessed by means of triboelectric signals from the fluidized
bed. In their work, experiments were conducted using the same spray nozzle geometry as
the one used in the present study, and under similar operating conditions. The authors
suggested that the improvement observed on nozzle performance when the GLR is
entrained into the jet cavity. This in turn will result in better mixing in the jet region,
evidenced in this work by lower liquid concentrations in agglomerates at higher
Gas-to-Liquid ratios (GLR), as shown in Figure 2-8.
Furthermore, Figure 2-8 shows that small agglomerates exhibit a much lower liquid
concentration as compared to bigger agglomerates. This can be explained by the
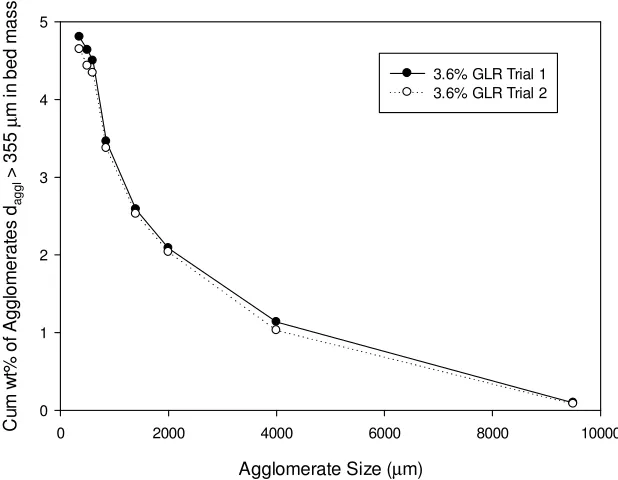
proportion of the dry outer layer with respect to the inner liquid voids expected on the
agglomerates, which seems to have a higher effect for small agglomerates.
Figure 2-6: Repeatability of Methodology used for determination of agglomerate mass and size distribution, ṁ: 30 g/s, Vg: 0.30 m/s
Agglomerate Size (µm)
0 2000 4000 6000 8000 10000
C u m w t% o f A g g lo m e ra te s da g g l > 3 5 5 µ m i n b e d m a s s 0 1 2 3 4 5
GLR (%)
1 2 3 4 5 6
T o ta l w t% o f a g g lo m e ra te s da g g l > 3 5 5µ m i n b e d m a s s 4.6 4.8 5.0 5.2 5.4 5.6 5.8
2.7mm TEB Nozzle No-Attachment Error bars
Agglomerate Size (µm)
0 2000 4000 6000 8000 10000
In it ia l L /S r a ti o i n A g g lo m e ra te s ( g /g ) 0.00 0.05 0.10 0.15 0.20 0.25 0.30
2% GLR daggl > 600 µm
3.6% GLR daggl > 600 µm
5.5% GLR daggl > 600 µm
2% GLR Micro-Agglomerates 3.6% GLR Micro-Agglomerates 5.5% GLR Micro-Agglomerates
Figure 2-8: Effect of GLR on the initial liquid concentration in agglomerates, ṁ: 30 g/s, Vg: 0.30 m/s
2.3.4
Effect of Agglomerate Formation on Liquid Vaporization
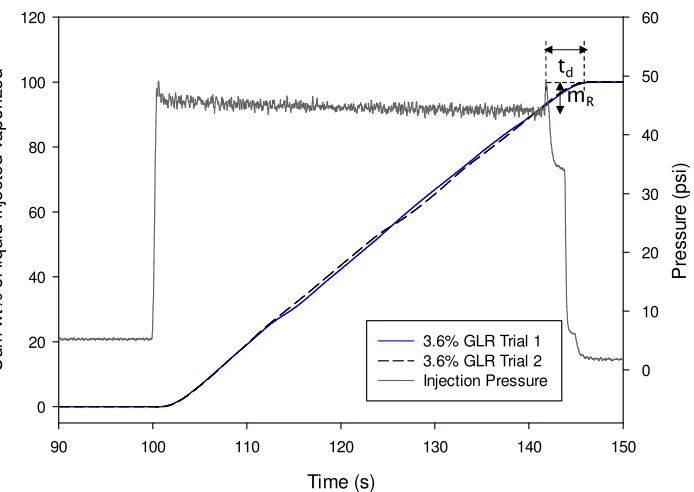
Differential pressure measurements across the cyclones allowed for determination of two
related parameters that characterize the vaporization rate of the liquid. These parameters
are represented in Figure 2-9 and are defined as:
- Dissipation time (td): Time required to completely evaporate the liquid that is left
in the fluidized bed after the end of the injection
- Residual Liquid (mR): Mass of liquid that is left in the fluidized bed after the end
of the injection.
Figure 2-9: Dissipation time and residual liquid representation
In order to study the effect of agglomerate formation on the vaporization rate of the
liquid, experiments were conducted using both pure acetone and the model solution.
Figures 2-10 and 2-11 show a clear increase in both the dissipation time and residual
liquid resulting from the presence of the liquid binder in the model solution. As the GLR
in the spray nozzle is increased and fewer agglomerates are formed, a lower dissipation Time (s)
90 100 110 120 130 140 150
C u m w t% o f liq u id i n je c te d v a p o ri ze d 0 20 40 60 80 100 120 P re s s u re ( p s i) 0 10 20 30 40 50 60
3.6% GLR Trial 1 3.6% GLR Trial 2 Injection Pressure
time and mass of residual liquid are observed. These findings are in agreement with the
theory presented by other authors when looking into the effect of agglomerates and liquid
distribution on heat and mass transfer processes taking place in Fluid Cokers2, 3. The
results also suggest that using a fully vaporizable liquid, without a liquid binder such as
PlexiglasTM, underestimates the effect of agglomerates in the vaporization kinetics, thus
confirming the importance of the use of the binder to better mimic the Fluid CokingTM
process.
Figure 2-10: Effect of GLR on vaporization rate by means of dissipation time. Comparison between model solution (10 wt% PlexiglasTM – 80 wt% acetone – 10
wt% pentane) and solvent only, ṁ: 30 g/s, Vg: 0.30 m/s.
GLR (%)
1 2 3 4 5 6
D
is
s
ip
a
ti
o
n
T
im
e
(
s
)
3.5 4.0 4.5 5.0 5.5 6.0 6.5