ISSN(Online): 2319-8753 ISSN (Print): 2347-6710
I
nternational
J
ournal of
I
nnovative
R
esearch in
S
cience,
E
ngineering and
T
echnology
(A High Impact Factor, Monthly, Peer Reviewed Journal)
Visit: www.ijirset.com Vol. 8, Issue 9, September 2019
Estimating and Diverting the Route by Using
Traffic Data over Big Data
Swathi Rathi
EAS SAP Analytics, Cognizant Technologies, Bangalore, India
ABSTRACT: Present as the population in the world is increasing tremendously day by day at the same time the usage of motorcycles and cars were also increasing in parallel. In this case the traffic on roads is also increased in very large amount. So even to go for a shorter place it is taking long amount of time at specific peak times like at office hours, at school hours etc., .here the user is not able to identify the easiest way for reaching the destination point. To overcome this problem we have proposed the mechanism whereby defining the source point and destination point it will shoes the all the routes with time take to travel and also the shortest route with less or moderate traffic based on the data present on the server. Here for generating the results we have perform the big data analytics over the information which is available on the server.
KEYWORDS: Big data, traffic monitoring, vehicles, user, identification, route.
I. INTRODUCTION
Present days most of the people using the internet and storing there information/personal data over the servers in large volume say peta bytes (PB) to Hexa bytes (HB) per day. So by storing the size of the server is increasing drastically day by day. By next 10 years the size of the data will increase in the servers the data like user/s data, machines data, sensors data, robots data and computation data etc., the data is increasing tremendously so that’s what the name Big Data is derived by rogar.
According to recent survey states that the data in all the domains is increased very rapidly for making several decisions and can make the plan or action based on the past data. According to this survey they have stated that the data in overall servers were created was more than 2.7ZB[1]. This value will increase more than 10 times in next five years. Now it is using in almost all the applications sectors like business, industries, education, stocks etc, with the increase in the large volumes of data to perform any operations on server service providers faced many of the problems such as data storing, data retrieving, data extraction, data removing, data truncating and data deleting. To overcome such types of problems the big data mechanism came into existence. In the big data the overall data was classified into three types namely structured data, semi-structured data and semi structured data. Out of all these only the structured data is defined with all the properties like data type, file name, file size, file type, file created data, file last opened date with time, file last modified date etc.,
As the generations were increasing the data is increasing more in a minute 73 hours of video is being uploaded on YouTube.
Overview of Big-data
ISSN(Online): 2319-8753 ISSN (Print): 2347-6710
I
nternational
J
ournal of
I
nnovative
R
esearch in
S
cience,
E
ngineering and
T
echnology
(A High Impact Factor, Monthly, Peer Reviewed Journal)
Visit: www.ijirset.com Vol. 8, Issue 9, September 2019
Figure1: Overview of Big data
Huge Data is an accumulation of enormous informational collections that can't be sufficiently handled utilizing conventional preparing strategies. Huge information isn't just information it has turned into a total subject, which includes different instruments, systems and structures.
Enormous information term depicts the volume measure of information both organized and unstructured way that adjusted in everyday business condition. It's significant that what associations use with these with the information that issues [3]. Huge information dissects the inside and out ideas for the better choices and vital taken for the advancement of the association. Some of the advantages of big data is Acquision, Assembly, Analyze, Action and Privacy.
II. LITERATURE REVIEW
Much examine around traffic designs in street arranges in a city restricted to few streets as well as constrained size if time arrangement. In this paper, there is an objective if perceiving how the wide ranges of calculations perform. Dublin City offers a chance to profit of demonstrating the differentiating streets.
Toward The Beginning
ISSN(Online): 2319-8753 ISSN (Print): 2347-6710
I
nternational
J
ournal of
I
nnovative
R
esearch in
S
cience,
E
ngineering and
T
echnology
(A High Impact Factor, Monthly, Peer Reviewed Journal)
Visit: www.ijirset.com Vol. 8, Issue 9, September 2019
strategy Kalman Filtering. Kalman altering, one of the most exceptional techniques in present day control hypothesis. This strategy was at first proposed in 1960 by Kalman R.E. Stephanedes (1983) [4] looks at two very settled strategy for foreseeing tracow and volume taken from the Kalman Filter hypothesis and the other is UTCS-2 (Urban trac control framework) [6]. The paper clarifies the numerical applications generally sent today in ascertaining rate and travel time in Urban Trac Control. Advancement of strategies are given to give the readersome foundation on expectation techniques at that point pursues that with an itemized investigation of UTCS-2 utilizing normal forecast blunder and normal mistake. Thus, numerous remote sensor organizes that are introduced in urban areas are measure volume. Calculations dependent on Kalman Theory for state-space control estimates volume to ascertain travel time. These figurings a not 100% precise but rather is a typical strategy which it calculations have been madeed and improved over a significant lot of time and has been acknowledged as the most ideal method for estimating travel time. The purpose behind measure volume and not travel time is to represent traffic sign and vehicles not finishing courses.
Anticipating Time Series
Autoregressive Integrated Moving Average (ARIMA) is the most well-known methodologies taken for determining travel time. In 1983 [5] diagrams the varieties of the ARIMA that can be seen in 2.2.
Investigation into traffic expectation is a typical use case around a period arrangement issue. Autoregressive Integrated Moving Average (ARIMA) and Neural Networks are calculations they seem to perform best around there. For instance in 2008, Dehuai Zeng et el investigates the varieties of the direct model ARIMA and non-straight Neural Network [6] and in 2010claims help vector relapse model (SVR) [7] has been generally used to take care of non-straight time arrangement issues.
The models are Muddied to take into account the irregularity of the purported obscure elements that influence traffic. This is otherwise called ARIMA-GARCH. GARCH [8] is calculations and models that record for the mistakes. A portion of the irregular elements have been explored, for example, climate and street occurrences. The center of most traffic expectation investigation is with time-arrangement information model worked from chronicled information as examined in by Stephanedes (1983)[9].
An investigation in 2008 Dehuai Zeng et[10] el looks at the articial neural system, ARIMA, and a crossover model ANN-ARIMA, Dehuai Zeng et el parametrizes ANN with the ARMA model (BPNN)[11] and the crossover model is an augmentation of BPNN by utilizing its forecasts of mistake terms for the ARIMA model. As innovation has improved, streets systems have better and vehicle security has improved.
The quantity of street episodes diminished and verifiable information can be gotten to simpler making consistency of traffic postpone progressively open to investigate. With this, the ARIMA[12] models have advanced. V. Gavirang a swamy et el takes ARIMA and varieties of the model. The chronicled information from Metro Detroit was collected hourly from the years 2009 to2011. Starting time arrangement diagram demonstrated the nearness of regular information which was perfect for SARIMA. The scoring component utilized was the root mean squared mistake (RMSE)[13]. Using SARIMA[14] the exhibition of the test improved by 5 % over ARIMA. ARIMA-GARCHmodel's anticipated outcome is improved by 40% 2.3. The use of this model can be utilized both for brief time traffic forecast and oline. The age of the model is computationally costly[15]. The utilization of some cutting edge enormous information methods and advancements would be of extraordinary to such usage.
III. EXISTING WORK
ISSN(Online): 2319-8753 ISSN (Print): 2347-6710
I
nternational
J
ournal of
I
nnovative
R
esearch in
S
cience,
E
ngineering and
T
echnology
(A High Impact Factor, Monthly, Peer Reviewed Journal)
Visit: www.ijirset.com Vol. 8, Issue 9, September 2019
Proposed Methodology
We are designing the proposed project by taking the basic things into consideration such as Can smart phones is used for making the decisions on roads?
By storing the historic traffic data over the server can we analyze the traffic on that particular time and date by past years information?
By making the smart phones and connected to mobile data to their service providers can we access/ estimate the situation of the traffic on the particular location?
For our proposed methodology we are taking the Google maps for image identification and for the navigation from one place to another place. Here we are taking the complete big data information in the form of tables.
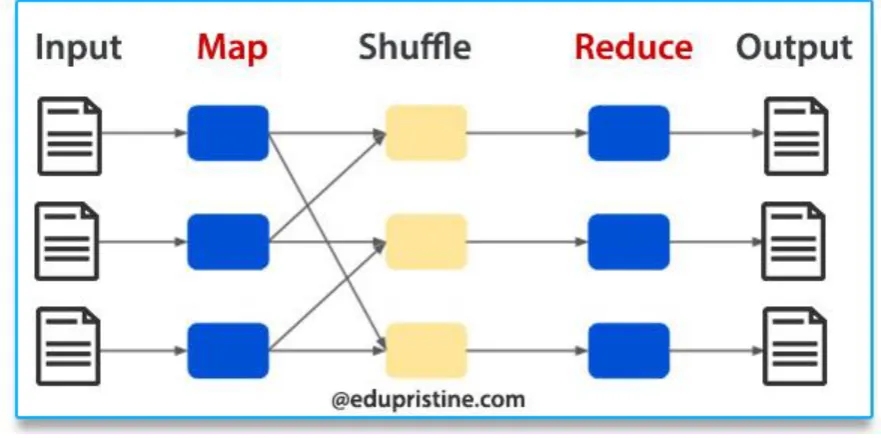
Figure 2: Map reduce architecture
Here we are using the map-reduce mechanism for data filtering and for generating the well structure and best route based on data available on database. Our application works by focusing on two criteria.
Criteria1: For example if we are coming from Hyderabad to Vijayawada at festival time i.e on 8-9-2019 the traffic will be high and this traffic data will store on server and in next year on the same day i.e., 8-9-2020 the application must warn the user regarding the traffic in this area.
Criteria2: If the user wants to travel from one place to another place firstly the user should set the source point and destination point on the application. By that based on the number of devices which are connected to the network it should identify the route from sender station to the receiver station and also by the help of past information too.
For the designing mechanism we have implemented the best designing mash up. For developing our project the main things are data collection and data storage. Data collection is to collect and store the information and the data mash up mechanism is used to make any query operations on the data for performing the project we have done the different operations like:
Data generation. Data collection.
ISSN(Online): 2319-8753 ISSN (Print): 2347-6710
I
nternational
J
ournal of
I
nnovative
R
esearch in
S
cience,
E
ngineering and
T
echnology
(A High Impact Factor, Monthly, Peer Reviewed Journal)
Visit: www.ijirset.com Vol. 8, Issue 9, September 2019 Data mash up or data processing at front end.
Junction data. Routes data. Weather data and Twitter data analysis.
Here at the results we are presenting the results in the different charts, graphs and tabular form all these charts, graphs and tabular form was designed by below mechanisms.
Chart UI. Map UI. Calendar UI.
All these UI(User Interface) was designed for the designing the graph in the pictorial representation.
Figure3: showing the number of devices connected based on mobile data connected to service providers i.e., criteria-2.
As in the criteria 2 as we said we are proposing by taking the users connected to internet by the help of service provider will be taken into consideration. The users information will be taken based on the certain features like user id, device id, device name, device geographical location and so…on.
ISSN(Online): 2319-8753 ISSN (Print): 2347-6710
I
nternational
J
ournal of
I
nnovative
R
esearch in
S
cience,
E
ngineering and
T
echnology
(A High Impact Factor, Monthly, Peer Reviewed Journal)
Visit: www.ijirset.com Vol. 8, Issue 9, September 2019
Device id Device name Device location Device ip address
1234dsdwe5 Dell aspirin 1512 Benz circle 193.258.3.2
4567hgd458 Samsung s9 Benz circle 458.369.2.5
9875fgh432 One plus 7 D.V Manor 254.358.6.9
Table 1: showing the users connected to internet
Here based on the number of devices are online by that we can identify the traffic of that particular route to reach the destination.
ISSN(Online): 2319-8753 ISSN (Print): 2347-6710
I
nternational
J
ournal of
I
nnovative
R
esearch in
S
cience,
E
ngineering and
T
echnology
(A High Impact Factor, Monthly, Peer Reviewed Journal)
Visit: www.ijirset.com Vol. 8, Issue 9, September 2019
IV. RESULTS
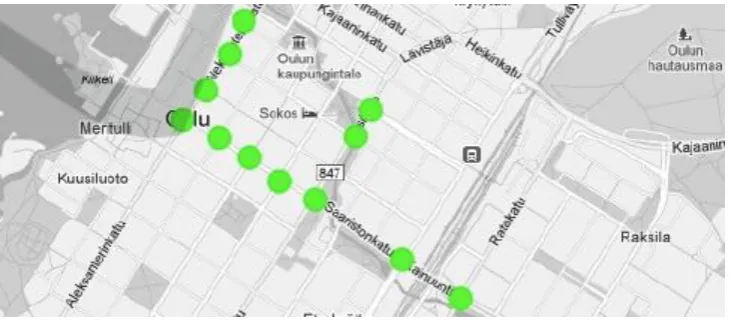
Tovalidatethedecisionmakers'requirementswevisitedtheOulutrafficcontrolcenter.Theyshowedusthe framework they presently use. At that point, we demonstrated to them our mashup for a fundamental assessment. The current system outline historical data-ing traffic reports yet neither graphical nor statistical representations are available, except for black/ white map as the one shown in Figure3, which is a representation of their system we werenot allowed to take pictures. Each point on the map represents an intersection, the color of each intersection only refers to its location.Hence,novisualinformationaboutthetrafficintensityisprovided.Theymustusearepetitivemanualprocesstogetinters ectionhistori-cal information: regarding traffic reports but neither graphical nor statistical representations are available, except for a black/white map which is a representation of their system we were not allowed to take pictures. Each point on the map represents an intersection; the color of each intersection only refers to its location. Hence, no visual information about the traffic intensity is provided. They must use a repetitive manual process to get intersection historical information:
(I) select one intersection from their system, (ii) select the properties they are interested in, (iii) select time/information,
(iv) export data a satable,
(v) import data into a spreadsheet(i.e., Excel),and (vi) Generate graphs using the spreadsheet program.
They must repeat all the above steps if other intersection information is needed. The interviews brought three specific user groups to our attention. The traffic management employees that have to export data to Excel and do manual processing to generate statistics.
ISSN(Online): 2319-8753 ISSN (Print): 2347-6710
I
nternational
J
ournal of
I
nnovative
R
esearch in
S
cience,
E
ngineering and
T
echnology
(A High Impact Factor, Monthly, Peer Reviewed Journal)
Visit: www.ijirset.com Vol. 8, Issue 9, September 2019
Figure 6: Traffic monitoring based on specific time showing by help of graphs
A ton of exertion is required and a framework that enables graphical and real-time factual examination of traffic information is wanted. The traffic cops are keen on a continuous figuring of the traffic since this can help them to place units a head where the majority are moving. Finally, city organizers consider traffic estimation as significant data for city plans.
During our fundamental assessment, we got input from our interviewees. They were excited about our
excessively like and they
hadevenrequestedsimilarimprovementsfortheirtools.Theyprovidedimprovementideasforourvisualization.Forinstance, the traffic the executives workers proposed that our apparatus could be combined with statistical models gauge traffic data. The traffic police officers could combine the information provided by our tool with their mishap database to get more bits of knowledge about traffic consequences. For the traffic city planner, it is important to combine road traffic and pedestrian data in real-time. This provides the opportunity to offer optimal places for companies to set their outlets based on the person on foot traffic around the city.
V. CONCLUSION
ISSN(Online): 2319-8753 ISSN (Print): 2347-6710
I
nternational
J
ournal of
I
nnovative
R
esearch in
S
cience,
E
ngineering and
T
echnology
(A High Impact Factor, Monthly, Peer Reviewed Journal)
Visit: www.ijirset.com Vol. 8, Issue 9, September 2019
I) The planning techniques are utilized to deal with the calculation assets of the cloud-based stage and to make it complete the undertaking of information investigation as quick as would be prudent.
II) different issues, for example, information protection and information security that accompanies crafted by information examination are acquired request subjects which contain guidance to securely store and control the information, how to affirm the information correspondence is ensured, and how to forbid somebody from discovering the data about us. Numerous issues of information security and information protection are basically equivalent to those of the customary information investigation regardless of whether we are entering the enormous information age. Therefore, ensuring the information is the inescapable idea will likewise show up in the exploration of huge information examination.
III) The productive strategies are utilized to diminish the examination, testing, calculation time of information and an assortment of decrease techniques which are assuming a significant job in enormous information investigator
VI. FUTURE WORK
For the future because of the information quality, the number of tests was constrained. Regularity examinations were not tried to represent school occasions over the late spring or winter breaks. In the perception of expectation results the watched areas didn't have any significant bearing any kind of key execution pointer (KPI). The present state applies higher or lowers than anticipated by shading the forecast red or green. A technique for utilizing a shading range to enable the peruse to comprehend the scale the forecast veers off from the real result. More assessment of the calculations, tokenizing systems and scoring of the Twitter trace the classification is important to improve the nature of the outcome. Content mining procedures, for example, Stop Word evacuation and Part-of-Speech would almost certainly improve the classification.
REFERENCES
[1] Duckwon Chung et el. Road tra_c big data collision analysis processing framework. IEEE, 2013.
[2] Vinay Gavirangaswamy et el. Assessment of arima-based prediction techniques for road-tra_c volume. 2013. [3] McCreadie et al. Scalable distributed event detection for twitter. IEEE, 2013.
[4] Kalman R. E. A new approach to linear _ltering and prediction problems. IEEE,1960.
[5] Bei Pan et el. Crowd sensing of tra_c anomalies based on human mobility and social media. IEEE, 2013.
[6] Yousef-Awwad Daraghmi et el. Space-time multivariate negative binomial regression for urban short-term tra_c volume prediction. IEEE, 2012. [7] Sri Krisna Endarnoto et al. Tra_c condition information extraction & visualization from social media twitter for android mobile application. IEEE, 2011.
[8] Executive O_ce of the President. O_ce of science and technology policy. IEEE,2012. [9] Brito et al. Scalable and low-latency data processing with streammapreduce. IEEE,2011.
[10]Pricilla Hancock Kristopher Reese, Russell Bessette. Knowyourcolors: Visual dashboards for blood metrics and healthcare analytics. IEEE, 2013.
[11] Daniel J Tulloch. A garch analysis of the determinants of increased volatility of returns in the european energy utilities sector since liberalisation. IEEE, 2012.
[12] Rohit Dhawan Sven F. Crone. Forecasting seasonal time series with neural networks: A sensitivity analysis of architecture parameters. IEEE, 2007.
[13] Adil Fahad, Najlaa Alshatri, Zahir Tari, Abdullah Alamri, Ibrahim Khalil, Albert Y. Zomaya, Sebti Foufo Abdelaziz Bouras, A Survey of Clustering Algorithms for Big Data: Taxonomy and Empirical Analysis, on Emerging Topics on Computing, IEEE, 11 June 2014.
[14] Alhussein Fawzi, Bei chen, Pascal Frossard, Mathieu sinn, Structured Dimensionality reduction for additive model regression, IEEE Transactions on knowledge and data engineering, 2016, vol: 28, No:6, pp: 1589-1601.
[15] Jun Yan, Benyu Zhang, Ning Liu Shuicheng Yan , Effective and efficient dimensionality reduction for large scale and streaming data preprocessing, IEEE Transactions on Knowledge and data engineering, 2016, Vol:18, issue:3.