Scholarship@Western
Scholarship@Western
Electronic Thesis and Dissertation Repository
8-13-2013 12:00 AM
Understanding the Relationship between Perception and
Understanding the Relationship between Perception and
Production of the Beat
Production of the Beat
Taylor W. Parrott
The University of Western Ontario
Supervisor Dr. Jessica Grahn
The University of Western Ontario
Graduate Program in Neuroscience
A thesis submitted in partial fulfillment of the requirements for the degree in Master of Science © Taylor W. Parrott 2013
Follow this and additional works at: https://ir.lib.uwo.ca/etd
Part of the Cognition and Perception Commons
Recommended Citation Recommended Citation
Parrott, Taylor W., "Understanding the Relationship between Perception and Production of the Beat" (2013). Electronic Thesis and Dissertation Repository. 1434.
https://ir.lib.uwo.ca/etd/1434
This Dissertation/Thesis is brought to you for free and open access by Scholarship@Western. It has been accepted for inclusion in Electronic Thesis and Dissertation Repository by an authorized administrator of
UNDERSTANDING THE RELATIONSHIP BETWEEN PERCEPTION AND PRODUCTION OF THE BEAT
(Thesis format: Monograph)
by
Taylor Parrott
Graduate Program in Neuroscience
A thesis submitted in partial fulfilment of the requirements for the degree of
Master of Science
The School of Graduate and Postdoctoral Studies The University of Western University
London, Ontario, Canada
ii Abstract
Impaired discrimination of sequences with a ‘beat’ in patients with Parkinson’s disease
(PD) suggests the basal ganglia are responsible for the perception, or ‘internal generation’
of the beat in addition to motor timing. As a first step, we examined how young healthy
participants performed on tests assessing perception, internal generation, and motor
production of the beat to determine if a common mechanism guides all three processes
and how this mechanism affects timing. The results suggest that perception, internal
generation and production are controlled by a common timing mechanism. In general, a
strong perception of the beat was associated with good synchronization accuracy (tapping
and walking) and timing accuracy. Thus, previous findings of impaired beat processing in
PD patients may result from deficient beat perception, in addition to or in lieu of deficient
motor timing. Future studies with PD patients are needed to better understand the role of
the basal ganglia in beat processing.
Keywords:Music,rhythm, beat perception, internal generation, beat production, timing
iii
Acknowledgements
I certainly could not have completed my thesis without the encouragement and
support of those around me. First and foremost, I would like to thank my supervisor, Dr.
Jessica Grahn. Thank you for allowing me to pursue this Master’s degree and your
availability to me for any issue. I am very grateful for the knowledge, research
experience, and guidance you have given me.
I would like to thank my advisory committee Dr. Adrian Owen, Dr. Penny
MacDonald, and Dr. Brian Corneil for providing me with feedback and suggestions for
each experiment in my thesis.
I am indebted to my labmates, Dan Cameron, Sarah Watson, Li-Ann Leow, and
Aaron Gibbings for helping me design, implement, analyse, and write-up each
experiment in my thesis. A special thanks also goes out to Tram Nguyen for being my
partner in crime and for the constant support.
Aaron Kirschner provided helpful advice in programming with Matlab and visual
basic. Without his help programming help, my data analyses would not have been so
efficient.
I would like to give a very special thanks to all my family and friends. To my
parents, Kim and Jeff Parrott, I cannot begin to explain how grateful I am for all of your
love and wisdom. Thank you both for all the support you have given me throughout my
life.
Thanks to Alyssa Smith for her support, encouragement, patience and unwavering
love. Her tolerance of my occasional mood swings during the two years of my Master’s
iv
Table of Contents
Abstract ... ii
Acknowledgements ... iii
Table of Contents ... iv
List of Tables ... vii
List of Figures ... viii
List of Appendices ... ix
Chapter 1: General Introduction ... 1
Introduction ... 1
Rhythm perception and the role of timing mechanisms ... 2
Use of absolute timing versus relative timing ... 3
Beat perception ... 6
Tapping to the beat: Sensorimotor synchronization ... 9
Walking to the beat ... 10
The relationship between “groove” and movement ... 11
Overview of thesis ... 12
Chapter 2 ... 16
Introduction ... 16
Method ... 19
v
Beat perception tests ... 20
Internal generation tests ... 25
Beat production test ... 29
Rhythm discrimination ... 31
Data analysis ... 34
Results ... 34
Task 1: Perception BAT ... 34
Task 2: Intensity threshold test ... 36
Task 3: Metronome tempo discrimination test ... 36
Task 4: Rhythm tempo discrimination test ... 38
Task 5: Production BAT ... 38
Task 6: Rhythm discrimination test ... 38
Correlations across tests ... 38
Discussion ... 42
Chapter 3 ... 51
Introduction ... 51
Method ... 54
Data analysis ... 58
Results ... 58
vi
Chapter 4: General Discussion... 68
Summary and implications of results ... 68
Limitations of current work... 78
Future directions ... 79
Conclusions ... 81
References ... 83
Appendix ... 90
vii List of Tables
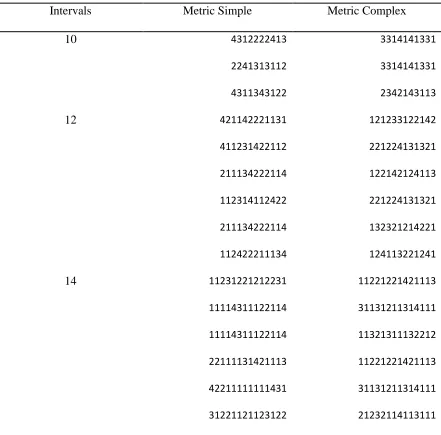
Table 1. MS and MC sequences used in the rhythm tempo discrimination test ... 28
viii List of Figures
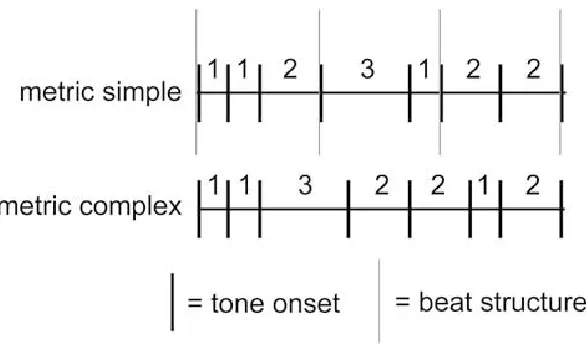
Figure 1. A schematic of example rhythms used in the reproduction experiment (Grahn &
Brett, 2009). ... 5
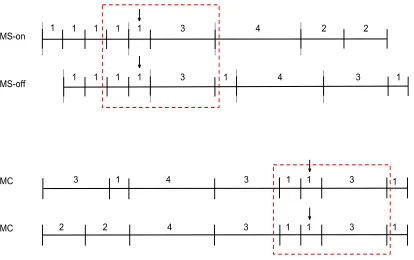
Figure 2. A schematic of MS-on, MS-off, and MC rhythms from the intensity
threshold test.. ... 23
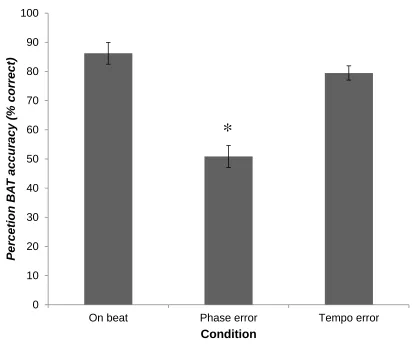
Figure 3. Beat perception performance across all 45 participants for three beat alignment
conditions: on beat, tempo error, and phase error. ... 35
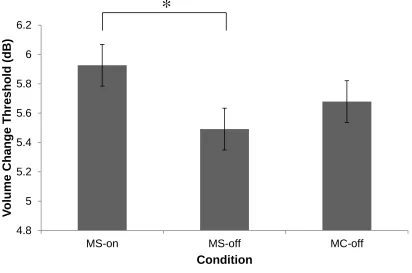
Figure 4. Mean dB thresholds for healthy young subjects on MS and MC rhythms
with intensity changes on or off the beat. ... 37
Figure5. Percent correct scores for healthy young subjects on MS and MC rhythms in
the rhythmic tempo discrimination task ... 39
Figure 6. Mean d' scores for healthy young subjects on MS and MC rhythms in the
discrimination task ... 40
Figure 7. Significant correlations between perception, internal generation, and production
of the beat tests... 43
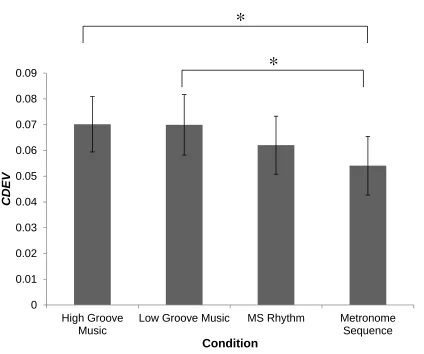
Figure 8. Mean CDEV for high groove, low groove, MS, and metronome stimuli ... 59
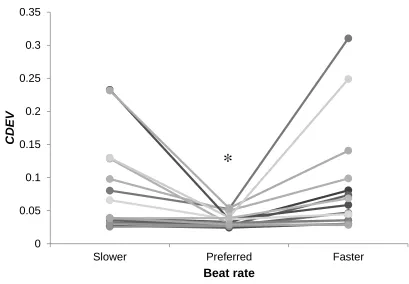
Figure 9. Mean CDEV of individuals at slower, preferred, faster beat rates ... 61
Figure 10. Mean CDEV of high groove, low groove, MS, and metronome stimuli at
slower, preferred, and faster beat rates ... 62
Figure 11. Mean CDEV of high groove, low groove, MS, and metronome stimuli at
ix
List of Appendices
Appendix A. Correlational Matrix……….. 90
Appendix B. Ethics………...……….. 91
1
Chapter 1: General Introduction
Introduction
Across individuals, rhythmic ability is thought to vary widely. An important
element to one’s rhythmic ability is the sense of a periodic pulse or ‘beat’. Perception of
the beat often causes spontaneous synchronized movement, such as toe tapping, finger
snapping, or body swaying, implying that humans are sensitive to the beat. Previous
research has shown that the beat is important for perception and accurate mental
representation of a rhythmic sequence. Perception of rhythmic sequences with a regular
beat has been shown to be impaired in patients with Parkinson’s disease (PD; Grahn &
Brett, 2009). However, it is still unknown if this deficit is due to impairments in
perceiving the beat, in producing the beat, or both.
Knowing if PD patients show deficits in the stages of rhythm perception and not
just the production of movements may aid in the development of appropriate musical
stimuli for rehabilitation. Many rehabilitation studies with PD patients require
synchronization of body movements with a metronome (Lim et al., 2005; Spaulding et
al., 2013; Thaut et al., 1996), a process that has been studied extensively in tapping and
walking experiments (Repp & Su, 2013; Repp, 2005; Thaut, 2005). For example,
Rhythmic Auditory Cueing is used to facilitate coordinated actions in patients with
movement disorders, such as stroke, or Parkinson’s disease (McIntosh & Brown, 1997;
Thaut et al., 1996). In addition, synchronization can also occur when listening to music
(Styns, van Noorden, Moelants, & Leman, 2007). Currently little work has been done to
show how the stages of rhythm processing affects synchronization movements (e.g.,
2
The research I have undertaken seeks to develop the necessary tasks to study
whether the deficits seen in PD patients arise from difficulty in perceiving or producing
the beat. Production of the beat is divided into two categories: ‘internal’ generation and
motor production. Internal generation of the beat occurs once the beat has been found and
refers to the process of predicting the next beat location. Prediction of future beat
locations allows for timing of future events, specifically motor responses or motor
production (e.g. tapping). The main question becomes whether the mechanism used for
perceptual timing (perception and internal generation of the beat) has any commonality
with the mechanism used for motor production and how perception and production
correspond to rhythm perception.
Rhythm perception and the role of timing mechanisms
Broadly defined, rhythm is a pattern of temporal intervals in a stimulus sequence.
The rhythm pattern is indicated by the sequential onsets of a sound (tone, click) and the
time between onsets defines the length of the time intervals that comprise the sequence.
Rhythms can have different levels of regularity and structure. For example, in Western
music, rhythms are often regular and induce a beat; however, rhythms can also be
irregular and may not have a regular beat.
To perceive the intervals within a rhythm we require an internal ‘clock’ to
measure time. In the field of timing, the nature of this clock is still under debate.
‘Absolute’ timing theories view the clock as a stopwatch that can be started at the
beginning of an interval, stopped at the end of an interval, and reset for the next interval.
3
regularities (the beat) in a rhythm and generates expectancies about the occurrence of
future events in time (Large & Jones, 1999).
Use of absolute timing versus relative timing
Using the clock, an absolute, duration-based timing mechanism measures the
absolute duration of each time interval within a rhythm, then stores interval durations into
a reference memory (Church & Broadbent, 1990; Gibbon, Malapani, Dale, & Gallistel,
1997). Previous neuropsychological studies of patients with cerebellar damage
established the role of the cerebellum in absolute timing (Grube, Cooper, Chinnery, &
Griffiths, 2010; Grube, Lee, Griffiths, Barker, & Woodruff, 2010). Cerebellar
degeneration patients showed a specific impairment on the duration-based timing tasks
(e.g., comparing single intervals that do not establish a beat); however, they showed no
deficits on relative timing tasks (e.g., discriminating a more regular target sequence
against a less regular reference sequence). This dissociation specifically implicated the
cerebellum in the explicit encoding of the absolute duration of time intervals.
The clock in relative, beat-based timing entrains to the beat to which durations are
then measured (Teki, Grube, Kumar, & Griffiths, 2011). This mechanism may be
analogous to “chunking”, a way of reducing complex patterns to simpler components
(Graybiel, 1998). Representing intervals as multiples and subdivisions of a single beat
duration may be more efficient than representing each interval separately as seen in an
absolute timer. For example, a performance benefit might be seen when sequences
containing intervals of different durations are timed.
Neuroimaging studies have shown that a relative timing mechanism recruits a
4
(PMC), supplementary motor area (SMA), and DLPFC (dorsolateral prefontal cortex;
Grahn and Brett, 2007; Teki et al., 2011). Further confirmation of the role of the BG in
relative timing comes from neuropsychological studies showing impaired beat-based
timing in PD (Artieda, Pastor, Lacruz, & Obeso, 1992; Grahn & Brett, 2009; Pastor,
Artieda, Jahanshahi, & Obeso, 1992). Grahn & Brett (2009) compared patients with PD
and older adults on a perceptual discrimination task in which participants listened to two
types of rhythms. The first rhythm, called a metric simple rhythm gave a clear sense of
the beat, while the second, called metric complex, was designed so participants could not
easily extract a beat (for a schematic drawing see Figure 1). Subjects heard two
presentations of a rhythm, then a comparison rhythm that was the same or different
(contained a transposition of intervals). In the metric simple condition, where intervals
can be timed with a relative mechanism, lower discrimination performance was observed
in patients with PD compared to aged control participants. However, performance in the
metric complex condition, where intervals are timed with an absolute mechanism, was
similar between the two groups. Impairment in the use of a relative timing mechanism
supports the role of the BG in processing the beat. It is noteworthy that the authors found
no difference between individuals with PD and aged adults in the metric complex
rhythms. This suggests that the deficit seen in relative timing is selective and not due to
general deficits in timing or difficulty with the task.
The exact role of BG in mediating beat perception is still unknown. There are two
possibilities that will be tested: 1) BG are engaged in the search to find (or perceive) the
beat; and 2) BG might make predictions and produce (i.e., internally generate) the beat to
5
Figure 1. A schematic of example rhythms used in the reproduction experiment (Grahn &
Brett, 2009). Grey bars represent the location of the beat, while the numbers denote
6
the beat allows for the organization of onsets in the different rhythmic intervals with
reference to the regular beat. To elucidate the role of the BG in beat perception and
internal generation, we will develop tests to determine if perception and internal
generation of the beat are dissociable in a healthy population. If the tasks are dissociable,
performance on the beat perception tests will not correlate with performance on the
internal generation tests. If a dissociation is present in some participants, the relative
contributions of perception and internal generation of the beat in discriminating metric
simple rhythms can be determined. If participants with a dissociation are able to
discriminate changes in metric simple rhythms then impaired discrimination accuracy in
PD patients might be due to impaired perception of the beat. Conversely, if there is no
dissociation, it would be expected that people with a stronger representation of the beat
are also better able to internally generate the beat.
Beat perception
The core difference between absolute and relative timing is the presence of a beat.
However, not all sequences induce a sense of the beat and therefore these sequences are
likely to be timed using an absolute mechanism. In music, the beat is emphasized by
non-temporal cues such as pitch, volume, and timbre, yet even rhythms without these cues can
induce listeners to ‘‘feel’’ a beat. Current studies investigating perception of the beat in
the general population use the perceptual subtest of the Beat Alignment Test (BAT;
Iversen & Patel, 2008). In the BAT, participants hear musical clips from various genres
with a series of regular beeps superimposed. Participants judge whether the superimposed
beeps are on or off the beat. One limitation with the BAT is the use of real music with
7
beat locations. For example, the bass drum may be consistently heard on the beat, and/or
notes may be louder on the beat. Therefore, performance may be indicative of a
participant’s ability to use non-temporal factors to find the beat, hence the need to
develop a beat perception test using rhythmic sequences where non-temporal factors are
not present.
Essens and Povel (1985) developed a theory to describe how the beat is induced
by a rhythmic pattern containing only temporal grouping accents created by the durations
of intervals between events. This theory classifies temporal patterns into two types: those
that contain a metrical (i.e. measured by the beat) framework and those that do not
contain a metrical framework (i.e. do not contain a beat). Within a rhythm, multiple beat
rates can be perceived at different rates, with the fastest rate at the level of the smallest
duration of an interval. The perceived beat is induced by the distribution of ‘accents’ in
the sequence.
An accent is an emphasis on an interval onset making it sound louder than the
surrounding intervals. In music, accents that cue the beat, called non-temporal factors, are
provided by pitch, volume, and timbre, in addition to rhythm. However, in sequences
where the tones are identical in all physical aspects except for duration, auditory events
occurring on the beat sound more prominent or louder than events that occur off the beat
(Large & Palmer, 2002; Large & Snyder, 2009). Accents place on the beat by the listener
are called subjective accents and can be explained by the dynamic attending theory
(DAT). According to the DAT, perception of the beat corresponds to entrained internal
neural oscillators, and subjective accents represent the point in time when the oscillators
8
attention; once a beat is expected our attention is at its peak. This increased attention
might heighten sensitivity to changes in the physical properties of an interval in a rhythm.
Moreover, heightened sensitivity might increase the salience of the attended event
leading to a perceived increase in loudness relative to neighbouring intervals with
identical physical properties.
If a subjective accent occurs on a tone that falls on the beat, it should be possible
to demonstrate this in psychophysical tasks requiring judgments of the perceived relative
loudness of tones. The presence of a subjective accent has been tested in a study by Povel
and Okkerman (1981) who had participants listen to two tones and adjust the volume of
the tones to be equal. Participants increased the second of two tones in a row by about
four decibels compared to the first tone for both tones to be perceived as equal volume.
The authors speculate that participants heard an accent on the second tone because the
processing of the first tone was interrupted by the second, and a more complete
processing of the second tone caused it to be perceived as accented. This subjective
accent has been studied using single intervals by using metronomic tones. However, it is
still unknown if subjective accents can occur in rhythms with various interval length.
Tones in a rhythmic sequence that are perceived to be louder because of
subjective accenting may cause masking of real intensity changes placed on that tone.
Therefore, a note with an external intensity change on a beat location would be masked,
hindering detection, when placed on the beat. Alternatively, a note that occurs off the
beat does not contain an attention shift and may not mask an external intensity change.
Using a rhythmic sequence with the physical characteristics of the tones being identical
9
This test can not only be used in PD patients to determine whether their difficulties lie in
perception of the beat, but it could tell us about whether perception and production are
dissociable in the general population. By looking at individual differences in perception
and production, we can assess whether individuals show preserved perception, as
measured by failed detection of intensity changes on the beat, but impaired production of
the beat.
Tapping to the beat: Sensorimotor synchronization
The perception of a beat and the accurate motor production of a beat may be
dissociable processes, or may reflect a single mechanism. There is some support for the
idea of reliance on a single mechanism (Schubotz, Friederici, & von Cramon, 2000).
However, it is possible that someone could exhibit accurate beat perception but poor
synchronization. Synchronization to the beat may be explained by the activities in motor
areas associated with beat perception and generation. The ability to detect the beat
requires intact BG. Specifically, BG have been implicated in generating and predicting
the location of the beat in an auditory rhythm (Grahn & Rowe, 2012). However,
activation is dependent on beat salience; the more salient the beat, the more activation
seen in motor areas (e.g., PMC, BG; Chen, Zatorre, & Penhune, 2006). The coupling
between beat salience and motor areas has been implicated in the precision of
sensorimotor synchronization (Repp, 2010).
When asked to synchronize tapping to the beat, participants tap at a rate that is
synchronized with an internal periodic process that marks the beat. As a result,
synchronization is most accurate at beat rates matched to the frequency of internal period
10
resonance model (van Noorden & Moelants, 1999). The resonance model can be used to
explain the distribution of movement rates when relative timing can be used (Van
Noorden & Moelants, 1999). Based on an overview of different experiments, Moelants
(2002) concluded that there is a clear correspondence between the rate of spontaneous
movements, as observed in walking, clapping and finger tapping, and the beat rate
perceived in music. Among adults, tapping variability of rhythms slower and faster than
their preferred rate is generally lower for highly trained musicians than for non-musicians
(Repp & Su, 2013; Repp, 2007, 2010). Accurate synchronization across a range of rates
in musicians has been attributed to better perception of the beat. How beat perception
relates to motor synchronization to the beat is still unclear.
Walking to the beat
While many studies have focused on the synchronization of tapping (Repp & Su,
2013; Repp, 2005), fewer have focused on the synchronization of gait. Gait is a broad
term and for this thesis it will be defined as the pattern of movement of the lower limbs.
We are interested in studying gait because of its clinical application in movement
disorders such as PD (Lim et al., 2005; Spaulding et al., 2013; Thaut et al., 1996).
Acoustic cues may alter gait in the same way it alters tapping synchronization: creating a
stable coupling between footfalls and the beat. By using acoustic cues, a number of
temporal parameters can be altered (e.g., cadence) by changing the rate of acoustic
stimuli. For example, rhythmic auditory stimulation, where participants listen to
isochronous tones, has proved to be useful in gradually increasing the number of steps by
11
Recently, research has expanded the type of auditory stimulation to include music
and not just a metronome (as seen in RAS) to determine what the optimal stimuli are for
synchronization. However, the use of music implies participants are able to perceive and
synchronize their gait to the beat. In a study by Styns, Van Noorden, Moelants, and
Leman (2007), participants tried to synchronize their steps with the beat of musical
stimuli while walking on a treadmill. Synchronization was most accurate when the beat
frequency was around 120 beats per minute (BPM). The authors suggest that walking
speed can be modeled using a resonance curve. Synchronization is optimal at their
preferred rate (120BPM) and becomes more variable as the rate deviates from their
preferred rate. In light of this discovery it is still unknown whether perception of the beat
may lead to improved synchronization of a greater range of beat rates. Most protocols
require participants to synchronize steps to the beat, but never measure their perceptual
capability (Hove, Suzuki, Uchitomi, Orimo, & Miyake, 2012; Nessler, Kephart, Cowell,
& De Leone, 2011; Styns et al., 2007). If production and perception of the beat share a
common timing mechanism, then participants with poor beat perception will likely show
a deficit in synchronizing their footfalls to the beat of music. Knowing if better
perception of the beat predicts synchronization performances may be useful when
creating the optimal stimuli for gait rehabilitation.
The relationship between “groove” and movement
There is an additional quality in music that makes people want to move and
should be controlled for when selecting musical stimuli. This quality is called groove,
and is defined as “wanting to move some part of the body in relation to some aspect of
12
experiments; however, no studies have examined the effect of groove on walking
synchronization.
After examining the acoustic features of music, Madison (2011) found the number
of cues around the beat (beat density) and beat salience to be strong predictors of groove
across genres. In addition, groove ratings were higher for fast than for slow music, and
where highly correlated with enjoyment ratings. Of particular importance is beat density
and beat salience. High beat density and beat salience can increase engagement and
attention (Pressing, 2002) and improve the ability to predict and synchronize with a beat
(Janata et al., 2012; Madison et al., 2011). When participants were asked to tap the beat
to music that elicited a strong sense to move, they reported feeling more “in the groove”
compared to low-groove excerpts and found tapping was easier in high groove music
than low groove music (Janata et al., 2012). The resonator model of Tomic and Janata
(2008), which generates a spectrum of the periodicities present in an input signal,
indicated that sensorimotor coupling strength was higher in high groove music than it
was for mid groove and low groove music.
Although research demonstrates that groove induces movement and improves
tapping synchronization, it is still unknown whether groove has an effect on walking
synchronization. Therefore, I aim to measure walking synchronization to determine if
groove has the same effects on walking as it does on tapping synchronization.
Overview of thesis
Beat perception is integral to temporal reproduction and discrimination of
rhythms. Previous literature has shown impaired discrimination of beat-based rhythms in
13
might be attributed to the role of the BG in normal beat perception or in internal
generation of the beat. Moreover, synchronization of motor responses with a beat
involves both the perception of a beat as well as the motor expression of this internally
perceived beat. Little work has investigated whether beat perception and production
(internal generation and motor production) share a common relative timing mechanism.
That is, can some people perceive the beat, but not internally generate or synchronize to
the beat, or are all three processes required to be successful in each task? The findings
will set the stage for future work that dissociates whether the PD deficit results from a
perceptual or productive deficit, which further tells us about the role of the BG in rhythm
processing.
The first study consists of 7 experiments, collectively designed for two reasons: 1)
to develop tasks to measure beat perception, internal generation of the beat, and motor
production of the beat 2) to determine if there is dissociation between perception and
production in a young population (that might explain the relative timing deficits seen in
PD patients).
To test beat perception, we employed the perception beat alignment test (BAT)
and a intensity threshold test. The perception BAT was used to test beat perception in the
absence of internal generation or motor production using music stimuli. In the perception
BAT participants determined if the superimposed tones were on or off the beat. Since this
test uses real music containing non-temporal factors that aid in the perception of the beat,
we developed a second task using rhythmic sequences. The second task, called the
intensity threshold test, uses rhythmic sequences containing intensity changes on or off
14
subjective accenting may mask an external intensity change. Whereas a note that occurs
off the beat does not contain an attention shift and may not mask an external intensity
change. The intensity threshold test does not contain additional, non-temporal factors that
aid perception of the beat, and thus is a pure representation of beat perception.
To measure internal generation of the beat we employed the metronome tempo
discrimination test and the rhythm tempo discrimination test. In the metronome tempo
discrimination test participants must listen to the beat that is given by the first
metronomic sequence, then internally generate during the second metronomic sequence.
Using two metronomic sequences minimizes perceptual demand. The only requirement is
to internally generate a given beat. In the second task, we assess internal generation of the
beat in the context of rhythm. Participants are asked to compare the beat of the rhythm to
the beat given by the metronomic sequence. This task increases perceptual demands, as it
requires participants to internally generate the beat while they perceive the beat of the
rhythm. Using a rhythm provides a more accurate representation of internal generation
seen in the task used in Grahn and Brett (2009).
To determine motor production of the beat, participants tapped to the beat of the
stimuli from the BAT. Synchronization accuracy was determined while participants
tapped their perceived beat rate. By developing tests for perception and production
(internal generation and motor production), we are able to correlate each task to
investigate if dissociation occurs in the general population and determine what effects it
has on relative timing.
To test if a dissociation between perception and production have an effect on
15
in Grahn and Brett (2009). Participants listened to two identical standard rhythms, to
which they compared a third rhythm that was either the same as or different from the
standard rhythms. The rhythm discrimination test requires both perception and internal
generation of the beat. Subjects must first find or perceive the beat, then internally
generate the beat from the standard rhythms onto the comparison rhythm. If the intervals
in standard and comparison rhythms match, they are the ‘same’, if not, they are
‘different’. The discrimination test requires larger perceptual demands, in that the beat of
the standard rhythm must be perceived and internally generated.
The follow-up study was designed to investigate the relationship between
perception and production of the beat using a walking paradigm, rather than a tapping
paradigm. The second study measured whether beat perception explains not only tapping
synchronization but also walking synchronization. Different types of stimuli (metric
simple rhythms, metronomes, music) were presented to subjects, who were asked to
synchronize their footfalls to the beat (metric simple rhythms, music) or tones
(metronome). The purpose of this experiment was to investigate the difference in
synchronization accuracy across different levels of beat perception ability (using
perception BAT), in addition to finding the optimal stimuli for accurate synchronization
to the beat.
The final chapter summarises the findings of the thesis, and discusses the
implications of the results for theories of beat-based timing. Limitations of the current
16 Chapter 2
Introduction
As mentioned above, the BG could either engage in the search for the beat,
internally generating the beat to predict its next occurrence, or to control synchronization
of movements to the beat. The experiments in this chapter were developed to measure
beat perception, internal generation, and motor production. We were concerned whether a
these stages of beat processing are controlled by a common mechanism.
One approach to the question of a common timing mechanism controlling
perception, internal generation and production of the beat, involves the exploitation of
individual differences. Individuals have been shown to vary in their ability to perceive
(Iversen, 2008), internally generate (Grahn & Rowe, 2012), and produce the beat
(Iversen, 2008; Repp, 2007). This raises the question of whether performance correlates
across these processes, indicating whether the mechanism used for perception has any
commonality with that used for production. If each process has a different mechanism, it
may be that performance in one area of beat processing shows no correspondence to the
performance of another. However, if a common mechanism controls all processes, then
individuals who are good at one area would be expected to be good at another.
To study beat perception we used two tests: the perception BAT and intensity
threshold test. In the perception BAT, participants listened to music from various genres
and determined if the superimposed tones were on or off the beat. The task used real
music, which contains non-temporal factors that aid in the perception of the beat, making
it necessary to develop an additional beat perception test without non-temporal factors.
17
sequences [i.e., metric simple (MS) or metric complex (MC)] containing intensity
changes on or off the beat. Tones in a rhythmic sequence that are on the beat are
subjectively accented, therefore perceived as louder than surrounding tones (Large &
Jones, 1999). This perception may subsequently mask a true external intensity change. A
note that occurs off the beat is not subjectively accented and, therefore, there is nothing to
mask an external intensity change. As the rhythms do not contain any non-temporal
changes (such as pitch, timbre, harmony, etc.) this test is a purer measurement of
temporally-induced beat perception than the perception BAT.
Internal generation was measured using two tests: the metronome tempo
discrimination test and the rhythm tempo discrimination test. In the metronome tempo
discrimination test participants compared the beat rate between two metronomic stimuli
(i.e., sequences of evenly spaced tones). Participants listened to the beat that is given by
the first metronomic sequence, then internally generate during the second metronomic
sequence. Using only two metronomic sequences minimizes perceptual demand. The
only requirement is to internally generate a given beat. In the second task, we assess how
well internal generation works in a rhythmic context. The first stimulus is a metronomic
sequence, but now the comparison sequence is a MS or MC rhythm. Participants were
asked to compare the beat of the rhythm to the beat given by the metronomic sequence.
This task increases perceptual demands relative to the metronome tempo discrimination
test, as it requires participants to perceive the beat in the rhythm then internally generate
the beat given by the metronomic sequence. Thus, this task looks at internal generation of
the beat in the context of a rhythm, similar to the requirements seen in the task used by
18
To measure motor production of the beat, participants tapped to the beat of music
stimuli from the BAT in a task called the production BAT. However, in this task there
were no superimposed tones on or off the beat. Participants tapped as they perceived it,
and their synchronization accuracy was measured. It is still unknown whether a common
mechanism is responsible for accurate perception, internal generation and motor
production of the beat. By correlating tests investigating beat perception and production
with (synchronization) and without (internal generation) a motor response, we are able to
investigate if a single or multiple mechanism(s) control performance across tests.
The final aim of this experiment was to determine whether perception and internal
generation explains performance on tasks requiring relative timing. The current study
used the MS and MC rhythmic stimuli from Grahn and Brett (2009). MS rhythms induce
a clear sense of the beat; while MC rhythms do not. Thus half the sequences give rise to
perception of a regular beat, such that relative timing can occur, while the other half do
not give rise to a regular beat, requiring an absolute timing mechanism to encode. A
dissociation between perception and internal generation of the beat might indicate that
perception and internal generation of the beat might not be governed by the same
mechanism, and that participants might show a deficit in perception or a deficit in
internal generation. Therefore, it is possible that some participant’s show preserved beat
perception, but their deficit lies in internal generation of the beat. Thus, A dissociation
would indicate that a deficit in forming a relative representation of a rhythm might arise
from a selective impairment in internal generation of the beat. On the contrary, if no
dissociation is observed, it could mean that perception and internal generation of the beat
19 Method
Metric simple and metric complex rhythm generation
The MS and MC rhythms in this experiment were created using integer-ratio
related sets of intervals. Integer-ratio sequences contain durations that are related only by
small integers. For example, a sequence containing intervals of 250, 500, and 1000 ms
has a 1:2:4 relationship between its intervals. The integer-ratio intervals in both metric
simple and metric complex rhythms were related by ratios of 1:2:3:4. In the metric simple
condition, the intervals were also arranged in groups of four units (e.g., in the sequence
4-31-1111, every four units an interval signaled by a tone begins), thereby creating a beat
every four units (Povel, 1981). The relation of intervals conformed to previous guidelines
(Essens & Povel, 1985) to induce a perceptual accent every four units. In addition,
perceptual accents will occur every four units, cueing the subjects to hear a beat. In the
metric complex condition, intervals were arranged so that, unlike the metric simple
condition, the intervals could not be reliably classified into repeating two, three, or four
unit groups (e.g., 2132141). Since there were no regularly occurring perceptual accents,
no beat should be induced. For a schematic drawing of MS and MC rhythms, please refer
to Figure 1. The length of the ‘1’ interval was varied depending on the experiment. The
rest of the intervals in each sequence were multiples of the ‘1’ interval.
Participants
Forty-four (23 male and 21 female) introductory psychology students at the
University of Western Ontario participated in all experiments in return for a course credit
(Mage= 19.32 SD = 2.29). All participants completed all tests, which were presented in a
fixed order: the metronome tempo discrimination test, the rhythm discrimination test, the
20
the intensity threshold test. The presentation of the auditory stimuli and visual
instructions was controlled by a paradigm created in the E-Prime (2.0) program
(Psychology Software Tools, 2002). There were no inclusion criteria other than normal
hearing, which was based on antidotal reports. The participants gave informed consent as
approved by the University of Western Ontario Ethics Board and completed a music
experience questionnaire.
Beat perception tests
Task 1: Perception Beat Alignment Test (BAT)
The perceptual subtest of the BAT (Müllensiefen et al., 2011) was used to assess
participants’ abilities to perceive the beat in music. In the BAT, participants hear various
genres of music with a series of regular beeps superimposed on the music clip. The beeps
may coincide with the beat or they may fall off the beat. Participants judge whether the
superimposed beeps are on or off the beat.
Materials
Seventeen Western musical clips from a variety of different musical genres (pop,
orchestral, jazz, and rock) with a series of regular beeps superimposed were used for this
test. The beeps occurred either on the beat or off the beat. The beeps in the on beat
locations were aligned in time with the beat of the music, while the off-beat condition had
either a tempo error (beeps were 10% faster or slower than the true beat rate) or phase
error (consistently early or late by 25%). There were a total of 17 trials, 4 had beeps
21 Procedure
Participants listened to the 17 excerpts in a random order. Participants judged
whether the superimposed beeps were “on the beat” or not. When listening to an excerpt,
participants pressed the spacebar when they had made their judgment, to provide a
reaction time measurement. After they pressed the spacebar, the stimulus ended and
subjects pressed ‘‘y’’ if the beeps were on the beat or ‘‘n’’ if the beeps were off the beat.
Listeners were also asked to rate the confidence of their judgment: 1 = guessing, 2 =
somewhat sure, 3 = completely certain. Before starting the experiment, participants
practiced three trials to familiarize themselves with all the conditions. The experimental
session lasted approximately 20 min. Percent correct was calculated on each trial for each
participant.
Task 2: Intensity threshold test
The intensity threshold test investigated beat perception using stimuli without the
influence of non-temporal factors. Specifically, metric simple and metric complex
sequences were used. The use of rhythmic sequences eliminates the influence of
non-temporal factors that exist in music and allows for a pure non-temporally-induced
measurement of beat perception. Tones in a rhythmic sequence that are on the beat are
subjectively accented, therefore perceived as louder than surrounding tones. This
subjective accent may subsequently mask a true external intensity change. A note that
occurs off the beat is not subjectively accented and, therefore, there is nothing to mask an
external intensity change. Thus, larger external intensity changes on notes that are on the
beat are needed to compensate for the subjective accents. A staircase threshold procedure
was used to obtain levels of external intensity changes needed to perceive a difference in
22 Materials
Thirty MS and MC rhythms were created. Each sequence was composed of 10,
12, or 14 intervals. The length of the shortest interval was 250 ms and each tone in the
sequence was 50 ms in duration. The remainder of the intervals in the sequence were
multiples of the smallest interval length (i.e., 500, 750, or 1000 ms). A single intensity
change was placed on one tone in each rhythm. Within the MS rhythm, two conditions
were created: MS-on and MS-off. In the MS-on condition, a tone that coincides with the
perceived beat was made louder. In the MS-off condition, a tone that begins off the
perceived beat was made louder. Because the MC condition does not have a regular beat,
any note with an intensity change is necessarily off the beat, MC-off. Thus, the third
condition, MC-off, contained intensity changes only off the beat. Within the MS
condition 15 rhythms had intensity changes coinciding on the beat, while 15 rhythms had
intensity changes off the beat. Up to seven intervals surrounding the intensity change
were matched in both MS-on and MS-off conditions, the only difference being where the
intensity change occurred relative to the beat (i.e., on or off the beat).
For every intensity change location and surrounding intervals in the MS-on and
MS-off condition, matching intensity locations and surrounding intervals were created for
the MC-off condition. Therefore, 30 rhythms were created in the MC-off to balance MS
and MC rhythms. See Figure 2 for an example of an intensity change location in a rhythm
and the surrounding intervals. In all conditions the intensity change occurred in the
second half of the rhythm, so that the participant had established a perception of the beat
23
Figure 2. A schematic of MS-on, MS-off, and MC rhythms from the intensity threshold
test. The arrows represent what interval contains an intensity change. In each sequence
the intensity change occurs on a ‘1’ interval with surrounding intervals of ‘1’ and ‘3’ (i.e.,
those in the red box). The grey bars in the MS-on and MS-off conditions represent the
24
tone was modulated from 0.2 Pascal (Pa) to 0.9 Pa in seventy equal increments of 0.01 Pa
for each condition (MS-on, MS-off, MC-off).
Procedure
Participants heard MS and MC rhythms that contained one note with an intensity
change. A staircase procedure was employed for each condition (MS-on, MS-off, and
MC-off) to determine the thresholds needed to perceive intensity changes ‘on beat’ and
‘off the beat’. Each staircase was interleaved, so that participants could not predict
whether any given sequence would have a beat or not. The amount of amplitude change
(intensity) was adjusted between trials based on participants’ responses to the previous
trial in that particular staircase. Amplitude was varied adaptively according to a
“two-down, one-up” staircase schedule. In a given staircase, a reversal was coded each time the
participant recorded an incorrect answer following two previous correct answers. In
addition, a reversal was recorded when the amplitude of the test tone was reduced after
two subsequent correct answers. Initial amplitude of tones in the test trial was set to 0.9
Pa. The step size was initially set at a 0.25 Pa amplitude change. After the second
reversal, the amplitude step size was reduced to 0.05 Pa. After five reversals the
amplitude step was reduced to 0.01 Pa. The experiment was completed when the
participant achieved 14 reversals in each staircase procedure. Amplitude thresholds were
calculated by averaging the amplitudes of the final 6 reversals. The experimental session
lasted approximately 20 min.
Average amplitude threshold values were converted to a decibel (dB) level using
equation 1.
20 log10(Arms
25
where Aref is the root mean squared of the reference or baseline amplitude and Arms is the
root mean squared of the amplitude being measured.
Internal generation tests
Task 3: Metronome tempo discrimination test
The metronome tempo discrimination test was designed to study internal
generation of the beat in the absence of the rhythm by comparing the rate of two
metronomic sequences. Using two metronomic sequences minimizes perceptual
demand—participants only compare two clearly given beat rates. The standard
metronome sequences provided an example beat that needed to be generated during the
comparison stage. Participants judged whether the rate of the comparison metronomic
sequence was ‘faster’, ‘same’, or ‘slower’ as the standard metronomic sequence.
Metronome sequences are the most rudimental way to present the beat, as only the beat
itself is played – the beat does not have to be perceived in the context of a rhythm with
temporally varying intervals, or complex music. With minimal perceptual demands, this
test looks purely at how well an individual can internally generate a given beat.
Materials
Metronome sequences of four tones with intervals of 250, 500, or 1000 ms were
created. These specific intervals were used because they were within the range of regular
periodicities seen in most Western music and in the sequences used in all other tests.
Filled tones (tones last the entire duration of the interval) were used to remain consistent
between tests. To create comparison metronome sequences that were faster and slower
than the metronome rate, each interval was decreased or increased by 10%. For each
26
of six metronome sequences. From these base intervals a 10% faster and 10% slower
version of the rhythm was created, for a total of 18 rhythms.
Procedure
On each trial, participants heard two metronomic sequences, with each sequence
separated by 1100 ms of silence. After the second sequence, participants indicated
whether the rate of the second sequence was the same, faster, or slower than the first
sequence. Participants pressed ‘‘1’’ for slower, ‘‘2’’ for same, and “3” for faster on a
computer keyboard. Subjects practiced four trials, and then completed one block of 18
randomly ordered trials. The experimental session lasted approximately 10 min.
Task 4: Rhythm tempo discrimination test
The rhythm tempo discrimination test was designed to test internal generation of
the beat in a rhythmic context. Participants heard a sequence of metronomic tones
followed by a MS or MC rhythm. Participants had to determine if the beat rate of the
rhythm was either the same, faster, or slower than the rate of the metronome sequence.
The metronome sequence acted as an example beat, to which the participants compared
the beat of the rhythms too. As MS rhythms contain a definitive beat, while MC rhythms
do not, it was expected that performance in the MS condition would be greater than the
MC condition.
The difference between the metronome tempo discrimination test and the rhythm
tempo discrimination test is that the metronome tempo discrimination test explicitly gave
participants the beat (in the form of the metronome sequence), placing minimal demand
on beat perception, whereas, the rhythm tempo discrimination test requires participants to
perceive and extract the beat when listening to the rhythm. Thus, this task requires
27
it to the perceived beat rate of the comparison rhythm. Using internal generation in the
context of a rhythm is more applicable to the internal generation seen in the rhythm
discrimination test found in Grahn and Brett (2009). In the rhythm discrimination task,
participants must first perceive a beat and then internally generate that beat during the
discrimination phase to organize the onsets of the different rhythmic intervals.
Materials
Metronome sequences of eight tones with intervals of 900, 1000, or 1100 ms were
created as a standard sequence. Each tone was 50 ms of the interval. Eighteen MS and 18
MC rhythms were created with 10, 12, or 14 intervals (for MS and MC sequences see
Table 1) as comparison rhythms. The length of the base interval (‘1’ interval) in the MS
and the MC rhythms were selected from 225, 250, or 275 ms to create rhythms with
perceived beat rates of 900, 1000, and 1100 ms, respectively. Therefore, the beat rates of
the rhythms with base intervals of 225, 250, and 275 ms were matched to the rate of the
metronome sequences. To create rhythms with beat rates that were faster and slower than
the metronome rate, the base intervals were decreased or increased by 25%. For each
base interval length (225, 250, and 275 ms), two rhythms were created, for a total of six
base rhythms. From these base rhythms a 25% faster and 25% slower version of the
rhythm was created, for a total of 18 rhythms. A 25% deviation from the base interval
length was used as piloting indicated participants responded at chance level when the rate
was adjusted by less than 25%.
Procedure
Each trial consisted of two phases: a standard phase and a comparison phase. In
28 Table 1.
MS and MC sequences used in the rhythm tempo discrimination test
Intervals Metric Simple Metric Complex
10 4312222413 3314141331
2241313112 3314141331
4311343122 2342143113
12 421142221131 121233122142
411231422112 221224131321
211134222114 122142124113
112314112422 221224131321
211134222114 132321214221
112422211134 124113221241
14 11231221212231 11221221421113
11114311122114 31131211314111
11114311122114 11321311132212
22111131421113 11221221421113
42211111111431 31131211314111
31221121123122 21232114113111
29
1000, or 1100 ms. During the comparison phase, participants listened to a rhythm in
which the beat rate was 25% slower, 25% faster, or the same as the sequence in the
standard phase. The metronome and rhythm pairing were pseudo-randomly selected such
that the perceived beat rate was matched to the rate of the metronome sequence. For
example, the shortest metronome sequence with intervals of 900 ms was only paired with
a rhythm with the shortest intervals of 225 ms ± 25%. Similarly, metronome sequences of
1000 and 1100 ms were coupled with rhythms of base intervals of 250 ms ± 25% and 275
ms ± 25%, respectively. Participants were asked if the beat rate of the comparison rhythm
was slower, faster, or the same as the rate of metronome sequence. They then indicated
their response by pressing “1” for slower, “2” for same, and “3” for faster on the
computer keyboard. The onset of the comparison rhythm relative to the last tone of the
standard sequence was equal to one interval length such that the comparison rhythm
began on the next predicted beat. For example, if the standard sequence base interval was
900 ms the first tone of the comparison rhythm began 900 ms after the last tone of the
standard sequence. The next trial began after a response was entered and the spacebar key
pressed. The block of trials consisted of 36 rhythms including 18 MS and 18 MC and
took approximately 20 minutes to complete. Percent correct score for each trial was
calculated for each participant.
Beat production test
Task 5: production BAT
This test used the production subtest of the BAT (Müllensiefen et al., 2011) to
30
clips from the perception BAT and tapped to the beat. Using the same musical clips as
the perception BAT enables a direct comparison between perception and production.
Material
The BAT production task was designed to test the ability to tap with the beat of
music. Seventeen western musical clips from a variety of different musical genres (pop,
orchestral, jazz, and rock songs) were used. The 17 music clips used in the production
BAT were also used in the perception BAT.
Procedure
Participants heard a musical excerpt once and were instructed to tap the spacebar
to the beat. Tap times were collected and the accuracy and variability of synchronization
were measured. The order of the stimuli was randomized for each participant. Before
starting the experiment, participants practiced one trial to familiarize them with the
procedure. The experimental session lasted approximately 10 min.
For each trial, time indices of beep or beat onsets and time indices for each tap
were registered to determine the coefficient of deviation (CDEV). The CDEV is the
absolute time between each tap (inter-tap-interval) minus the time between each beat in
the musical stimulus (inter-beat-interval, IBI) and divided by the mean inter-tap-interval
(ITI; see equation 2). We normalized the CDEV using the subjects’ mean ITI to control
for tapping rate. Lower CDEV indicates more accurate synchronization compared to
higher CDEV values.
31
Rhythm discrimination
Task 6: Rhythm discrimination test
To measure relative timing, we used a similar rhythm discrimination task to that
described in Grahn and Brett (2009). Participants listened to two identical standard
rhythms, to which they compared a third rhythm that was either the same as or different
from the standard rhythms. MS rhythms are expected to show higher discrimination
accuracy, as shown in the past, because a relative timing mechanism will be used. The
difference between this rhythm discrimination test and the one used in Grahn and Brett
(2009) was that the third presentation sometimes contained a change in the overall rate.
Participants were instructed to ignore any change in rate, and to make the same/different
judgement only on the basis of the relative pattern of time intervals. Thus, participants
had to change the rate of their representation of the standard rhythm to match the rate of
the comparison rhythm; a process known as rescaling. For example the rhythm of happy
birthday is recognized when sung quickly or slowly, as the relative relationships between
each note are the same, even though the overall rate has changed. Participants are able to
rescale MS rhythms, but are unable to rescale MC rhythms (Collier & Wright, 1995).
With a rate change, the absolute mechanism used to encode MC rhythms should struggle,
because all the absolute interval lengths will differ when there is a rate change. However,
relative relationships will be maintained, therefore we can be more confident that
performance on this task should index relative mechanisms.
Materials
There were 30 trials (15 MS and 15 MC) with each trial containing rhythms that
were composed of 5, 6, or 7 intervals of 225, 250, or 275 ms base interval durations
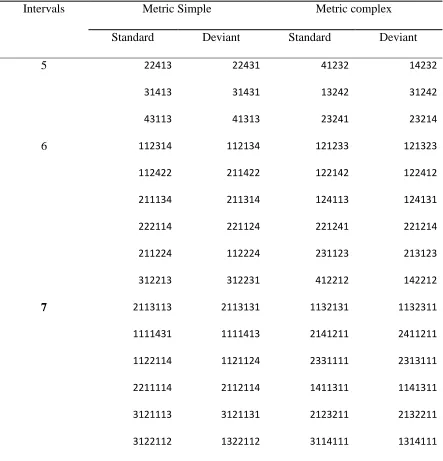
32 Table 2.
MS and MC sequences used in the rhythm discrimination test
Intervals Metric Simple Metric complex
Standard Deviant Standard Deviant
5 22413 22431 41232 14232
31413 31431 13242 31242
43113 41313 23241 23214
6 112314 112134 121233 121323
112422 211422 122142 122412
211134 211314 124113 124131
222114 221124 221241 221214
211224 112224 231123 213123
312213 312231 412212 142212
7 2113113 2113131 1132131 1132311
1111431 1111413 2141211 2411211
1122114 1121124 2331111 2313111
2211114 2112114 1411311 1141311
3121113 3121131 2123211 2132211
3122112 1322112 3114111 1314111
Note: 1 = 250 ms for the standard rhythms. 1 = 225, 250, or 275 ms, chosen at random for
33
presentations (standards rhythm). The standard rhythms were created with interval
lengths that were integer multiples of 250 ms, while the rhythms were created with
interval lengths of 225, 250, or 275 ms. The change in rate between the standards and
deviants ensured the use of a relative timing mechanism in MS rhythms. Deviant
sequences contained a transposition of two time intervals in the sequence. For example,
the standard metric simple rhythm 314211 might have a deviant sequence 134211, in
which the 3 and the 1 interval have been transposed. To ensure the preservation of the
metrical structure in each rhythm, only deviant sequences that were in the same category
as the standard sequences were allowed (e.g., MS trials could not have a MC deviant and
vice versa). The sequences employed filled intervals as they have been used in previous
studies (Grahn & Brett, 2007).
Procedure
On each trial participants heard three rhythms: two standard rhythms and one
comparison rhythm. The task was to indicate if the standard rhythms were the same as or
different from the comparison rhythm. Participants were told to ignore rate changes
between the standard rhythms and comparison rhythms. Participants pressed ‘‘1’’ if the
third rhythm was the same, and ‘‘0’’ if the third rhythm was different on a computer
keyboard. Participants practiced four trials and then completed one block of 15 randomly
ordered MS and MC rhythms (total of 30 rhythms). The experimental session lasted
approximately 20 min.
To assess discrimination accuracy d’ scores were calculated for the MS and MC
conditions for each subject. It has been noted that d’ scores are a more sensitive measure
for same/different discrimination tasks than percent correct, as they are less affected by
34 Task 7: Questionnaire
Upon the completion of all the tests participants completed a standardized
examining musical experience and problems encountered within the experiment. If any
major issues (e.g., major reported hearing loss) subjects were excluded from analysis.
Data analysis
For the intensity threshold test and perception BAT a one-way repeated measures
ANOVA was used to test difference between means. A Mauchly’s Test of Sphericity was
used to determine violations of sphericity. If Mauchly’s test was significant then the
Greenhouse-Geisser correction was applied. For all other comparisons (the rhythm tempo
discrimination test, the rhythm discrimination test) a paired sample t-test was used to test
differences between means.
Results
Task 1: Perception BAT
Using the perception BAT, we measured participant’s ability to perceive the beat
in music. Participants judged whether the superimposed tones on the musical excerpts
were on the beat or not. Figure 3 shows overall population performance for the three
conditions: on beat (M = 86.36%, SD = 25.23%), phase error (M = 50.45%, SD =
25.33%), tempo error (M = 79.55%, SD = 16.07%). A one-way ANOVA was used to
compare the effect of stimulus condition on performance accuracy (Figure 3). There was
a significant effect of condition on performance accuracy (F (2,129) = 31.25, p < 0.001).
Paired samples post hoc t-tests indicated that performance on the phase condition was
significantly worse than the on-beat condition (t(43) = 6.96, p < .001) and tempo
condition (t(43) = 7.19, p < .001). No significant difference was found between on-beat
35
Figure 3. Beat perception performance across all 45 participants for three beat alignment
conditions: on beat, tempo error, and phase error. Performance in the phase error
condition was significantly less than performance on the on beat and tempo error
conditions. Error bars indicate standard error of the mean. * p < .05.
0 10 20 30 40 50 60 70 80 90 100
On beat Phase error Tempo error
36
incorrectly judge an off-beat phase error tone sequence as being on the beat than they
were to judge on-beat tones as off-beat and tempo tone sequence to be on the beat.
Overall the BAT test showed a wide distribution of performance across individuals.
Task 2: Intensity threshold test
Using the intensity threshold test, we measured participant’s ability to perceive
the beat in a rhythmic context (without non-temporal factors). The thresholds for
detecting intensity changes were compared for on the beat on) and off the beat
(MS-off and MC) conditions (Figure 4). It was predicted that thresholds would be higher for
intensity changes on beat (MS-on) compared to off the beat (MS-off and MC), to
compensate for participants’ internal emphasis on on-beat tones. A one-way repeated
measures ANOVA revealed a main effect of condition (F(2, 43) = 3.75, p = .027).
Pair-wise comparisons using paired t-tests showed that threshold significantly differed
between MS-on (M = 6.11 dB , SE = 2.55 dB ) and MS-off (M = 5.76 dB , SE = 2.69 dB ,
t(43) = 2.66 p = .011). No significant differences were found between MS-on and MC (M
= 5.88 dB , SE = 2.68 dB , t(43) = 1.728 p = .091) and MS-off and MC (M = 4.85 dB , SE
= 1.62 dB , t(43) = -1.09 p = .283). Therefore, larger intensity changes were needed to
perceive a change on the beat compared to off the beat in the metric simple condition.
Task 3: Metronome tempo discrimination test
The metronome tempo discrimination test uses metronomic sequences to
investigate internal generation of the beat with minimal demands on beat perception. The
mean percent correct value of 79.8% ± 14.6% and a range of 50% to 100% correct.
Therefore, no ceiling effects or floor effects were found and participants were able to