Identification and Cholesterol Estimation of
Skin Using Hand Pattern Image
Silambarasan. T, P. Sethupriyan
Assistant Professor, Dept. of Electronics and Tele-Communication Engineering, Bharath University, Chennai, Tamil
Nadu, India
Assistant Professor, Bharath University, Chennai, Tamil Nadu, India
ABSTRACT: A novel identification and detection of cholesterol in the human body by non-invasive method using image processing is presented in this paper. Different sample of images with and without cholesterol are taken for the study. These images are analysed using mean algorithms in image processing to detect the cholesterol levels. The image of the patients’ finger region is taken as sample images, along with their laboratory tested values of cholesterol. A database of different range of cholesterol values is created using these images. The sample images of different age groups are collected for the purpose of easy image analysis and accuracy. In image processing, the image analysis is done in various methods such as mean algorithm, median, standard deviation, histogram analysis, grey slicing method, etc. It was found that the mean algorithm is suitable for the non-invasive method of detecting the cholesterol levels. The mean value of the test image is then compared to the mean value of the images in the database to determine the cholesterol value. From the results it is found that the cholesterol mean values are proportional to the laboratory values. Thereby the correlations table is formulated.
KEYWORDS: image processing; cholesterol; correlation; average mean algorithms.
I. INTRODUCTION
diabetes. Total blood cholesterol is the most common measurement of blood cholesterol. It’s the number you receive as test results. Cholesterol is measured in milligrams per decilitre of blood (mg/dL).Total cholesterol is the sum of LDL (low density) cholesterol, HDL (high density) cholesterol, Triglycerides. Both heredity and diet have a significant influence on a person’s LDL, HDL and total cholesterol levels. For example, familial hypercholesterolemia (FH) is a common inherited disorder whose victims have a diminished number or non-existent LDL receptors on the surface of liver cells. People with this disorder also tend to develop atherosclerosis and heart attacks during early adulthood. The American Heart Association endorses the National Cholesterol Education Program (NCEP) guidelines for detection of high cholesterol. It recommends that everyone age 20 and older have a fasting ‘lipoprotein profile’ every five years. This test is done after a 9–12-hour fast without food, liquids or pills. It gives information about total cholesterol, low-density lipoprotein (LDL) or ‘bad’ cholesterol, high-low-density lipoprotein (HDL) or ‘good’ cholesterol and triglycerides (blood fats). Blood cholesterol for adults is classified by LEVELS. Normal range of cholesterol levels are 200 mg/dL or lower for a total count, but it is important to check HDL and LDL levels for a better analysis. To check HDL and LDL levels a blood lipid test will need to be done, which should also reveal triglyceride levels. Normal triglyceride levels are 150 mg/dL and below.
HDL is the good cholesterol and is considered normal at 40mg/dL whereas LDL is the bad cholesterol and should be less than 100 mg/dL to be at a desirable range. If your total cholesterol is 200 mg/dL or more, or your HDL cholesterol is less than 40 mg/dL (for men) and less than 50 mg/dL (for women), you need to have a lipoprotein profile done to determine your LDL cholesterol and triglyceride levels. If your cholesterol is high or you have other risk factors. Lowering high cholesterol can be accomplished with diet, exercise, and medication if needed. A physician will usually try diet and exercise first but may prescribe medication to help get levels down faster, depending upon weight factors and other uncontrollable factors such as age, gender, and family history.
II. SYSTEM DESCRIPTOR
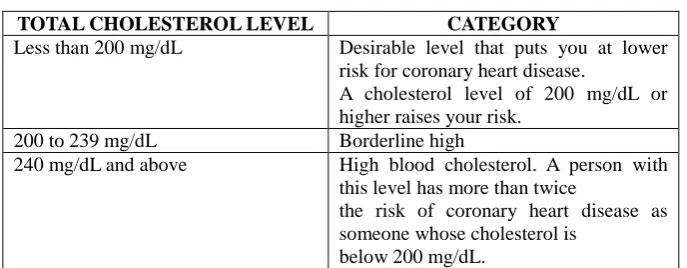
Table 1 Total cholesterol level
TOTAL CHOLESTEROL LEVEL CATEGORY
Less than 200 mg/dL Desirable level that puts you at lower risk for coronary heart disease.
A cholesterol level of 200 mg/dL or higher raises your risk.
200 to 239 mg/dL Borderline high
240 mg/dL and above High blood cholesterol. A person with this level has more than twice
the risk of coronary heart disease as someone whose cholesterol is
below 200 mg/dL.
HDL cholesterol is called the ‘good cholesterol’ because HDL cholesterol particles prevent atherosclerosis by extracting cholesterol from the artery walls and disposing of them through the liver. Thus, high levels of LDL cholesterol and low levels of HDL cholesterol (high LDL/HDL ratios) are risk factors for atherosclerosis, while low levels of LDL cholesterol and high level of HDL cholesterol (low LDL/HDL ratios) are desirable.
Table 2 HDL cholesterol level
HDL CHOLESTEROL LEVEL CATEGORY Less than 40 mg/dL (for men) Low HDL cholesterol. A
major risk factor for heart disease.
Less than 50 mg/dL (for women)
60 mg/dL and above High HDL cholesterol. An HDL of 60 mg/dL and above is
LDL cholesterol is called ‘bad’ cholesterol, because elevated levels of LDL cholesterol are associated with an increased risk of coronary heart disease. LDL lipoprotein deposits cholesterol on the artery walls, causing the formation of a hard, thick substance called cholesterol plaque. Over time, cholesterol plaque causes thickening of the artery walls and narrowing of the arteries, a process called atherosclerosis. The liver not only manufactures and secretes LDL cholesterol into the blood; it also removes LDL cholesterol from the blood. A high number of active LDL receptors on the liver surfaces is associated with the rapid removal of LDL cholesterol from the blood and low blood LDL cholesterol levels. A deficiency of LDL receptors is associated with high LDL cholesterol blood levels.
Table 3 LDL cholesterol level
LDL CHOLESTEROL LEVEL CATEGORY
100 to 129 mg/dL Near or above optimal
Less than 100 mg/dL Optimal
130 to 159 mg/dL Borderline high
160 to 189 mg/dL High
190 mg/dL and above Very high
Triglyceride is the most common type of fat in the body. Many people who have heart disease or diabetes have high triglyceride levels. Normal triglyceride levels vary by age and sex. A high triglyceride level combined with low HDL cholesterol or high LDL cholesterol seems to speed up atherosclerosis (the build-up of fatty deposits in artery walls). Atherosclerosis increases the risk for heart attack and stroke.
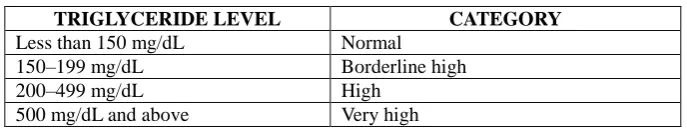
Table 4 Triglyceride level
TRIGLYCERIDE LEVEL CATEGORY
Less than 150 mg/dL Normal
150–199 mg/dL Borderline high
200–499 mg/dL High
500 mg/dL and above Very high
III. METHODOLOGY
click the crop button the will be cropped to a standard size. When we click the Test button the mean value of the cropped image will be compared with the database and the desired result will be displayed as ‘You have
cholesterol or not’.
IV. RESULT AND DISCUSSION
In this project we take various sample images and crop it to a standard size. From these cropped images we get a range of mean values. These mean values are correlated with the corresponding laboratory values of the sample image. We classify the patients into different age group and correspondingly we set the mean values and laboratory values for the patient with the help of our database. Depending on this classification we obtain a range of mean values and laboratory values on basis of which we can conclude whether the person is having very high cholesterol, High cholesterol(desirable) and normal cholesterol.
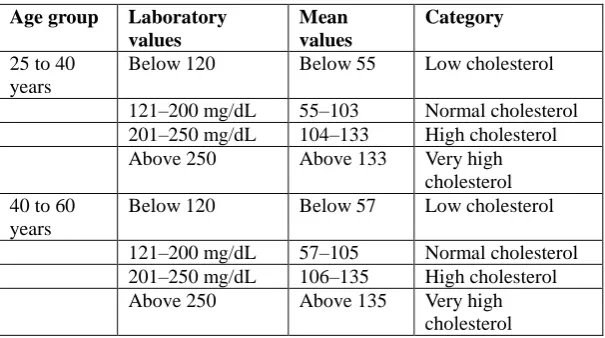
Table 5 Age, laboratory values, category
Age group Laboratory values
Mean values
Category
25 to 40 years
Below 120 Below 55 Low cholesterol
121–200 mg/dL 55–103 Normal cholesterol 201–250 mg/dL 104–133 High cholesterol
Above 250 Above 133 Very high
cholesterol 40 to 60
years
Below 120 Below 57 Low cholesterol
121–200 mg/dL 57–105 Normal cholesterol 201–250 mg/dL 106–135 High cholesterol
Above 250 Above 135 Very high
cholesterol
One can interpret the cholesterol numbers based on other risk factors such as age, gender, family history, race, smoking, high blood pressure, physical inactivity, obesity and diabetes. Cholesterol detection for adults using image processing can be classified on the basis of range of mean values. For normal cholesterol, the range of mean values must lie between the range of 55–103 for the age group of 25–40 years and 57–105 for the age group of 40–60 years. If the range of mean values lie between 104–133 for age group 25–40 years and 106–135 for the age group of 40–60 years then they have high cholesterol which is desirable. When the mean values are above 133 for the age group of 25– 40 years and above 135 for the age group of 40–60 years then they have very high cholesterol, which is a major risk factors for coronary heart disease and stroke. Therefore these ranges of mean values are tabulated below.
V. CONCLUSIONS
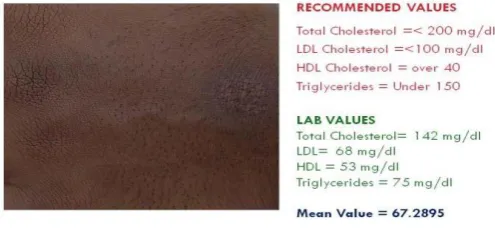
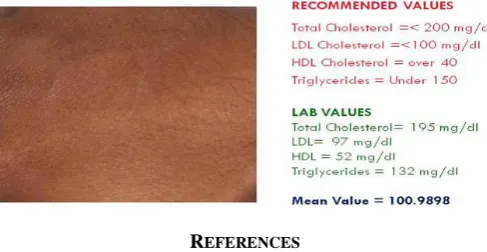
Figure 1 Sample image and its laboratory values with average mean value (see online version for colours)
Then these mean values are examined and a range is obtained on the basis of laboratory tested values. With this range of database we can conclude as till what range the normal cholesterol lies. So the range for the mean values and the laboratory values are tabulated as to which range is the cholesterol normal and to which range it is very high. This range does differ depending upon the age group. Some of the sample images of different age groups and different range of mean values and laboratory values are given below.
Figure 2 Sample image and its laboratory values with average mean value (see online version for colours)
Figure 4 Sample image and its laboratory values with average mean value (see online version for colours)
REFERENCES
[1] Bhattacharyya, A.K., Connor, W.E. and Spector, A.A. (1972) ‘Excretion of sterols from the skin of normal and hypercholesterolemia humans: implications for sterol balance studies’, J ClinInvest, Vol. 51, No. 28, pp.2060–2070.
[2] Shanthi B., Revathy C., Devi A.J.M., Parameshwari P.J., Stephen T., "Serum 25(OH)D and type 2 diabetes mellitus", Journal of Clinical and Diagnostic Research, ISSN : 0973 - 709X, 6(5) (2012) pp.774-776.
[3]Blum, K. (2003) ‘Skin cholesterol indicates presence of plaque build-up in the heart’, 410-955-1534.
[4] Madhubala V., Subhashree A.R., Shanthi B., "Serum carbohydrate deficient transferrin as a sensitive marker in diagnosing alcohol abuse: A case - Control study", Journal of Clinical and Diagnostic Research, ISSN : 0973 - 709X, 7(2) (2013) pp.197-200.
[5] Chang, T-Y. (2008) Method for Detecting Intracellular Cholesterol, published in US Patent 7361482, 22 April, Sugil, Suqeki.
[6] Khanaa V., Thooyamani K.P., Saravanan T., "Simulation of an all optical full adder using optical switch", Indian Journal of Science and Technology, ISSN : 0974-6846, 6(S6)(2013) pp.4733-4736.
[7] Eur Heart, J. (1999) ‘New approaches to dietary management of elevated cholesterol’, Proceedings of an International Conference, Dublin, Ireland, 28–30 January, Vol. 1, Suppl S, pp.S1–S138.
[8] Nagarajan C., Madheswaran M., "Stability analysis of series parallel resonant converter with fuzzy logic controller using state space techniques", Electric Power Components and Systems, ISSN : 1532-5008, 39(8) (2011) pp.780-793.
[9] Nikkari, T., Schreibman, P.H. and Ahrens, E.H., Jr. (1974) ‘In vivo studies of sterol and squalene secretion by human skin’, J Lipid Res, Vol. 15, No. 15, pp.563–573.
[10] Bhat V., "A close-up on obturators using magnets: Part I - Magnets in dentistry", Journal of Indian Prosthodontist Society, ISSN : 0972-4052 , 5(3) (2005) pp.114-118.
[11] Ramlee, R.A. and Ranjit, S. (2009) ‘Using IRIS recognition algorithm, detecting cholesterol presence’, 2009 International Conference on Information Management & Engineering, Kuala Lumpur, Malaysia, ISBN:978-0-7695-3595-1..
[12] B Karthik, TVU Kirankumar, MS Raj, E BharathKumaran,Simulation and Implementation of Speech Compression Algorithm in VLSI, Middle-East Journal of Scientific Research 20 (9), PP 1091-1092, 2013.
[13] A.Geetha, Face Recognition Using OPENCL, International Journal of Advanced Research in Electrical, Electronics and Instrumentation Engineering , ISSN (Print) : 2320 – 3765, pp- 7148-7151, Vol. 3, Issue 2, Febuary 2014.
[14] A.Geetha, Universal Asynchronous Receiver / Transmitter (UART) Design for Hand Held Mobile Devices, International Journal of Advanced Research in Electrical, Electronics and Instrumentation Engineering, ISSN: 2231-5381, pp 25-26, Volume 3 Issue 1 No1 – January 2012.
[15] D.Sridhar raja, Comparison of UWB Band pass filter and EBG embedded UWB Band pass filter, International Journal of Advanced Research in Electrical, Electronics and Instrumentation Engineering, ISSN 2278 – 8875,pp 253-257 ,Vol. 1, Issue 4, October 2012
[16] D.Sridhar raja, Performances of Asymmetric Electromagnetic Band Gap Structure in UWB Band pass notch filter, International Journal of Advanced Research in Electrical, Electronics and Instrumentation Engineering, ISSN (Online): 2278 – 8875,pp 5492-5496, Vol. 2, Issue 11, November 2013