Determinants of Consumer Perception towards Genetically
Modified (GM) Foods in Higher Learning Institutions in Kenya
Eric .K.Bett , Newton Nyairo, David .M.O.Ayieko, Julius. O.Amolo
Department of Agribusiness Management and Trade, Kenyatta University, P.O.Box 43844-0100, Nairobi, Kenya *Corresponding author-Email address: [email protected];
Abstract
Genetically modified organisms (GMOs) have been developed to ensure food and security nutrition in the world, income generation and environmental protection for resource poor farmers. However, there are some unquantifiable risks and claims associated with GMOs. In spite of these risks, the benefits of using GMOs still outweigh the risks associated with their use. Persistent controversies and claims that GMOs are harmful to human health and the environment have led to uncertainty in their adoption by most countries especially in Sub-Saharan Africa (SSA), where hunger is most prevalent. Therefore, this is a clear indication that the benefits of GMOs are unlikely to be realized. In most industrialized countries public perception of GMOs has been thoroughly investigated. In Africa, consumers have a negative perception towards GMO products. Therefore it was on this basis that the study was conducted to assess the consumer perception of genetically modified tomato at Kenyatta University. A total of 100 respondents were sampled using random sampling among various faculties. A questionnaire was administered online and the data analyzed in STATA 11. The results showed that 67% of the respondents were male and there was a significant difference in education level (p<0.001). In addition, the willingness to pay for GM free tomato, GM tomato attributes, acceptance of GM tomato, GM tomato production techniques and consumer awareness on: GM tomato importation, GM tomato safety and knowledge had an influence on consumer perception towards GM tomatoes. It is recommended to focus on establishing information hubs; integrating organic farming approach into extension services and diversification of the marketing strategy to improve on consumer perceptions.
Keywords: Risks, malnutrition, perception, premium, controversies
1.0Introduction
1.1 Background information
There was an increase in the land acreage under genetically modified(GM) crops from 90 million hectares (ha) in 2005 to 170 million hectares (ha) in 2012(James, 2008). This increase was partially because 51 countries had approved the commercial production and marketing of GM crops in 2006 (Wafula et al.,2008). However, in 2008,the top five countries in production of GM crops included United States of America (USA), Argentina, Brazil, Canada and India, with no African countries (ASSA,2010). South Africa was ranked the 8th largest producers of GM crops in the world (Wafula et al., 2008).Some countries like China, Paraguay and South Africa produced GM crops for the first time in 2008 (ASSA, 2010).In addition, Burkina Faso commercialized Bt cotton in 2008, while Egypt was tried to produce maize, water melon, potato, wheat and sugar cane during the same period (Kerembu et al., 2009).
The different views in the world related to the acceptance of GMOs has stirred debate on the acceptance and consumption of GM crops (Qaim and Kouser, 2013; Stein and Crezo, 2009).Europe had anti GM campaigns on human health and the environmental safety (Mannion and Morse, 2013).The consumers in European countries were cautious of the experts and regulators of GM crops (Kim, 2012).The other debatable issues were low awareness and a lack of information on GM foods (Han,1995). Concerns of consumer in Europe resulted in a strict regulatory framework that requiring mandatory labeling of GM products (Kim,2012; Marchant and Cardineau,2010; Han,1995; Jaffe,2004).
Proponents of GM in the world have stated that the benefits of accepting, adopting and consuming GM outweighed the perceived risks (Waltz, 2009; Barfoot and Brooks, 2008; Kleter et al., 2005).First there has been an increase in productivity of GM crops among the resource poor farmers in India, China and South Africa (James, 2008; Finger et al, 2011).Second, in areas where GM were planted in 2006, there was a reduction in carbon emission by 1215x106 Kg (Barfoot and Brooks, 2008). Third, the crops that were planted around GM crops experienced a halo effect, which was a resistance to Diamond Back moth (Carpenter, 2010;Wang et al., 2009). Fourth, the production of GM crops was linked to lower production costs, environmental friendly techniques and low agro- chemical usage (Han,1995;Qaim and Kouser,2013). Finally, there was also an improved income for small holder farmers and a reduction in the price of food (Subramanian and Qaim,2009;Qaim and Kouser,2013).
awareness and information on GM crops led to food scares in Europe, Asia and North America (Kim, 2012). Hallaman et al., (2002) noted that there were fears of a threat to indigenous plants and animals from GM crops. Third, the other fears were reduction in biodiversity of non GM crops and pest resistance (Ammann, 2005; Baxter et al, 2011). However, these perceived risks could not be quantified and safeguards were required (Engel
et al., 1995; Burton et al, 2001). The Chinese government took a cautious approach to commercializing GM products and imposed vigorous safety and regulation measures (Chakraborty,2005).
Sub-Sahara Africa had a low per capita consumption of food and low food security due to low food supply (FAO, 2009).There are 870 million people that suffered from malnutrition in the world between 2010 and 2012, with 198 million found in Sub-Sahara Africa (IFPRI, 2013). There was also a decline in the cereal production from 3.6% to 2.7% and that of tubers from 4.3% to 2.7% (Rosegrant et al., 2004).The decline in food supply and increase in malnutrition threatened the attainment of the millennium development goals (MDGs) (Mbofung,2006).However, there were few countries in Sub-Sahara Africa that were willing to embrace GM technology while others rejected food aid (Cooke and Downie,2010).
Kenya underwent a decline in agricultural growth from 4.7% in the 1960s and 1970s to less than 2% in the 1990s and to 2.4% in the 2000s (GoK, 2010). Despite this scenario there was little developments in the GM technology. It was not until 2006 that a National Biotechnology policy was approved and in 2009 a Biosafety Act was developed. The GM awareness level in Kenya is still low with the rural areas having a higher acceptance than the urban areas (IFPRI, 2013). GM maize was found to have economic benefits to Kenya at US$49 million per year (De Groote et al, 2003).The perception of consumers found in Higher learning institutions is still unknown. This perception is important because these consumers inform policy making regarding GM crops in Kenya. Therefore it was on this basis that the present study was done with the following objective: To assess public perception towards GM crops and foods in Kenyan higher learning institutions.
1.2 Literature review
Oladele and Akinsorotan (2007) conducted a study in Nigeria to assess the perception of GMO by scientists at agriculture research universities. The results showed the perception was positively affected by awareness, gender, marital status, educational qualification, religion, and years of experience, radio, fellow researchers and access to radio. A Study by Huffman et al., (2004) showed that consumer preferences for GM were affected by education, age and religious beliefs. Baker and Burnham (2001) showed that demographic variables had no significant effect on the consumer preference for GM food products. Curtis et al, (2004) showed that the perception of consumers on the GM foods in developing countries was influenced by media; trust in government and positive perception of science. There are studies that focused on the effect of socioeconomic issues on consumers’ GM perceptions (Ronald, 2011).
Huffman et al. (2003) reported that food labeling had a significant effect on the consumer preference for GM food product. The consumer perceptions have been linked to information and willingness to pay more for GM free food (Soregaroli et al, 2003). The consumers have been shown to pay a premium for products which give a positive benefit (Colson and Hoffman, 2011; McCluskey and Wohl, 2004). Kaneko and Chern (2005) showed that when a discount was given the consumers were willing to accept GM food products. A study by Greenpeace (2002) showed that 65% of consumers in China who were aware of GM food preferred non GM food products. The consumer is ready to pay for non GM food mandatory labeling as long as they are beneficial to the society (Crespi and Marette, 2003). Kushwaha et al (2004) focused on the influence of positive information and ethical issues on consumer acceptance of GM food products.
A study by Kim (2012) showed a low level of consumer awareness on GM foods. The low level of awareness on GM foods results from lack of information and labeling of GM products (Hallman, 2003; Han, 1995). However Frewer et al (1994) showed that choice of GM was unrelated to awareness. Furedi (1997) showed that moral values affect the consumer perception of risks that come with GM food products. The other sources that influence consumer perception of the GM food products include experts and scientific institutions, general attitude of other people, trust in institutions (Chen and Li, 2007; Siegrist, 2000).
Rosati and Saba (2000) showed acceptance of GM foods or products to be linked with the consumers’ belief on the risks or benefits of biotechnology. Curtis et al (2004) showed a small level of risk perception of GM consumers. Consumer attitude to GM foods products in the developed world is generally negative due to perceptions about unknown environmental and health consequences (Curtis et al, 2004).
The studies reviewed in this section have focused on consumer preference of GM food products. A few of the studies reviewed have applied a quantitative analysis in assessing the consumer GM food products preference. There are even fewer studies that have assessed the consumer preference and specifically those found in Kenyan universities. This analysis is important as most of the GM technology is found in universities and research institutions. In addition other consumers in Kenya rely on the universities and research institutions for information on GM food products. The policy formulation in Kenya and implementation also rely on the input of the researchers and scientist.
1.3Theoretical and Conceptual framework
There are different approaches that have been applied in research on consumer perception to new technologies (Lind, 1987; Kaperson, 1989).These studies assessed risks that are perceived by consumers in the use of a new technology and related it to consumer behavior. The behavior of the consumer is then manifested in the choices. The choices can either be to use the new technology or not. According to Knox (2012) there are risks that are related to food choice and corresponding methods of estimating them. There is a need to understand these subjective perceptions and meanings. In addition some cultural and social issues affect the consumer perception of food safety. However there are few studies that are related to food and apply this perception of risk.
There are several theories related to consumer perception and risk. According to Kontek (2010) the decision utility theory as proposed by Von Neumann and Morgenstern (1944) assumes that a consumer satisfies the rationality axioms, which allows the utility to be represented as a function. The utilities can be represented as U (A), U (B) or U (N).
Lancaster (1966) outlines the assumptions behind the utility theory. First, this theory proposes that the choice of the consumer depends only on the surrounding state. Second, the utility shows the satisfaction that a consumer derives from an alternative. If a consumer derives a higher utility from alternative A than from alternative B, then that relationship is shown as: U (A)>U (B), where U represent the utility from the alternatives. The third assumption is that the preferences are well ordered. The utility is also not directly observed and is manifested in the choices made by the consumers. In addition the utility are not comparable across individuals. Finally the utility are constrained by revealed preferences.
The present study adopted the framework proposed by Cembalo et al (2002).This framework as shown in Figure 1 attempted to explain the behavior of a consumer on the basis of perceived risks and benefits. The individual balance behavior is influenced by the propensity to assume a risky behavior on one hand and perception of the danger level on the other. This balanced behavior is the expected to result into rewards on one hand or an accident on the other hand. The rewards are then expected to have a direct effect on the propensity to assume risky behavior. An accident is also expected to affect the perception level of danger.
2.0Materials and Methods
2.1 Study area
The study was conducted at Kenyatta University in Nairobi, Kenya. The total area of Nairobi is 700 Kms2 and is 1600-1850 m above sea level. Nairobi lies between latitude 109׳S,10 28׳S and longitude 3604׳E,37010׳E(Mitullah, 2003). Nairobi receives an annual rainfall of between 850mm-1500 mm in a bimodal distribution. The temperature range of Nairobi is 120C to 260C (CBS, 2010). The population of Nairobi is estimated at 3 million people (KNBS, 2010).
According to Kenyatta University ,KU(2013),Kenyatta University is located 23 kilometers North of Nairobi city at the latitude 1o10’56’S/36o55’28’’E.The history of Kenyatta University can be traced back to 1965, when the Templar Barracks was handed over to the Government of Kenya by the British Government(KU,2013). These Barracks was converted to Kenyatta College ,which later became a fully fledged university in 1985(KU,2012).The University has a total of 15 schools , which include: Pure and applied science, environmental science, applied human science, business, health science, visual and performing arts, engineering and technology, agriculture and enterprise development, economics ,education, medicine, public health, hospitality and tourism and law(KU,2013). The total population of the University is about 40,000(KU,2012).
2.2 Data and sampling design
The data was collected using a questionnaire to address the objectives of the study. The questionnaire contained perception statements on GMOs. These statements focused on GM production, consumer shopping habits, information on GMOs, and the knowledge of consumers on GMOs and socioeconomic characteristics of the consumers. Apart from the socioeconomic characteristics of the consumers, all the other statements were ranked on a Likert scale of 1 to 5.The responses were ranked 1(strongly disagree) to 5(Strongly agree).
non-teaching staff.
2.3 Data analysis
The data collected was analyzed using qualitative and quantitative methods. The socio-economic characteristics were analyzed and the results represented as means, maximum, minimum and their standard deviations. The response to the questions were also tabulated and the response shown in terms of percentages. This approach was also used in studies of consumer perception of GMOs (Oladele and Akinsorotan, 2007; Kim, 2012; Kimenju et al, 2005; Curtis et al, 2004).The data was further analysed using a principal component analysis (PCA) to reduced the number of variables and identify the most important variables.
2.3.1 Principal Component Analysis (PCA)
The principal component analysis (PCA) was used in reducing the number of variables. The PCA is an important data reduction technique that derives new variables from current variables. The aim of the PCA approach is to get maximum variance from the variables (Wang, 2009). This process involved 4 main steps which lead to generation of principal components.
The first step in the PCA involved ensuring there was a sampling adequacy. This involved subjection of the variables to a Kaiser Meyer Oklin (KMO) test. It is agreed based on the KMO rule that those variables with a value equal to or greater than 0.6 can be used in further analysis (Vines, 2000). The second step involved calculating of eigenvalues, eigenvectors and accumulative variance proportion. The variables that had an eigenvalues equal to or greater than 1 were considered for further analysis (Kaiser, 1974). The results were produced to show the correlation between the components and the variables in a component matrix. This component matrix was rotated in a varimax rotation to show the variables that contributed a large variance to the respective components.
The last step involved explanation of the principal components. The variables that had a correlation coefficient of 0.3 or more were retained from the varimax rotation (Tabachnick and Fidell, 2001). The varimax rotation is an orthogonal rotation that attempts to maximize the variance of the square loadings on factor (Kim and Mueller, 1978). The variables were then used the in explanation of the components.
3.0Results and discussions
3.1 Socioeconomic characteristics of Consumers
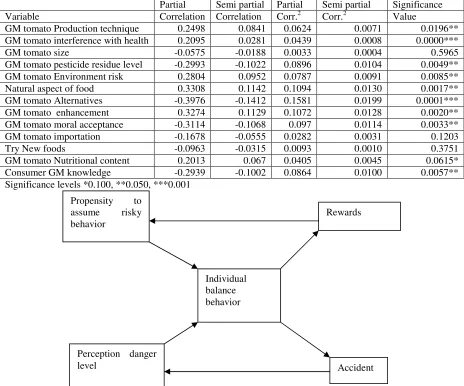
The results in Table 1 show that 67%of the respondents were male. There were 26% of the individuals that were sampled that had an income of between Ksh 10,001 and 20,000(Figure 2).On the other hand 32% of the respondents had an income greater than Ksh 40,001.There was only 8% of the respondents that had an income of between Ksh.30,001 and Ksh.40,000.The results in Table 2 show the two way table of the age and education levels of the consumers that were interviewed.3.2 Response to questions
The results in Table 3 showed those perception statements that were found to have statistical difference between the responses. In addition the Keiser-Meyer-Oklin (KMO) values are shown in Table 3. These perception statements were then subjected to a principle component analysis (PCA).
3.3 The relationship between the consumers Perception and choice of GM tomatoes
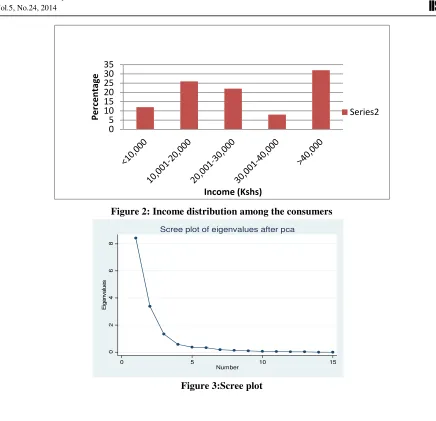
The results shown in Table 4 include the eigenvalues, difference, proportion and cumulative. There were 3 components that had an eigenvalues greater than 1, which is the value that is recommended by the Kaiser Rule (Kaiser, 1974).Therefore the 3 components accounted for 87.61% of the variance in the variables. These three components are therefore important in explaining the consumer perception towards GM tomatoes at Kenyatta University. The number of components corresponds to the point where an elbow is observed on the scree plot in figure 3.The component matrix was rotated using the varimax rotation which gave loading coefficients (Table 5). The willingness to pay 30% premium for organic tomato and the willingness to pay a premium of 15% for GM free certified tomato had the highest weights in component 1(Table 5). Therefore the component 1 could represent GM food purchasing decisions. The other variables that had a significant correlation with purchasing decisions included: Nutritional content, pesticide residue levels and positive enhancement benefits (Table 6). The studies by (Soregaroli et al., 2003; Crespi and Marette, 2003; Colson and Hoffman, 2011) reported that consumers were willing to pay a premium to get GM free foods. However (Kaneko and Chern 2008) reported that some consumers were willing to accept GM foods at a discounted price.
The moral acceptance of organic foods and encouragement of organic food production had high weights on component 2. This component could therefore have represented consumer acceptance of GM food production. There was a significant correlation between GM moral acceptance and consumer choice of GM tomatoes (Table 6).Therefore this indicated that the consumer perception of GM food was influenced by their beliefs and morals values. Rosati and Saba (2000) reported that there was a relationship between consumer beliefs and perception of GM foods. On the other hand moral issues have also been noted to have an effect on the consumer perception of GM foods.
knowledge and consumer choices of GM tomatoes (Table 6).The variables related to the consumer awareness (GM effect on human health, environment and GM importation) had a significant correlation with consumer choices of GM tomatoes (Table 6).Oladele and Akinsorotan (2007) showed that there was a relationship between consumer awareness and perception of GM foods. On the other hand Frewer et al (1994) showed that there was no relationship between consumer awareness and perception to GM foods.
4.0Conclusions and Recommendations
This study shows that there are 3 components that explain consumer perception of GM tomatoes at Kenyatta University. These components are consumers GM foods purchasing decisions, consumers moral values and consumer awareness. The 3 components contain variables that have a significant correlation with consumer choices of GM tomatoes.
The study further shows that consumer’s perception of the GM tomatoes had a correlation with the attributes of the GM tomatoes. This included naturalness, nutritional content and inherent benefits from GM tomatoes. The consumers’ perception on organic methods of tomatoes production and morally acceptable production methods also had a relationship. This implies that the marketing of GM tomatoes should consider the mentioned tomato product attributes in promotion strategies. There is also a need for extension services to integrate and promote organic production methods in tomatoes.
The third component showed that there was a correlation between consumer perception of GM tomatoes and consumer awareness of GM tomatoes. These aspects included consumer knowledge on importation of GM tomatoes, Knowledge on GM interference with the human genetic makeup and risk of organic production method to the environment. This means there is a need for awareness creation through extension services and information hubs. In addition use of print and electronic media should be employed in raising awareness levels.
Acknowledgement
The authors would like to acknowledge and appreciate The Network for Agriculture, Agro forestry and Natural Resources Education(ANAFE) for the funding and logistical support offered to this study. In addition we would like to appreciate the respondents that participated in this study for their cooperation during the data collection process.
References
Ammann, K. (2005). Effects of biotechnology on biodiversity: herbicide-tolerant and insect-resistant GM crops.
Trends in Biotechnology, 23: 388-394.
Baker, G.A., & Burnham, T.A. (2001). “Consumer Response to Genetically Modified Foods: Market Segment Analysis and Implications for Producers and Policy Makers.” Journal of Agricultural and Resource Economics. 26(2):387-403
Barfoot, P., & Brookes, G. (2008) Global impact of biotech crops: Socio-economic and environmental effects, 1996-2006. AgBioForum 11: 21-38.
Baxter, S.W., Badenes-Pe´rez, F.R., Morrison A, et al. (2011). Parallel evolution of Bacillus thurigensis toxin resistance in Lepidoptera. Genetics, 189, 675–9.
Burton, M., Rigby, D., Young, T., James, S (2001). Consumer attitudes to genetically modified organisms in food in the UK. Eur Rev Agric Econ; 28:479-98; http://dx.doi.org/10.1093/erae/28.4.479
Carpenter, J.E. (2010) Peer-reviewed surveys indicate positive impact of commercialized GM crops. Nature Biotechnology 28:219-221.
CBS (2003).Statistical Abstract Central Bureau of Statistics (CBS), Nairobi
Cembalo, L., Cicia, G., Verneau, F., (2002). Willingness to pay for a GM tomato: an experimental test. Working paper no 9/2002.Collona Working paper. Dipartimento Di Economia e politica agrarian. Universita degle studi di Napoli Federico II.
Chakraborty, K. (2005), Consumers' attitude towards hormone-free milk: what have we learned?, Applied Economics Letters12(10), 633 – 637.
Chen, M.F., Li, H.L., (2007) .The consumers’ attitude toward genetically modified food in Taiwan. Food Quality and Preference 18(4): 662–674.
Colson, G., Huffman, W.E., (2011). Consumers’ willingness to pay for genetically modified foods with product enhancing nutritional attributes. Am J Agric Econ .93:358-63.
Cooke, G, J., & Downie, R., (2010).African perspectives on Genetically modified crops.assesing the Debate in Zambia, Kenya and South Africa. A report of the CSIS Global food Security Project.
Curtis, K.R., McCluskey, J.J. & Whal, T.I. (2004). Consumer acceptance of genetically modified Food Products in the developing world, AgBioForum.
2003
Engel, K, H., Takeoka, G., & Teranishi, R. (1995).Genetically Modified foods: Safety Aspects. Washington, DC.ACS.
FAO (Food and Agriculture Organization, United Nations). (2009). 1.02 billion people hungry.,Rome,Italy:FAO.Availableat:http://www.fao.org/news/story/en/item/20568/icode/ [Accessed 5th October].
Finger, R., El Benni N., Kaphengst T., Evans C., Herbert S., Lehmann B., Morse S & Stupak N. (2011).A meta-analysis on farm-level costs and benefits of GM crops. Sustainability 3(5): 743-762.
Frewer, L., Fischer, A., Scholderer, J. & Verbeke, W. (2005). Food safety and consumer behaviour. In W. M. F. Jongen and M. T. G. Meulenberg (eds), Innovation of Food Production Systems: Product Quality and Consumer Acceptance. Wageningen: Wageningen Academic Publishers, in press.
Furedi, F. (1997). Culture of fear: Risk-taking and the morality of low expectation. London-New York: Continuum.
Government of Kenya, “A National Biotechnology Development Policy, 2010,” available athttp://www.biosafetykenya.co.ke/documents/BIOTECHNOLOGY%20POLICY%20FOR%20KENY A%20 SUMMARY%20nov06.pdf.
Greenpeace, (2002). USAID and GM Food Aid. Greenpeace, London. Available from :< www.greenpeace.org.uk>.
Hallaman, W, K., Adelaja A.O, Schilling, J., & Lang (2002).Public perceptions of Genetically Modified foods. Americans Know Not What they Eat. Publication No RR-0302-001 food policy Instiute, Rutgers University.
Han, J., H. (1995).Effects of Perception on consumer acceptance of Genetically modified (GM) foods. A dissertation submitted to Graduate faculty of the Louisiana State University and Agricultural and Mechanical College in Partial fulfillment of the requirement for degree of Doctor of Philosophy. Huffman, W. E., J. F. Shogren, M. Rousu, & A. Tegene. (2003). Consumer Willingness to Pay for Genetically
Modified Food Labels in a Market with Diverse Information: Evidence from Experimental Auctions.
Journal of Agricultural and Resource Economics 28(3): 481-502.
IFPRI (2013).Synopsis. Genetically modified crops in Africa Economic and policy lessons from countries South of Sahara.IFPRI Issue brief 90.
ISAAA (International Service for the Acquisition of Agri-Biotech Applications) (2008). Global status of commercialised biotech/GM crops. ISAAA Brief 39-2008.
ISAAA. (International Service for the Acquisition of Agri-Biotech Applications) 2011. Global Status of Commercialized Biotech/GM Crops: 2011. 43–2011. ISAAA Briefs, International Service for the Acquisition of Agri-Biotech Applications (ISAAA), Manila, Philippines; Nairobi, Kenya, Africa; Ithaca, New York, USA.
Jaffe G. (2004). Regulating transgenic crops: a comparative analysis of different regulatory processes. Transgenic Res, 13, 5–19.
James, C. (2008). Global status of commercialized biotech/GM Crops: 2008. ISAAA Brief No. 39 – 2008.Ithaca, New York: ISAAA (International Service for the Acquisition of Agri-biotech Applications).
Crespi, J, M., Marette, S, E., (2003). “Does contain” vs. “Does Not Contain”: Does it Matter which GMO Label is used? European Journal of Law and Economics, 16: 327–344.
Kaiser, H. F., (1974). The varimax methods of factor analysis. Unpublished doctoral dissertation, University of California, Berkeley.
Kaneko, N & Chern, W. (2005). Willingness to Pay for Genetically Modified Oil, Cornflakes, and Salmon: Evidence from a U.S. Telephone Survey. Journal of Agricultural and Applied Economics 37: 701-719. Kasperson, R., O. Renn, P. Slovic, J. X. Kasperson, e S. Emani (1989).The Social Amplification of Risk: A
conceptual Framework. Risk Analysis 8, 177–187.
Kenya National Bureau of Statistics(KNBS,2010).Kenya 2009 Population and housing census
Kenyatta University(KU)(2012).Centre for linkages and international programmes(CLIP).Retrieved November 5,2014 from www.ku.ac.ke/linkages/images/stories/docs/new-brochure-2012.pdf
Kenyatta University(KU)(2013).Student information handbook 2014-2015.Retrived November 5,2014 from www.ku.ac.ke/index.php/about-ku/.../ku..../87/230-nakuru-campus
Kerembu, M., Nguthi, F. & Ismail, H. (2009). Biotech crops in Africa: The final frontier. ISAAA AfriCenter, Nairobi, Kenya.
Kim, J.O. and Mueller, C. W., (1978). Factor analysis: Statistic methods and practical issues. Beverly Hills, CA: Sage.
Kim, Y. T., (2009). Controversy Over Extension of GM food labeling in South Korea, the Monthly Food Industry. May 2009
Korea. Implications for food policy.Inzinerine Ekonomika-Engineering Economics 22(2), 189-199 Kimenju, S.C., De Groote, H., Karugia, J., Mbogoh S., Poland D (2005). Consumer awareness and attitudes
toward GM foods in Kenya. Afr J Biotechnology; 4:1066-75
Kleter, G. A., Peinnenburg, C. M., & Aarts, H. J. M. (2005). Health Considerations Regarding Horizontal Gene Transfer of Microbial Transgenes Present in Genetically Modified Crops. Journal of Biomedicine and Biotechnology, 4, 326-52.
Knox, O.G.G., Walker, R.L., Booth, E.J., Crossan, A.N., Gupta, V.V.S.R., (2012) Capitalizing on deliberate, accidental, and GM-driven environmental change caused by crop modification. Journal of Experimental Botany 63: 543-549.
Krzysztof, K (2010).Decision Utility theory: Back to Von Neumman, Mongenstern, and Markowitz.MPRA Personal RePEC Archive. Online at http//mpra.ub.uni-muenchen.de/27141/MPRA paper No.27141 posted 1 December 2010:15:19 UTC
Kushwaha, S, Musa, A, S, James Lavenberg-De Boer, Joan Fulton (2004).Consumer acceptance of GMO cowpeas in Sub-Saharan Africa. Long Paper# 119265, American Agricultural Economists Association Annual meeting.
Lancaster, K. (1966). A new approach to consumer theory. Journal of Political Economy. 84: 132-157 Lind, N. (1987). Is Risk Analysis an Emerging Profession? Risk Abstracts 4, 167–169.
Mannion, A.M., & Morse, S (2013).GM Crops 1996-2012:A review of agronomic, environmental and socio-economic impacts center for Environmental strategy. Working paper 04/13.University of Surrey Marchant, G,E., Cardinaeau ,G.A., Reddick, T.P.(2010). Thwarting consumer choice: the case against mandatory
labeling for genetically modified foods. Washington, D.C.: AEI Press.
Mbofung, C.M.F. (2006). Quality control in foods. Journal of the Cameroon Academy of Sciences, 6(1):53-62. McCluskey, J.J., Grimsrud, K.M., Ouchi, H., & Wahl, T.I. (2003). Consumer Response to Genetically Modified
Food Products in Japan. Agricultural and Resource Economics Review 32:222-231.
Mitullah ,W (2003). Understanding Slums: Case Studies for the Global Report on Human Settlements 2003: The Case of Nairobi, Kenya UN-HABITAT, Nairobi
Oladele, O. I., & Akinsorotan O,A(2007).The attitude towards Genetically Modified Organisms(GMOs) and their effect on health and environment in Southwestern Nigeria: Scientist perceptions. Journal of Central European Agriculture.Vol 8.No 1(91-98)
Paarlberg, R. (2002). The real threat to GM crops in poor countries: consumer and policy resistance to GM foods in rich countries. Food Policy 27: 247-250. Pattison
Qaim, M., & Kouser, S (2013).Genetically Modified crops and food security. Open access article Plus one. Retrieved from www.ncbi.nlm.gov>NCBI>literature>Pubmed Central(PMC)
Ronald, P.C (2011) .Plant genetics, sustainable agriculture and global food security. Genetics 188: 11-20. Rosati, S., & Saba, A (2000). Factors Influencing the Acceptance of Food Biotechnology. Italian Journal of
Food Science, 12(4), 425-434.
Rosegrant, M.W., Cline, S.A., Weibo, L., Sulser, T. & Valmonte-Santos, R.A. 2004. Excerpt 2: Looking ahead: long-term prospects for Africa’s food and nutrition security. In: Assuring Food and Nutrition Security inAfrica by 2020, Proceedings of an All-Africa Conference, Kampala, Uganda, 1–3 April, Washington DC, pp. 23-26.
Shaner, D.L., Lindenmeyer, R.B., Ostlie MH. (2012). What have the mechanisms of resistance to glyphosate taught us? Pest Management Sci,68, 3–9.
Siegrist, M (2000) .The influence of trust and perceptions of risks and benefits on the acceptance of gene technology. Risk Analysis 20(2):195–203.
Soregaroli, C., Boccaletti, S., Moro, D. (2003). Consumers’ attitudes towards labeled and unlabeled GM Products in Italy. IAMA World Food and Agribusiness Forum Proceedings, June 23-24, 2003, Cancun, Mexico
Stein, A.J., & Cerezo, E.R. (2010). Low-level presence of new GM crops: An issue on the rise for countries where they lack approval. AgBioForum 13(2):173–182.
Stein, Alexander, J., & Rodriguez-Cerezo, Emilion (2009). The Global Pipeline of New GM Crops: Implications of asynchronous approval for international trade. European Commission, EUR 23486 EN-2009. Subramanian, A. & Qaim, M.( 2009). Village-wide effects of agricultural biotechnology: the case of Bt Cotton in
India. World Development, 37(1): 256-267.
Tabachnick, B. G., & Fidell, L. S. (2001). Using Multivariate Statistics. Boston: Allyn and Bacon Vines S (2000).Simple principal components analysis. Applied Statictics.441-451
Von Neumann J., Morgenstern O., (1944). The Theory of Games and Economic Behavior, Princeton University Press.
Waltz E (2009) Battlefield. Nature 461: 27-32.
Wang G, Wu Y, Gao W, Fok M, Liang W.( 2009). Impact of Bt cotton on the farmer’s livelihood system in China. Life Sci. Int. J. Spec. Ed. on Cotton Policies, 1:132–39.
Table 1: The distribution of sex of the respondents
Sex Frequency Percentage
Female 33 33
Male 67 67
100 100
Table 2: Education levels of the respondents
Education Level Total
Age(Years) Elementary Technical Dip BS MS PHD
20-30 11 0 0 0 0 0 11
31-40 0 2 15 57 0 0 74
41-50 0 0 0 1 4 0 5
51-60 0 0 0 0 1 5 6
≥
61 0 0 0 0 0 4 4Total 100
Pearson Chi 2(20) =257.0908 Pr=0.000 fisher’s exact=0.000
Table 3: The significant levels of perception statements and KMO values
Perception statements
Pearson
Chi2 p value
Agree (%)
No opinion
(%)
Disagr ee (%)
KMO value
Preference for organic tomato at 30%
higher price 12.11 0.009**
22 21 57 0.7673
Preference for GM free cert tomato 15%
higher price 11.83 0.014**
22 28 50 0.7707
I like to try new foods that I have never
tasted before 15.79 0.004**
27 12 60 0.9111
Naturalness food of the food I buy is
important quality 11.84 0.037**
11 3 86 0.8842
It is important to choose food for their
nutritional value 15.81 0.002**
10 4 85 0.8392
I have good knowledge GM foods 12.05 0.017** 29 9 62 0.9101
It is allowed to import GM tomatoes into
Kenya 11.21 0.042**
50 31 19 0.8407
GM is enhanced with positive effects 12.53 0.018** 32 19 43 0.9686 GM foods interfere with human genetic 13.48 0.013** 35 28 37 0.9333 GM tomatoes are bigger than ordinary
ones 13.08 0.013**
33 25 43 0.9088
GM food production is morally accepted 10.56 0.04** 8 5 88 0.8318 GM food production should be
encouraged 15.49 0.003**
4 8 88 0.7996
GM food production is risky to the
environment 13.37 0.009**
77 14 9 0.8404
GM tomato production is more
environment friendly 12.93 0.023**
34 17 49 0.9633
GM tomatoes if it contained less
pesticides residues 17.06 0.003**
31 12 57 0.8590
Table 4: The eigenvalues of the extracted components
Component Eigen value Difference Proportion Cumulative
Component1 8.42468 5.0455 0.5616 0.5616
Component2 3.37918 2.04088 0.2253 0.7869
Table 5: The varimax rotation
Perception statements Comp1 comp2 comp3 Unexplained
Willingness to pay a premium of 30% for organic tomato -0.4184 0.1701 Willingness to pay a 15% premium for GM free certified
tomato -0.4518 0.1112
I like to try new foods that I have never tasted before 0.3581 0.08968 Naturalness food of the food i buy is an important quality 0.4226 0.06285 It is important to choose food for their nutritional value 0.4077 0.08975
I have good knowledge GM foods 0.3357 0.1323
It is allowed to import GM tomatoes into Kenya 0.6000 0.2224
GM is enhanced with positive effects 0.4397 0.0391
GM food production is morally accepted 0.4439 0.05172
GM foods interfere with human genetic 0.3564 0.2368
GM food production is risky to the environment 0.6443 0.2555
GM tomato production is more environment friendly 0.3694 0.07397 GM tomatoes if it contained less pesticides residues 0.3745 0.0577
Table 6: Partial and semi partial correlation between choice of GM tomatoes and the perception variables
Partial Semi partial Partial Semi partial Significance
Variable Correlation Correlation Corr.2 Corr.2 Value
GM tomato Production technique 0.2498 0.0841 0.0624 0.0071 0.0196** GM tomato interference with health 0.2095 0.0281 0.0439 0.0008 0.0000***
GM tomato size -0.0575 -0.0188 0.0033 0.0004 0.5965
GM tomato pesticide residue level -0.2993 -0.1022 0.0896 0.0104 0.0049**
GM tomato Environment risk 0.2804 0.0952 0.0787 0.0091 0.0085**
Natural aspect of food 0.3308 0.1142 0.1094 0.0130 0.0017**
GM tomato Alternatives -0.3976 -0.1412 0.1581 0.0199 0.0001***
GM tomato enhancement 0.3274 0.1129 0.1072 0.0128 0.0020**
GM tomato moral acceptance -0.3114 -0.1068 0.097 0.0114 0.0033**
GM tomato importation -0.1678 -0.0555 0.0282 0.0031 0.1203
Try New foods -0.0963 -0.0315 0.0093 0.0010 0.3751
GM tomato Nutritional content 0.2013 0.067 0.0405 0.0045 0.0615*
Consumer GM knowledge -0.2939 -0.1002 0.0864 0.0100 0.0057**
Significance levels *0.100, **0.050, ***0.001
Figure 1: Conceptual Framework (Adopted from Cembalo et al, 2002) Propensity to
assume risky behavior
Individual balance behavior
Perception danger
level Accident
Figure 2: Income distribution among the consumers
Figure 3:Scree plot 0
5 10 15 20 25 30 35
P
e
rc
e
n
tag
e
Income (Kshs)
Series2
0
2
4
6
8
E
ig
e
n
v
a
lu
e
s
0 5 10 15
Number