1
P.Venkata Sai Teja Reddy,
2Madhuri Karamthote Chiniya,
3Vinay Kumar Myadam,
4Suresh Kumar Kondoju [M.E,(Ph.D)]
Abstract— This paper presents the development of a cyber-physical system that monitors the environmental conditions or the ambient conditions in indoor spaces at remote locations. The communication between the system’s components is per-formed using the existent wireless infrastructure based on the IEEE 802.11 b/g standards. The resulted solution provides the possibility of logging measurements from locations all over the world and of visualizing and analyzing the gathered data from any device connected to the Internet. This work encompasses the complete solution, a cyber-physical system, starting from the physical level, consisting of sensors and the communication protocol, and reaching data management and storage at the cyber level. The experimental results show that the proposed system represents a viable and straightforward solution for environmental and ambient monitoring applications.
Index Terms— Cyber-physical systems (CPSs), IEEE 802.11 standards, Internet of Things (IoT), wireless communication.
I. INTRODUCTION
T
HE IMPORTANCE of environmental monitoring is undoubted in our age. This is the field where wireless sensor networks (WSNs) have been first used, their primary purpose consisting in the observation of the physical world and the recording of physical quantities characterizing it [1]. WSNs are large networks of resource-constrained sensors with processing and wireless communication capabilities, which implement different application objectives within a specific sensing field. They can also be used for ambient monitoring, a topic of great interest nowadays as well, indoor air quality representing an important factor affecting the comfort, health, and safety of building occupants [2], [3]. Finally, the use of wireless ambient sensors can lead to more energy-efficient buildings [4].The constant attempts of social and economic bodies for the development of technologies for improving energy efficiency and reducing pollution and for the more efficient use of
national infrastructure along with the needs of decreasing the cost of computation, networking, and sensing had lead to the emergence of a new generation of digital systems, called cyber-physical systems (CPSs), less than a decade ago. These include embedded systems, sensor networks, actuators, coordination and management processes, and services to cap-ture physical data and to act on the physical environment, all integrated under an intelligent decision system [5], [6]. In this context, wireless sensors can be used to collect physical information that is further exploited by CPSs [7]. This will lead to CPSs composed of interconnected clusters of process-ing elements and large-scale wired and wireless networks of sensors and actuators gathering data about and acting upon the environment [8]. These newly appeared systems have a lot of similarities with the Internet of Things (IoT), an enabler of ubiquitous sensing, that envisions a world in which many billions of Internet-connected objects or things, with sensing, communication, computing, and potentially actuating capabilities, will coexist, allowing an uninterrupted connection between people and things [9].
This paper presents a system for environmental and ambient parameter monitoring using low-power wireless sensors con-nected to the Internet, which send their measurements to a central server using the IEEE 802.11 b/g standards. Finally, data from all over the world, stored on the base station, can be remotely visualized from every device connected to the Internet. This overcomes the problem of system integra-tion and interoperability, providing a well-defined architecture that simplifies the transmission of data from sensors with different measurement capabilities and increases supervisory efficiency [10]. Until recently, Wi-Fi technology has not been considered for implementing wireless sensing solutions because of its inability to meet the challenges in these types of systems, with the major drawback consisting in the unsatis-factory energy consumption. However, this has changed, since new power-efficient Wi-Fi devices have been developed and new solutions can benefit from several advantages offered by this technology, namely, the reduction of infrastructure costs while improving total ownership costs, native IP-network compatibility, and the existence of familiar protocols and management tools [11]. Furthermore, high transmission rates, which are required in industrial applications, are achievable and the access to the network in this case is easy and no special wireless adapters are required [12].
The rest of this paper is structured as follows. The next section presents the context of the present work, while Section III talks about the current trends and also
IOT Based Environmental Monitoring
System Using Wireless Sensor Networks
the motivation of using wireless sensors in the context of CPSs and of the IoT. Section IV gives a description of the developed CPS, with its two main components, the Wi-Fi sensors and the data-center. The general structure of the system and the main characteristics of the two types of devices are presented here. Section V presents the experimental results of the proposed system, highlighting the performances characteristics in terms of reliability influenced by package losses. Finally, Section VI gives the concluding remarks and the directions for future work.
II. RELATEDWORK ANDCONTRIBUTION
The literature contains a large number of efforts for developing monitoring solutions that benefit from the advan-tages provided by wireless sensing technology. Reference [13] presents an automated irrigation system based on a distributed wireless network of soil moisture and temperature sensors that achieves water savings of 90% compared with traditional implementations. Sentinella is a smart monitoring solution for the assessment of possible causes of power inefficiency at the photovoltaic panel level based on WSNs [14]. The employment of WSNs in smart grid applications and electrical energy monitoring solutions for large buildings was also inves-tigated [15], [16]. A series of industrial WSNs achieving the acquisition of heterogeneous sensor signals, higher sampling rates, and higher reliability levels has been developed as well [17], [18]. However, most of the proposed solutions are based on the IEEE 802.15.4 standard and ZigBee applications, and they rely on gateways when the data has to be sent to the Internet [13], [16]–[18]. Furthermore, in this case, additional applications have to be developed for encapsulating the data in Internet protocols, such as user datagram protocol (UDP) or transmission control protocol (TCP). Another promising technology providing high power efficiency is Bluetooth Low Energy (BLE), which was first introduced in 2010 with the goal of expanding the use of Bluetooth to power-constrained devices such as wireless sensors [19]. However, a lot of research work still has to be performed in this direction, for finally being able to receive relevant information from remote BLE-enabled devices requiring small amounts of data communication and energy. Furthermore, gateways are also required for sending the data to the Internet. Therefore, the use of Wi-Fi sensors, as the ones in the system presented in this paper, which connect directly to the existing IEEE 802.11 b/g infrastructure seems to be a better, more straightforward, and less expensive solution. This is beneficial especially for applications deployed in indoor spaces or urban areas, where there is a high probability that access points are present.
The main contribution of this paper, a continuation of [20] and [21], consists in the development of a reli-able, stand-alone, low-cost, and low-power scalable system, with reduced total cost of ownership (TCO), allowing the remote visualization of environmental and ambient data in places where IEEE 802.11 b/g network coverage exists. Reference [20] presents a complete solution for temperature and relative humidity monitoring using low-power wireless devices, allowing a battery lifetime of 2 years when a 20-min measurement cycle is used. Here, a data viewer
and data processing application, running on a personal com-puter, is included. This provides functionalities for alarming the user by e-mail or SMS. Reference [21] describes the development of compact battery-powered systems allowing the monitoring of carbon dioxide levels, temperatures, relative humidity, absolute pressure, and light intensity, which send the data using the existent wireless infrastructure based on the IEEE 802.11 standards. A LabVIEW application that gathers the data from the sensors and places them on a public cloud for the IoT was also developed, demonstrating the possibility of recording and visualizing data from every place where an Internet connection is available.
The work presented here leads to a ubiquitous network architecture, where the sensors are part of the Internet [22]. The developed monitoring solution, a CPS that incorporates all the developed Wi-Fi sensors and a cloud platform, allows the acquisition of data from every place where a wireless IEEE 802.11 network exists and the visualization of recorded data from every terminal connected to the Internet, without any additional hardware and software application other that an Internet browser. The novelty of the hardware and software implementation in the case of the proposed system consists in the development of a reliable stand-alone solution with a reduced power consumption of all its components, namely, the wireless sensors and the cloud platform. The choices regarding the used components and their hardware and software design lead to a low-cost system with reduced TCO. The previous work showed that the developed sensors can operate for approximately 3 years on a single 3 V battery [21]. Although the development of IEEE 802.11-based sensors may not be new, the power efficiency of the developed sensors represents a significant contribution, achieving a battery lifetime similar to the one provided by more power-efficient solutions, based on IEEE 802.15.4/ZigBee communication. The proposed mon-itoring system takes advantage of the existing IEEE 802.11 infrastructure, which currently has a coverage exceeded only by the one provided by cellular networks.
III. WIRELESSSENSORS INCYBER-PHYSICALSYSTEMS
The advances in embedded systems and information communication technologies had led to the development of sensors, which are continuously getting more powerful, smaller, and cheaper. These offer a range of advances over traditional wired sensor applications, the most important con-sisting in the cost reduction and simplification of deployment through the elimination of wires. All the aforementioned facts encourage the adoption of wireless sensor networks at a scale never encountered before and it is expected that in the future, this trend will not only continue but also become even more accentuated. Furthermore, the development of CPSs brought new demands and opportunities for the use of WSNs, the combination of advanced sensing, measurement and process control having applicability across a wide range of domains, such as transportation, energy, civil infrastructure, environmen-tal monitoring, defense, smart buildings, manufacturing and production, and others.
given start from the fact that these systems represent the intersection between computations and physical processes, and not their union [23]. A complex definition of CPSs was given by S. Shankar Sastry who states that a CPS integrates comput-ing, communication, and storage capabilities with monitoring and/or control of entities in the physical world, and must do so dependably, safety, securely, efficiently, and in real time. In addition, CPSs can be defined as follows: CPSs refer to Information and Communications Technology (ICT) systems (sensing, actuating, computing, communication, and others) embedded in physical objects, interconnected including through Internet, and providing citizens and businesses with a wide range of innovative applications and services [24]. All of the definitions in the literature emphasize a strong relationship between computational (cybernetic) and physical resources in order to exceed the nowadays ICT systems in terms of autonomy, efficiency, functionality, adaptability, dependability, and usability. According to these statements, the system presented in this paper represents a CPS that employs wireless sensors for gathering and presenting data about the environment.
The connection between the components in large-scale systems leads to the IoT, a concept similar to CPSs, which represents a new step in the evolution of the Internet [25]. The IoT is defined as a vision that allows people and things to be connected anytime, anyplace, with anything and anyone, ideally using any path/network and any service [26]. This represents a major domain that relies on sensor networks, their presence being essential here, where they can collect surround-ing context and environment information. In this case, the data generated by sensors are sent to sink nodes and, finally, reaches the cloud, where they will be stored, shared, and processed accordingly to its relevance. Besides the advantages brought by this novel use of wireless sensors connected directly to the Internet, a set of challenges that have to be addressed, such as security and privacy, the management of huge amounts of data, quality of service, network configuration, and others, emerge.
IV. SYSTEMARCHITECTURE A. General Overview
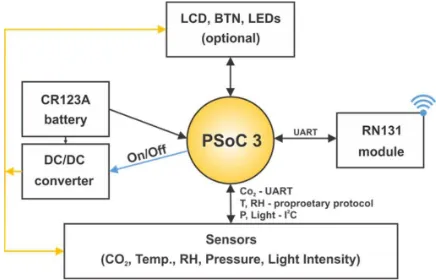
A graphical representation of the entire CPS used for monitoring the environment in indoor or outdoor spaces, where IEEE 802.11 b/g network coverage exists, is presented in Fig. 1.
The two main system components consist of the following. 1) Wi-Fi Sensors: Low-power wireless sensors based on the programmable system-on-chip 3 (PSoC 3) device [27] and on the RN-131C/G wireless local area network (WLAN) module [28].
2) IoT Platform: A BeagleBone Black embedded computer [29] running the server application.
The detailed description of the hardware and software of the two system components will be given in the remainder of the section.
B. Wi-Fi Sensors
1) Node Architecture: The Wi-Fi sensors are represented by low-power multifunctional devices, having the three basic
Fig. 1. CPS for environmental monitoring.
Fig. 2. Wi-Fi sensor hardware architecture—the first model [20].
Fig. 3. Wi-Fi sensor hardware architecture—the second model [21].
capabilities encountered in wireless sensor nodes, which consist in sensing, data processing, and communication. Several models of the Wi-Fi sensors were developed, employ-ing the RN-131C/G WLAN module, usemploy-ing two main archi-tectures: one in which the Wi-Fi module is used at its full potential (Fig. 2), being the central part of the node, and the other one in which an external processor is used for controlling the RN-131C/G component through serial commands sent over Universal Asynchronous Receiver/Transmitter (UART) (Fig. 3) [20], [21].
node measure the temperature (analog—PT1000 and digital— DS18B20 [30]) or temperature and relative humidity (DHT22 [31]). While the PT1000 sensor is read through an analog input, the protocols implemented by the WLAN module for communicating with the digital sensors are 1-Wire for the DS18B20 sensor and a proprietary protocol for the DHT22 sensor. The measurement application running on the node starts at predefined time intervals, performs the measurements, sends the recordings, and goes back to sleep for minimizing the power consumption. Depending on the sensor attached to the device, different ranges for the temperatures are available. The use of the WLAN module as the central processing component of the node reduced the communication latency and costs for the node, but the need of adding other sensors communicating on different protocols lead to the development of a second architecture, which is presented in Fig. 3.
This second architecture is based on a
CY8C3246PVI-147 [32] programmable system on-chip microcontroller produced by Cypress Semiconductor, the part that initiates all the actions performed by the wireless node. The devices in this category can measure CO2
(carbon dioxide) levels, temperatures, and the relative humidity in the air, the absolute pressure, and the light intensity using the following digital sensors: a Cozir ambient sensor [33], a DHT22, an MPL115A2 barometer [34] and a TSL2561 [35], respectively. These sensors can appear in any combination attached to a Wi-Fi device, with or without an LCD for the local visualization of the measured values. The communication with each one of the components is performed through using different protocols: serial data transmission for the carbon dioxide sensor and for the Wi-Fi module, a proprietary protocol for the DHT22 sensor, and I2C with the barometric pressure and light sensors. Being a wireless sensing node, with constraints regarding its power supply, the device stays most of the time in sleep mode and wakes up only when measurements and result transmissions have to be performed. This is one of the most efficient strategies for minimizing energy consumption in these kinds of systems [18]. Furthermore, because the power consumption of all the attached transducers in sleep mode does not allow long battery lifetimes, a separate power supply was developed and included in this second design. It uses a chip that provides high efficiency while using small amounts of power, consuming less than 1 µA in shutdown mode. These, coupled with the use of a high-capacity (1500 mAh) battery, only slightly influenced by temperature variations and loads, lead to periods of continuous operation of up to three years without its replacement.
2) Models: Finally, more than ten types of sensors are present in the proposed CPS. Table I presents 12 different device configurations for a sensor node, noting that when more than one sensor is present, they operate in the same time.
3) Configuration and Operation:All the developed sensors, built using either one of the two architectures, have the same lithium CR123A 3 V battery as the power supply and transmit data through the same protocol, the only difference consisting in the configuration mode, which uses different menus. However, the procedure is similar and it is performed
TABLE I Wi-Fi SENSORS IN THECPS
through the serial interface using an RS232 cable and a telnet client. The menus allow the specification and the display of the parameters required for the proper operation of the wireless sensors, namely, the period between measurements, which can be set to have a value between several seconds and 60 min; the information for connecting to WLANs, namely, the channel used, the Service Set Identifier, and passwords; the data server information, which includes the server port and the IP; the node IP; the gateway and the subnet mask, which are important in the case in which data is sent outside the local area network (LAN) to which the sensor is connected; and the CO2sensor’s configuration, if this is present in the design.
The presence of the carbon dioxide sensor significantly affects the design of the device’s hardware and software components, requiring the use of a separate power supply, a dc/dc converter, in the case of the model based on the PSoC 3 device. The carbon dioxide nondispersive infrared sensor requires special routines for calibration also and additional recordings in the menu are added for setting the parameters of different types of supported calibration routines: autocalibration, calibration using a gas containing no CO2, calibration using a known gas
concentration, and calibration using fresh air. The calibration routine for nondispersive infrared carbon dioxide sensors has to compensate for the sensor drift that appears after long operation times. It implies the addition of an offset value to all readings. This is computed as the difference between the read-ings when a sensor is exposed to a known gas concentration and the original calibration value and is performed through sensor specific commands issued by the core microcontroller. These types of sensors also require a warm-up period, which significantly affects the power consumption of the device. This is proportional to the digital filter that can be set to a value between 2 and 32 instant measurements for attenuating the noise in the carbon dioxide level readings. Besides the CO2 sensor and the PT1000 probe, no other sensor requires
action they perform and on the period between measurements set by the user [36]. This leads to the low-power operation of the device and to the possibility of using the same 3 V battery for several years. After each measurement, the Wi-Fi module is woken up, and specially formatted messages are sent to the previously set IP address. In the design including the microcontroller core and the WLAN module on the same printed circuit board, communication between the two is performed through the UART using an advanced application programming interface software, called WiFly [37]. Here, the RN-131C/G module automatically connects to a specific access point and acts as a pipe, sending serial information over UDP, after being powered.
4) Data Transmission: For minimizing the power consump-tion, a unidirectional data transmission scheme was used, and the sensors waking up periodically, powering up the attached sensors, taking the measurements, and sending the data using the Wi-Fi module and the UDP protocol. The choice of the protocol was motivated by the lower packet size, increased speed, and low latency compared with that of TCP/IP and by the fact that it offers connectionless communication. These contribute to the reduction of the power consumption with disadvantages regarding the security and reliability of the transmission. The reliability could be very easily improved by sending more than one measurement each cycle, so that packet losses are compensated for, and the addition of a cyclic redundancy check for signaling data alterations. A simple at hand solution in the case of the security would be the addition of a simple cryptographic scheme for the data trans-mission [38]. However, environmental monitoring does not require high sampling rates and tight deadlines and does not manage sensitive information. This is the reason why these aspects were not approached until now, only standard WPA2 (Wi-Fi Protected Access II) encryption or the security protocol in the wireless computer network to which the sensor node is connected is used.
All the sensors send data packets having the same structure. They consist of opcodes preceded by a hexadecimal number specifying the device model, which is read and processed by the server for the proper interpretation of the message. The opcodes consist of fixed-size numerical codes representing pairs of hexadecimal numbers associated with a specific func-tion, with the first element being the function code and the second its associated value. Table II presents some examples of opcodes sent by the Wi-Fi sensors. The message structure depends on the device model and on the type and number of sensors attached to the device.
5) Node Power Consumption: The device consuming the largest amount of power was tested for determining the life-time of a 3 V battery powering up the system. For granting proper operation, a minimum operating voltage of 2.4 V is specified, although the system operates event at smaller voltages (minimum 1.8 V). During one cycle, the values of the carbon dioxide concentration in the air, the temperature, the relative humidity, the absolute pressure, and light intensity are measured and sent to the server. The wakeup period in this case is determined by the warm-up period of the CO2 sensor
and it is larger than in the case of all the other devices that
TABLE II
MESSAGECOMPONENTS
Fig. 4. Battery discharge curve for the 10-s measurement cycle.
do not include it. Therefore, it is expected that all the other models will operate for longer periods of time with the same measurement cycle.
The battery discharge curve (Fig. 4) was generated for a sensor with the aforementioned characteristics, each message containing also the voltage of the power source. For this experiment, the node including all the sensors (CO2, T, RH, P,
TABLE III BATTERYLIFETIME
performed action: measurement, association with the AP, and data transmission [21]. The power consumption during sleep is less than 30 µW. By knowing these values, the leakage currents, and by modifying the sleep/wake-up ratio, the data in Table III are resulted.
C. IoT Platform
The IoT platform is, in fact, a BeagleBone Black single-board computer based on the ARM Cortex-A8 processor running at 1 GHz [29]. This choice was motivated by the advantages provided by this device when the development of a reliable stand-alone low-cost platform is targeted. Moreover, the use of the BeagleBone Black as part of the proposed solu-tion leads to low power consumpsolu-tion and to a reduced TCO. A server application runs on the IoT platform. This listens to the UDP port, interprets the messages received from the sensors, and saves the data in a database in the device’s internal memory or on a microSD card. A Web server is installed on the platform for providing access to the data requested by authenticated users for further analysis.
1) UDP Port Listener and Message Interpreter: This com-ponent is in charge of listening the UDP port to which the sensors transmit the packets containing the measurement data. The data received are stored into a buffer and processed for being saved in a database. A benchmark program was written to compute the average processing time for each received message. This includes message interpretation and data saving into the database. An average period of 1.5 ms was observed for each data packet that was received and saved on the local memory. When the microSD card is used for storing the information, the time increases to about 120 ms for each recording. This is important because the application stores the received packets in a queue and processes them one by one. Therefore, every message should be handled as fast as possible and this raises problems when a large number of sensors send data in the same time, as Section V shows.
2) Database: The SQLite software library was chosen for storing the data received from the Wi-Fi sensors in a data-base [39]. The motivation for choosing this solution consists in the changes and queries that are atomic, consistent, isolated, and durable, not being affected by crashes, whatever their cause. SQLite is suitable for embedded applications and for implementing a website database, the case of the proposed solution.
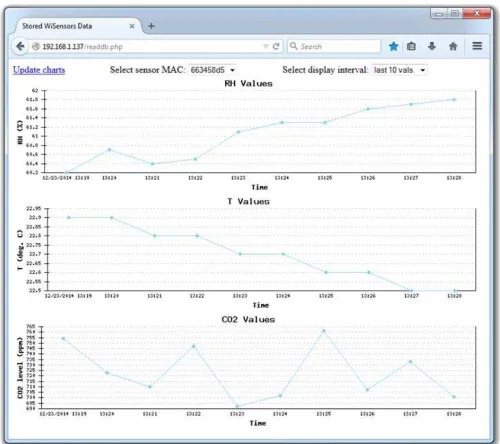
3) Web Server: An open source licensed small memory footprint Web server, namely, lighttpd, was installed on the IoT platform for remote data visualization (Fig. 5) [40].
Fig. 5. Monitoring application.
Fig. 6. Web client application showing temperature and relative humidity values.
Fig. 7. Web client application showing charts for the temperature, relative humidity, and CO2level.
Fig. 8. Packages lost when receiving data from one source at a time window of 40 ms.
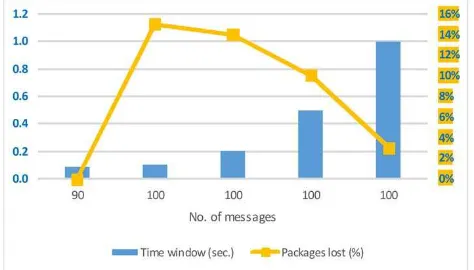
Fig. 9. Packages lost when receiving data from one source having 100 packages.
V. EXPERIMENTALRESULTS
A number of experiments were performed for providing data related to the reliability and performance of the proposed system. The first two sets of experiments consisted in the testing of the server’s capabilities of processing large numbers of messages received from sensors in a short period of time (named from here on also as time window). First, a desktop PC was used for sending UDP messages formatted as the ones sent by the two types of sensors to the server platform, and then four notebook PCs using wireless communication were used to send the same messages through UDP. The first experiments aimed to determine the maximum number of packages that can be processed in a short period of time for a single IoT platform. This required the development of a C application sending UDP messages similar to the ones generated by the two types of sensors, which ran on a desktop computer in the same LAN as the server. The fact that no wireless connectivity was used here does not affect the test’s validity because the object of interest is represented by the server’s capability of processing the received messages without losing any package. Therefore, the best connection for sending the messages, where the risk of package collision is considered to be the lowest, was used. The database was then queried for finding out the ratio of package losses (Figs. 8 and 9). The tests revealed that the IoT platform can process 80 messages sent from a single source in 0.025 s without losing any package. If the number of packages increases and the time window remains to a value smaller than 40 ms, the package loss percentage increases.
Fig. 10. Packages lost when receiving data from four sources at a time window of less than 20 ms.
Fig. 11. Packages lost when receiving data from four sources at a time window of more than 120 ms.
After this, a number of 100 packages were sent (Fig. 9) and the time window length was increased. Fig. 9 shows that the losses are reduced in this way and more data can be saved. The point in which 90 messages are transmitted in 90 ms, when there are no package losses, is also represented on the plot. When 100 messages are transmitted in roughly the same period, 15 are not saved in the local memory. This is caused by the buffer of the UDP socket on the server platform, which is filled as the messages arrive at the port, and it is emptied as fast as the application can process them. If the buffer is full and new packages are received, they are discarded. However, the application running on the IoT platform manages the messages in a sequential manner, and the performances can be improved by paralleling the tasks here.
Fig. 12. Package loss for two sensor nodes.
of sent packages increases, the losses also increase, because of the inability of the server application to process messages and to prevent the filling of the the UDP buffer. Of course, having multiple messages sent in the same time, collisions can also occur.
These experiments show that the developed server can process a number of approximately 40 packages received in a time frame of 1 ms. If this number is not exceeded, the packages that never reach the server platform and that are dropped are caused by collisions within the network.
Another set of experiments used actual nodes for evaluating the operation of the system in a scenario as close as possible to a real one. Fig. 12 shows the package loss ratio of two sensor nodes connected to the same access point. The architecture of one of the sensors is the one described first in this paper, while the second sensor’s architecture is the one based on the PSoC device. The IoT platform is also in the same network. For the first set of data, the devices were set to measure the environmental parameters using a period of 30 s for the first model, the one based on the RN-131 WLAN module and a period of 60 s for the device having the PSoC microcontroller as core. During this test, the devices sent approximately 6000 and 3000 measurements, respectively. The second set of data was obtained by setting the measurement rate to 10 min, each device sending approximately 400 messages. The percentage of single packages and bursts of packages that were lost are presented here. However, this loss of reliability in the case of slow dynamic processes such as temperature can be tolerated in the vast majority of environmental and ambient monitoring applications. The package losses in this experiment are not caused by the concurrent arrival of large numbers of sensor messages but by the communication within the network. The results in the first column of the figure can also be caused by the software running on the RN-131 module. Being an event driven application running on an eCos operating system, it is possible that the acquisition of data from the sensors or their transmission is prevented from happening in some cases at the node level. This leads to the need of further testing the nodes based on the stand-alone WLAN module. These tests show that if the message structure is modified so that six consecutive measurements are sent at a time, there are no losses at the server part. It is true that this requires more processing and
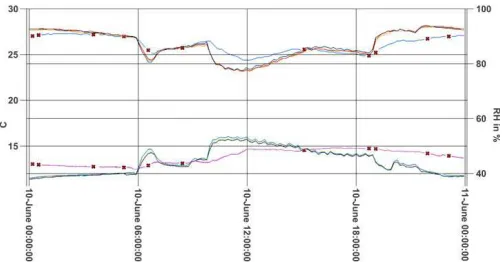
Fig. 13. Temperature and relative humidity chart, for a 1-day interval.
storing resources at the node location and an increase in the complexity of the server application.
Fig. 13 presents the data sent by a 4xT+RH wireless sensor during one day, highlighting the package losses.
VI. CONCLUSION
The development of a CPS, which monitors environmental parameters based on the existent IEEE 802.11 infrastructure, was presented. It employs sensors measuring the ambient or the environment, which send messages to an IoT platform using UDP. The communication protocol and the design of the nodes help in achieving low power consumption, offering battery lifetimes of several years. The system eliminates bulky solutions, provides the possibility of logging data where Wi-Fi network coverage exists, and can be used in a wide range of monitoring applications. Future work intends to enhance the reliability and security of the proposed system.
REFERENCES
[1] D. F. Larios, J. Barbancho, G. Rodríguez, J. L. Sevillano, F. J. Molina, and C. León, “Energy efficient wireless sensor network communications based on computational intelligent data fusion for environmental moni-toring,”IET Commun., vol. 6, no. 14, pp. 2189–2197, Sep. 2012. [2] J.-Y. Kim, C.-H. Chu, and S.-M. Shin, “ISSAQ: An integrated sensing
systems for real-time indoor air quality monitoring,”IEEE Sensors J., vol. 14, no. 12, pp. 4230–4244, Dec. 2014.
[3] L. Zhang and F. Tian, “Performance study of multilayer perceptrons in a low-cost electronic nose,”IEEE Trans. Instrum. Meas., vol. 63, no. 7, pp. 1670–1679, Jul. 2014.
[4] S. Sharma, V. N. Mishra, R. Dwivedi, and R. R. Das, “Quantification of individual gases/odors using dynamic responses of gas sensor array with ASM feature technique,”IEEE Sensors J., vol. 14, no. 4, pp. 1006–1011, Apr. 2014.
[5] J. Wan, M. Chen, F. Xia, D. Li, and K. Zhou, “From machine-to-machine communications towards cyber-physical systems,”Comput. Sci. Inf. Syst., vol. 10, no. 3, pp. 1105–1128, 2013.
[6] M. Broy, M. V. Cengarle, and E. Geisberger, “Cyber-physical systems: Imminent challenges,” in Large-Scale Complex IT Systems. Develop-ment, Operation and Management(Lecture Notes in Computer Science), vol. 7539, R. Calinescu and D. Garlan, Eds. Heidelberg, Germany: Springer, 2012, pp. 1–28.
[7] F.-J. Wu, Y.-F. Kao, and Y.-C. Tseng, “From wireless sensor networks towards cyber physical systems,” Pervasive Mobile Comput., vol. 7, no. 4, pp. 397–413, 2011.
[8] S. Gao et al., “A cross-domain recommendation model for cyber-physical systems,”IEEE Trans. Emerg. Topics Comput., vol. 1, no. 2, pp. 384–393, Dec. 2013.
[9] A. Zaslavsky. (Sep. 2013). Internet of Things and Ubiquitous Sensing. [Online]. Available: http://www.computer.org/portal/web/ computingnow/archive/september2013, accessed Sep. 2014.
[10] Z. Guo, P. Chen, H. Zhang, M. Jiang, and C. Li, “IMA: An integrated monitoring architecture with sensor networks,” IEEE Trans. Instrum. Meas., vol. 61, no. 5, pp. 1287–1295, May 2012.
[11] S. Tozlu, M. Senel, W. Mao, and A. Keshavarzian, “Wi-Fi enabled sensors for Internet of Things: A practical approach,”IEEE Commun. Mag., vol. 50, no. 6, pp. 134–143, Jun. 2012.
[12] A. Berger, M. Pichler, J. Klinglmayr, A. Potsch, and A. Springer, “Low-complex synchronization algorithms for embedded wireless sensor networks,”IEEE Trans. Instrum. Meas., vol. 64, no. 4, pp. 1032–1042, Apr. 2015.
[13] J. Gutierrez, J. F. Villa-Medina, A. Nieto-Garibay, and M. Porta-Gandara, “Automated irrigation system using a wireless sensor network and GPRS module,” IEEE Trans. Instrum. Meas., vol. 63, no. 1, pp. 166–176, Jan. 2014.
[14] B. Ando, S. Baglio, A. Pistorio, G. M. Tina, and C. Ventura, “Sentinella: Smart monitoring of photovoltaic systems at panel level,”IEEE Trans. Instrum. Meas., vol. 64, no. 8, pp. 2188–2199, Aug. 2015.
[15] G. Tuna, V. C. Gungor, and K. Gulez, “Wireless sensor networks for smart grid applications: A case study on link reliability and node lifetime evaluations in power distribution systems,”Int. J. Distrib. Sensor Netw., vol. 2013, Jan. 2013, Art. ID 796248.
[16] J. P. Amaro, R. Cortesao, J. Landeck, and F. J. T. E. Ferreira, “Harvested power wireless sensor network solution for disaggregated current esti-mation in large buildings,”IEEE Trans. Instrum. Meas., vol. 64, no. 7, pp. 1847–1857, Jul. 2015.
[17] H.-C. Lee, Y.-C. Chang, and Y.-S. Huang, “A reliable wireless sensor system for monitoring mechanical wear-out of parts,” IEEE Trans. Instrum. Meas., vol. 63, no. 10, pp. 2488–2497, Oct. 2014.
[18] L. Hou and N. W. Bergmann, “Novel industrial wireless sensor networks for machine condition monitoring and fault diagnosis,” IEEE Trans. Instrum. Meas., vol. 61, no. 10, pp. 2787–2798, Oct. 2012.
[19] K.-H. Chang, “Bluetooth: A viable solution for IoT? [Industry Perspec-tives],”IEEE Wireless Commun., vol. 21, no. 6, pp. 6–7, Dec. 2014. [20] M. Hulea, G. Mois, S. Folea, L. Miclea, and V. Biscu, “Wi-sensors:
A low power Wi-Fi solution for temperature and humidity measure-ment,” inProc. 39th Annu. Conf. IEEE Ind. Electron. Soc. (IECON), Nov. 2013, pp. 4011–4015.
[21] S. C. Folea and G. Mois, “A low-power wireless sensor for online ambient monitoring,” IEEE Sensors J., vol. 15, no. 2, pp. 742–749, Feb. 2015.
[22] J. Jin, J. Gubbi, S. Marusic, and M. Palaniswami, “An information framework for creating a smart city through Internet of Things,”IEEE Internet Things J., vol. 1, no. 2, pp. 112–121, Apr. 2014.
[23] E. A. Lee and S. A. Seshia,Introduction to Embedded Systems: A Cyber-Physical Systems Approach. Berkeley, CA, USA: Univ. of California, Berkeley, 2011.
[24] Communications Networks, Content & Technology Directorate-General, Unit A3-DG CONNECT, “Cyber-physical systems: Uplifting Europe’s innovation capacity,” Report from the Workshop on Cyber-Physical Sys-tems: Uplifting Europe’s Innovation Capacity, European Commission, Brussels, Belgium, Dec. 2013.
[25] C. Perera, A. Zaslavsky, P. Christen, and D. Georgakopoulos, “Context aware computing for the Internet of Things: A survey,”IEEE Commun. Surveys Tuts., vol. 16, no. 1, pp. 414–454, Feb. 2014.
[26] P. Guillemin and P. Friess, “Internet of Things strategic research roadmap,” European Research Cluster on the Internet of Things (IERPC), Belgium, Tech. Rep., Sep. 2009.
[27] PSoC 3 Architecture TRM (Technical Reference Manual), document 001-50235, Cypress Semiconductor, Jan. 2014.
[28] RN-131G & RN-131C 802.11 b/g Wireless LAN Module, Version 3.2r4/9/2012, Microchip Technol. Inc., Chandler, AZ, USA, 2012.
[29] G. Coley, BeagleBone Black System Reference Manual, Dallas, TX, USA, Texas Instruments, Apr. 2013.
[30] DS18B20 Programmable Resolution 1-Wire Digital Thermometer, Maxim Integr., San Jose, CA, USA, 2008.
[31] Digital-Output Relative Humidity & Temperature Sensor/Module DHT22 (DHT22 Also Named as AM2302), Aosong Electron. Co., Ltd., Guangzhou, China, 2014.
[32] PSoC 3: CY8C32 Family Data Sheet, document 001-56955, Cypress Semiconductor, Mar. 2015.
[33] COZIR Ultra Low Power Carbon Dioxide Sensor, GSS Ltd, Glasgow, U.K., Oct. 2014.
[34] Miniature I2C Digital Barometer, Freescale Semicond., Austin, TX, USA, Feb. 2013.
[35] AMS. (Nov. 2009). TSL2560, TSL2561 Light-to-Digital Converter. [Online]. Available: http://www.taosinc.com
[36] R. Yan, H. Sun, and Y. Qian, “Energy-aware sensor node design with its application in wireless sensor networks,”IEEE Trans. Instrum. Meas., vol. 62, no. 5, pp. 1183–1191, May 2013.
[37] WiFly Command Reference, Advanced Features and Applications User’s Guide, Microchip Technol. Inc., Chandler, AZ, USA, Jan. 2014. [38] L. Vegh and L. Miclea, “Enhancing security in cyber-physical systems
through cryptographic and steganographic techniques,” inProc. IEEE Int. Conf. Autom., Quality Test., Robot., May 2014, pp. 1–6.
[39] SQLite. [Online]. Available: http://www.sqlite.org, accessed Dec. 19, 2014.
[40] Lighttpd. [Online]. Available: http://www.lighttpd.net/, accessed Dec. 19, 2014.
Available online:https://edupediapublications.org/journals/index.php/IJR/ Page|2
Suresh Kumar Kondoju [M.E,(Ph.D)], Assocoate Professor,Dept of Electronics and Communication Engineering.
Email: [email protected] Sri Sai Jyothi Engineering College is an engineering college affiliated with Jawaharlal Nehru Technological University, Hyderabad. It is located in Hyderabad in the district of Ranga Reddy, Telangana, India.
Venkata Sai Teja Reddy Pondugula RollNumber : 13601A0445
Email: [email protected] Sri Sai Jyothi Engineering College is an engineering college affiliated with Jawaharlal Nehru Technological University, Hyderabad. It is located in Hyderabad in the district of Ranga Reddy, Telangana, India.
Madhuri Karamthote Chiniya RollNumber : 13601A0435 Email: [email protected] Sri Sai Jyothi Engineering College is an engineering college affiliated with Jawaharlal Nehru Technological University, Hyderabad. It is located in Hyderabad in the district of Ranga Reddy, Telangana, India.
Vinay Kumar Myadam RollNumber : 13601A0440