EFFECTS OF INFRASTRUCTURE ON FOREIGN DIRECT INVESTMENT IN KENYA
CAROL TERESA WEKESA
A RESEARCH PEOJECT SUBMITTED TO THE SCHOOL OF ECONOMICS IN PARTIAL FULFILLMENT OF THE REQUIREMENTS
FOR THE AWARD OF THE DEGREE OF MASTER OF ECONOMICS (INTERNATIONAL TRADE AND FINANCE) OF KENYATTA
UNIVERSITY
DECLARATION
This project is my original work and has not been presented for a degree award in any other university.
Signature ~--- Date _----'-,
--Lq--LI---,~'----L-!_~_O_(£
__
CAROL TERESA WEKESA (B.A KENY ATTA UNIVERSITY)REG: KI02/CTY/PT/2133812012
We confirm that the work reported in this project was carried out by the candidate under our supervision.
Signature ;,j/I!fv<::..:....- Date
PROF. NELSON H.W. WAWIRE (Ph.D.) ASSOCIATE PROFESSOR OF ECONOMICS
DEPARTMENT OF APPLIED ECONOMICS SCHOOL OF ECONOMICS
KENY ATT A UNIVERSITY
Jl!JYC
0!
Signature ~~ Date
DR. GEORGE KOSIMBEI (Ph.D.) SENIOR LECTURER
DEPARTMENT OF ECONOMIC THEORY
DEDICATION
This research project is dedicated to my entire family who have been my source of
ACKNOWLEDGEMENT
I would like to express my deep gratitude to my supervisors Professor Nelson
Wawire and Dr. George Kosimbei, for their valuable and constructive suggestions
during the development of this research project. I would also like to extend my
appreciation to my classmates for their encouragement and support throughout my
study. To all those that played a part, but could not be mentioned by name, their
TABLE OF CONTENTS
DECLARATION i
DEDICATION ii .
ACKNOWLEDGEMENT iii
TABLE OF CONTENTS iv
LIST OF TABLES viii
LIST OF FIGURES ix
ABBREVIATIONS AND ACRONYMS
x
OPERATIONAL DEFINITION OF TERMS xi
ABSTRACT xiv
CHAPTER ONE INTRODUCTION 1
1.1 Background : 1
1.1.1 Infrastructure for Economic Development 2
1.1.2 Role oflnfrastructure inAttracting Foreign Direct Investment.. 2
1.1.3 Foreign Direct Investment for Economic Development .4
1.2 Statement of the Problem 7
1.3 Research Questions 9
1.4 Objectives ofthe Study 9
1.5 Significance ofthe Study 10
1.6 Scope ofthe Study 10
1.7 Organization of the study 11
2.1 Introduction 13
2.2 Theoretical Literature 13
2.3 Empirical Literature 16
2.4 Overview of Literature 22
CHAPTER THREE METHODOLOGy 25
3.1 Introduction 25
3.2 Research Design 25
3.3 Conceptual Framework 25
3.4 Theoretical Model 27
3.5 Empirical Model 28
3.6 Definition and Measurement of Variables 29
3.7 Data Type and Sources .: 30
3.8 Data Cleaning and Refinement 30
3.9 Correlation Analysis 31
3.10 Stationarity Analysis 31
3.11 Cointegration Analysis 32
3.12 Data Analysis 32
CHAPTER FOUR EMPIRICAL RESULTS AND DISCUSSION 33
4.1 Introduction 33
4.2 Time Series Properties 33
4.2.1 Lag Length Determination 33
4.2.3 Cointegration Test 35
4.3 Correlation Analysis Results 35
4.4 Diagnostic Test Results : 36
4.5 Regression Results 38
4.5.1 Effects of Transport Infrastructure Development on FDI Inflows 39
4.5.2 Effects of Energy Infrastructure Development on FDI Inflows .40 4.5.3 Effects of Communication Infrastructure Development on FDI Inflows
41
4.5.4 Effects of Water and Waste Infrastructure Development on FDI
Inflows 42
4.5.5 Effects of Exchange Rate, Economic Growth, Trade Openness, Wage
and Security on FDI Inflows 43
CHAPTER FIVE SUMMARY, CONCLUSION AND POLICY
IMPLICATIONS 45
5.1 Introduction 45
5.2 Summary 45
5.3 Conclusions 47
5.4 Policy Implications 47
5.5 Areas for Further Research 50
REFERENCES 51
APPENDICES 55
LIST
OF TABLES
Table 3.1:Variable Definition and Measurement 29
Table 4.1: Stationarity Test Results 34
Table 4.2: Summary of Diagnostic Tests 36
Table 4.3: Regression Results 38
Table AI: Raw Data 55
Table A2: Johansen Test for Cointegration Results 58
Table A3: Long Term Regression Results 58
Table A4: Model Specification 58
Table A5: Correlation Analysis 59
Table A6: Lag Length Selection 59
Table A7: Regression Results 59
Table A8: Jarque-Bera Normality Test. 60
LIST
OF FIGURES
Figure 1.1:Foreign Direct Investment in Kenya (Current US$ inMillions) 6
Figure 3.1: Conceptual Framework 26
Figure AI: Residual Density Plot (Before Transformation) 61
Figure A2: Residual Density Plot (After Transformation) 61
Figure A3: Model Stability 62
Figure A4: CUSUM Test 63
ADF BOOT BOT ERS FDI GDP ICT IMF kWh
LAPSSET
MTEF
MTP
MW
PCA
PEV
PPP
SAP
SBIC
UNCTAD
ABBREVIATIONS
AND ACRONYMS
Augmented Dickey Fuller
Build Own Operate and-Transfer
Build Operate and Transfer
Economic Recovery Strategy
Foreign Direct Investment
Gross Domestic Product
Information Communication Technology
International Monetary Fund
Kilowatt Hour
Lamu Port South Sudan Ethiopia Transport Corridor
Medium Term Expenditure Framework
Medium Term Plan
Mega Watt
Principal Component Analysis
Post-Election Violence
Public Private Partnership
Structural Adjustment Program
Schwartz- Bayesian Information Criterion
OP
E
RATIONAL DEFINITION O
F TE
R
MS
Communication Infrastructure: These are the various broadcasting and
telecommunication facilities that are necessary for communication and
transaction services.
Economic Development: This IS economic growth accompanied by
transformations in the livelihoods of citizens. When there is an
improved standard of living, then economic development is said to have
taken place.
Economic Growth: This is an increase in the capacity of a country's economy to
generate goods and services. This increase can be compared from one
period of time to another. :
Energy Infrastructure: These are enablers in the production and consumption of
energy resources. In this study, electric power consumption (per kWh), per
capita consumption of kilogrammes of oil equivalent, energy generation
(MW) as a percentage of demand,
renewable
energy generation
(MW)as a
percentage of total generation and percentage connection to the national
grid are used to represent energy infrastructure.
Foreign Direct Investments: These are net inflows of investment into Kenya,
measured in Kshs. It is a summation of equity capital, earnings reinvested
and other long and short-term capital.
Infrastructure: These are physical structures (such as roads, rails, sewers,
bridges) that are needed for proper functioning of a
country/region/organization.
Infrastructure Sector: These are basic physical systems. In this study, a system
that aggregates transportation, communication, sewerage, water and
electric systems become an infrastructure system.
Macroeconomic Stability: This is a situation when a national economy has
minimal vulnerability to external shocks. This In turn Increases the
prospects for sustained growth.
Openness to Trade: This is a measure of a country's integration in the world
economy. It represents the degree of demand for domestic produce in
foreign markets and demand for foreign produced goods and services
locally.
Operating Environment: These are underlying conditions or circumstances that
Return on Investment: This is the benefit to the investor resulting from an
investment of some capital. A high rate on investment means the capital
compare favorably to returns.
Transport Infrastructure: These are physical structures (such as roads, railways,
ports and airports) enabling the passage of vehicles, goods and people.
Water and Waste Management Infrastructure: These are water and waste
systems accessed within a certain locality, as defined based on availability,
ABSTRACT
Kenya's FDI inflows as a percentage of GDP have been increasing negligibly over the last five years, increasing from 0.4 percent in 2010 to 0.9 percent in 2013. This is despite the fact that, since the year 2000, there has been increased budgetary
allocation to the infrastructure sector. Empirical evidence has shown that quality
infrastructure lowers the cost of doing business and improves the investment climate, thus attracting FDI. However, Kenya still has visible signs of infrastructure in-adequacy and inefficiencies. These include congested roads,
erratic power supply, long-waiting lists for installation of telephone/power lines,
shortages of clean and safe drinking water, and overloaded waste disposal system and pollution. This study, therefore, sought to determine the effects of transport,
energy, communication, and water and waste infrastructure development on FDI inflows in Kenya. The study used annual secondary data, spanning 1970 to 2013,
sourced from Central Bank of Kenya, World Bank and UNCTAD. Multiple regression analysis was done. It was established that, improved transport infrastructure, communication infrastructure, water and waste infrastructure,
exchange rate, economic growth and trade openness are important determinants of FDI inflows into Kenya. Hence, for Kenya to attract more FDI, the government should modernize ports and airstrips, tarmac more kilometres of roads, construct more kilometres of rail line, improve port infrastructure to increase container port traffic, increase broadband internet connectivity, expand technical training institutes, harness innovative ideas for increased export of ICT goods and services,
CHAPT
E
R ON
E
INTRODUCTION
1.1 Background
Kenya's quest for infrastructure development started in earnest soon after the country gained political independence in 1963. This fact is properly captured in Sessional Paper Number 10 of 1965 in which the country wished to develop
transport, energy and other basic infrastructure aimed at drawing the country into the market economy while laying the basis for a rapid acceleration of industrial
growth. Other development plans followed suit with the Economic Recovery Strategy for Wealth and Employment Creation (Republic of Kenya, 2003) bringing to fore infrastructure as an important prerequisite in creating and supporting a business environment capable of facilitating investment, growth and job creation.
Remarkably, Kenya's long term development blue print, the Kenya Vision 2030 (Republic of Kenya, 2007), has recognized the importance of infrastructure for sustained economic development. The vision is alive to the fact that high costs of
doing business arising from inadequate and inefficient infrastructure can prevent the economy from realizing its full potential regardless of the progress on other
1.1.1 Infrastructure for Economic Development
The importance of infrastructure for economic development cannot be gainsaid, as
the superstructure of Kenya's overall wealth hinges on it. Infrastructure development represents a broad spectrum of activities and services without which
no meaningful activity can be undertaken in the economy. As presented in the
second Medium Term Plan, 2013-2017 (Republic of Kenya, 2013), infrastructure
plays a key role in the economy and constitutes the wheels, if not the engine of
development. Reliable, adequate and quality infrastructure will increase economic productivity, lower production costs, improve quality of life, raise the country's
regional and global competitiveness, attract Foreign Direct Investment (FDI) and
help in modernizing the economy.
Like in other developing countries, Kenya has visible signs of infrastructure
in-adequacy and inefficiencies. These include congested roads, erratic power supply,
long waiting lists for installation of telephone/power lines, shortages of clean and
safe drinking water, and overloaded disposal system and pollution. This illustrates
the widening gap between demand for and supply of infrastructure and raises
questions concerning the sustainability of economic growth.
1.1.2 Role of Infrastructure in Attracting Foreign Direct Investment
The availability of high interconnectivity and access roads, telecommunications,
railways, airports, for example, is a key asset for attracting most modern
infrastructure consists of communications, roadways, transportation, highways and
ports. A study focusing on the impact of infrastructure on FDI concluded that there
was a positive significant contribution of infrastructure in captivating FDI.
Transportation costs, tariffs and access to a new market enhances competitive
position of a country (Rehman et al., 2011). Infrastructure availability reduces
transportation costs, tariffs and improves access to new markets while reducing
operational costs in a specific country.
•
Zheng (2009) categorized infrastructure development as part of public goods.
Zheng argued that public goods have a vital impact on cost structure and
productivity of private firms, and assumed that if such kind of infrastructure were
not extended to local and multinational enterprises publicly, then they (local and
multinational enterprises) would be operating with less efficiency as they would
have to build their own infrastructure which would result in duplication and
wastage of resources. As put by Rehman et al. (2011) and Zheng (2009),
availability of public goods lower the cost of private firms even if there is no direct
role of infrastructure in the production performance and cost structure of private
firms. Both opine that poor infrastructure limits access to both local and global
markets which ultimately discourages FDI in developing countries. In summary
they argued that infrastructure development promotes FDI and greater return on
Evidence from the Chinese economic revolution has also shown that transportation
factors, such as the average commute time-from main airports, ports and industrial
parks, figure prominently in the country's capacity to attract and retain foreign
companies, entrepreneurs and talent (UNCTAD, 2005). Access to clean and
adequate water, energy and necessary legal framework play a primary role In
impacting expansion decisions by these foreign firms/entrepreneurs.
••
1.1.3 Foreign Direct Investment for Economic Development
Attraction of companies/industries and entrepreneurs is a sure way of attracting
Foreign Direct Investment (FDI) to a country. According to Nyaosi (2011), FDI
brings financial resources to host countries, provides new technologies and
enhances the efficiency of existing technologies. To Nyaosi further, it facilitates
access into export markets, thereby playing an important role in strengthening the
export capabilities of domestic economies. In support, Mwega (2009) opines that
FDI enhances skills and management techniques and may provide cleaner
technologies and modern environment management systems. Importantly, FDI
helps to develop a host country's infrastructure. A case in point is the auctioning
of two mobile phone operators in Kenya in 1999 and 2000 which resulted in the
rapid build-up of telecommunication infrastructure (UNCTAD, 2005).
The Sessional Paper Number 10 of 1965 recognized attraction of FDI as a growing
sector rather than a shrinking one and laid down strategies to attract more capital
development related activities and to improve infrastructure rapidly. However, the
economic stagnation m the mid-1980s and 1990s affected Kenya's
industrialization and hence development. To Rasiah and Gachino (2003),
macro-economic constraints arising from a collapse in the IMF's Structural Adjustment
.
Program (SAPs), massive destruction of infrastructure due to El Nino rains and
weak institutions had all contributed to the economic stagnation.
After the disappointing period of the 1990s, Kenya resumed the path to rapid
economic growth in 2002 through the implementation of the Economic Recovery
Strategy for Wealth and Employment Creation (2003-2007), which has been
succeeded by the Kenya Vision 2030. During this period the government
implemented several strategies aimed at spurring growth, and included
establishment of free trade zones, improvement of terms of trade and business
climate, rehabilitation and maintenance of infrastructure facilities, and
implementation of various incentives. Central to this, was a commitment to attract
FDI, which was hoped, would assist in the industrialization process. The
•
government then, prioritized the infrastructure sector, getting the second highest
budgetary allocation through the Medium Term Expenditure Framework after the
education sector. However, the introduction of these strategies to attract and
promote FDI and export oriented industrialization, have not yielded much.
Attracting FDI has become a policy concern for the government. This is due to the
financial gap experienced in the country. The following figure shows the trend in
FDI net inflows for Kenya since the year 1970 to 2013.
'I
)00
o~
~~~
~
~
~~~~~~
~
~
~
~&
-
~L
-
~
~
~
~-
-
---
-
-
-
--19/t) lQlO lOl!>
Figure 1.1: Foreign Direct Investment in Kenya (Current US$ in Millions)
The figure shows that FDI net inflows have been low and stable from 1970 to
2006 when it shot up. It later declined drastically between 2007 and 2008 before it
started rising steadily from 2009 to 2011, a slight decline in 2011 to 2012 and
thereafter rising sharply between the years 2012 to 2013. The drastic decline may
be attributed to the global financial crisis of 2008/2009, and the high fuel and
commodity prices .
•
Empirical evidence has shown that quality infrastructure lowers the cost of doing
business and improves the investment climate, thus attracting FDI. This study,
therefore, sought to analyze empirically the effects of infrastructure development
1.2 Statement of the Problem
Kenya's FDI inflows (as a percentage of GDP) have been increasing negligibly
over the last five (5) years. In 2010, the UNCTAD had projected that the country
will attract averagely 1.3 billion USD worth of FDI annually in the next eight
years, up to 2018. However, the country only attracted 178 million USD, 335
million USD, 259 million USD and 514 million USD between 2010 and 2013,
which was way below the projections. Further, FDI growth, as a percentage of
GDP, and FDI per capita has been fluctuating over time.
On the other hand, since the year 2000, there has been increased budgetary
allocation to the physical infrastructure sector. Towards development, for example,
resource allocation increased from Kshs. 88.6 billion in 2008/09 to Kshs. 161.9
billion in 2011112 and then to Kshs. 200.3 billion in 2014115, as evidenced from,
Energy, Physical Infrastructure and ICT, Medium Term Expenditure Framework
(MTEF) Sector Reports (Republic of Kenya, 2007, 2010, 2013). However, Kenya
still has visible signs of infrastructure in-adequacy and inefficiencies. These
include congested roads, erratic power supply, long waiting lists for installation of
telephone/power lines, shortages of clean and safe drinking water, and overloaded
disposal system and pollution, among others. This, thus, begs the question, what
are the effects of infrastructure development on the meagre increase in FDI
Added to this, no empirical analysis, has been done in the Kenyan context to
establish the relationship between infrastructure development and FDI inflows in
Kenya, taking into consideration all key infrastructure indicators. For example,
Nyaosi (2011) established that infrastructure affects FDI inflows significantly and
these findings were similar to those of Mwega (2009); UNCTAD (2005); Calderon
(2009) and World Bank (2009). Most of these studies used limited number of
variables to represent the whole spectrum of infrastructure development. Key
among the omitted variables includes those on water and waste management
which are key indicators of growth and their omission would give biased results,
hence policy decisions.
Further, most of the studies on the determinants of FD I inflows have relied on data
from different regions and horizons to arrive at conclusions and make
recommendations. Due to the different operating environments, most of the
prescriptions are region-based and hence the need for country-specific solutions.
• As a support of this, a study done by Asiedu (2002) established that high return on
investment and infrastructure are significant determinants of FDI in
non-Sub-Saharan Africa countries but not significant for Sub-non-Sub-Saharan Africa. Further, the
study found out that the marginal impact of increased openness is a key factor in
determining FDI for Sub-Saharan Africa as opposed to the non-Sub-Saharan
This study, therefore, sought to analyze empirically the effects of infrastructure
development on FDI inflows to Kenya, taking cognizance of the fact that
infrastructure comprises of many sub-indicators and thus, takes into consideration
most of the variables considered in previous studies, in addition to other elected
sub-indicators, to construct infrastructure indices.
1.3 Research Questions
The study sought to answer the following questions:
1. What are the effects of transport infrastructure development on FDI
inflows in Kenya?
11. What are the effects of energy infrastructure development on FDI inflows
in Kenya?
111. What are the effects of communication infrastructure development on FDI
inflows in Kenya?
IV. What are the effects of water and waste management infrastructure
development on FDI inflows in Kenya?
1.4 Objectives of the Study
The main objective of the study was to analyze the effects of infrastructure on
Foreign Direct Investment in Kenya.
The specific objectives of the study were to;
1. Determine the effects of transport infrastructure development on FDI
11. Investigate the effects of energy infrastructure development on FDI inflows
in Kenya;
111. Determine the effects of communication infrastructure development on
FDI inflows inKenya; and
IV. Find out the effects of water and waste management infrastructure
development on FDI inflows in Kenya.
1.5 Significance of the Study
The study's importance is both societal and scientific in nature. Together with
other existing literature on determinants of FDI in Kenya, the study findings are
significant in policy and decision making, while investors will use them to inform
their investment decisions in the country. The findings give an insight on the
worthiness of continued investment in the infrastructure sector. The study is of
great importance to future scholars and academicians as it forms the basis and
literature for future research. The study findings are expected to stimulate further
• research on the impact of infrastructure in attracting FDI, not only in Kenya, but
also globally.
1.6 Scope of the Study
This was a causality study and aimed at understanding the effects of infrastructure
developed on FDI attraction. It was used to measure the impact of infrastructure
development on FDI in Kenya. The researcher took into consideration key
-Election Violence (PEV) and the implementation of the first Medium Term Plan,
2008-2012 (Republic of Kenya, 2008). These are key moments in the history of
the country. Both the El-Nino rains and the Post-Election Violence (PEV) had a
destabilizing effect, with the rains causing havoc to infrastructure facilities.
Further, during the implementation of the first Medium Term Plan, 2008-2012,
key infrastructure facilities were implemented, among them the Thika Super
Highway, Mombasa Port Modernization and dredging, rehabilitation of airports
and airstrips, rehabilitation and maintenance key national and international trunk
roads.
The study used annual secondary data from various sources, spannmg 1970 to
2013. This period was long enough for statistical inference, and data was
available. It was sourced from several web sites and include that of Central Bank of
Kenya, World Bank and UNCTAD. Others sources include statistical abstracts
(various) and economic survey (various) .
••
1.7 Organization of the study
This research project is made up of five chapters; chapter one is the background of
the study. In what follows, chapter two titled, literature review, presents the
various theories and related variables that have been presented to depict the
relationship between factors that influence FDI inflows and how FDI on the other
hand impacts a country's overall growth. The chapter further presents an empirical
analysis of the several works done on the main determinants of FDI inflows by
different authors. An evaluation of both the theories and empirical literature is
finally presented, highlighting the gaps to be filled by conducting this study.
Chapter three is the methodology of the study. It presents the research design and a
conceptual framework, detailing the relationship between the dependent variable
and the explanatory variables. The section further presents the study model, in
theory and in concept, an explanation of the variables and their expected signs in
the formulated model. Chapter four gives the empirical results and explanations,
while Chapter five gives the summary, conclusions and policy implications. The
last sections contain references and appendices.
CH
A
PT
E
R
T
WO
LITERAT
U
R
E
RE
V
I
E
W
2.
1
I
nt
r
oduction
This chapter presents the literature review. It presents the various theories and
related variables that have been presented to depict the relationship between
factors that influence FDI inflows and how FDI on the other hand impacts a
country's overall growth. The chapter further presents an empirical analysis of the
several works done on the main determinants of FDI inflows by different authors.
An evaluation of both the theories and empirical literature is finally presented,
highlighting the gaps to be filled by conducting this study.
2
.
2
T
h
e
oretical Literature
From the several studies done on the factors that promote Foreign Direct
Investment (FDI) and the impact it has on host countries, one fact is evident, that
FDI is a more reliable source of capital to spur growth. In agreement, Lipsey III
(1999), in the study on the role of FDI in international capital flows, argued that
FDI has been the least volatile source of international investment for host
countries. Consistently, Lipsey opines that FDI has been the most dependable
source of foreign investment for developing countries. Based on Lipsey's study,
and in addition to other underlying reasons, many countries, including Kenya,
have adopted policies aimed at attracting foreign investors. However, a deep
why some countries are successful than others in attracting FDI, is a critical
pre-requite that may provide policy makers with a useful guide for policy direction,
both in the medium and long term.
Literature on the determinants of FDI is available. However, despite the large
number of studies that have been conducted to identify the determinants of FDI, no
consensus view has emerged. In view of this, no set of explanatory variables have
been formulated that can be regarded as the actual determinants of FDI. This,
Chakrabarti (2001) attributed to the different perspectives employed by the
different researchers, methodologies, sample-selection, data horizons and the fitted
models together with the analytical tools. Chakrabarti's attributions are evident in
the results produced and which are sensitive to these factors, hence an indication
of lack of robustness. Despite this, the Dynamic Macroeconomic FDI Theory
suggests that economic, social and political factors, cultural aspects as well as
government policies are equally significant in establishing a proper environment to
attract FDI (Chakrabarti, 2001).
As opined by Mooya (2003), macroeconomic stability is an important
consideration for investment. Stability increases business certainty and reduces
transaction costs. An example of such factors includes labour costs, trade tariffs
and barriers, terms of trade and trade balance, exchange rate and tax regimes.
These, according to some of the studies conducted have been found to have both
a set of explanatory variables is due to the absence of a consensus on a theoretical
framework to guide empirical work on FDI, Chakrabarti (2003) has made an
attempt to develop a theoretical model of FDI. To aid the empirical analysis of FDI, Chakrabarti (as contained in Mooya, 2003) proposes a model that assesses
the role of potential determinants of FDI distribution.
According to Chakrabarti, some of the determining variables include policy
variables (tax policy, trade policy, privatization policy, macroeconomic policy),
business variables (investment incentives), market-related economic determinants
(market size, market growth, market structure), resource-related economic
determinants (raw materials, labour cost, technology) and efficiency-related
economic determinants (transport and communication costs, labour productivity).
In support of Chakrabarti (2003), Dunning's Eclectic Theory combines industrial
economics and international trade to explain FDI. The theory postulates
• government policies, location specific advantage and ownership as important
aspects in attracting FDI. On government policies, the theory considers tariffs,
quotas, taxes, incentives, competition policy, subsidies, discrimination and
political stability. Policies favourable to business, as important determinants. On
host-country infrastructure, the theory talks about the quality of transport,
communication, energy and commercial services. This study will concentrate on
2.3
E
mp
i
rical Literature
Empirical literature exists on the various factors that promote FDI, both in
developing and developed countries. Different studies have attempted to bring out
the causal relationship between the factors using different approaches, economic
models, considering different variables and considering different datasets with
differing horizons. Some have established a uni-directional relationship while
others a bi-directional relationship, and have each presented an analysis of the
causality differences.
According to Houghwout (2001), the primary benefits of transport infrastructure
development are increased accessibility and reduced transport cost and firms can
benefit from these without actually contributing directly to the project. In Houghwout's argument, even if such infrastructure has no direct role in the cost
structure, evidence suggests that the indirect spill overs from agglomeration and
clustering created by public infrastructure lowers the costs of firms .
•
In the African context, a study by Asiedu (2002) who analysed 34 African
countries over the period 1980-2000, using the number of telephones per 1000
population to measure infrastructure development concluded that countries that
improved their infrastructure were rewarded with more investments. To Asiedu, a
•
Yasmin et al. (2003) analysed the volume and determinants of Foreign Direct Investment (FDI) in developing countries. Basing the analysis on a sample of 15
developing countries, 5 each from upper middle, lower middle and lower income
countries, the study established that the flow of FDI to developing countries has
followed an uneven path. The analysis further showed that urbanization, GDP per
capita, standard of living, inflation, current account and wages affect FDI inflows
significantly in low income countries; urbanization, labour force, domestic
investment, trade openness, standard of living, current account, external debt and
wages in lower middle income countries, and urbanization, labour force, GDP per
capita, domestic investment, trade openness and external debt in the sampled
upper middle income countries. The study attributed variations in FDI to
institutional and structural differences among the countries analysed. From the
three segments, it is evident that urbanization is a key determinant of FDI inflows,
hence well planned urban areas with the necessary infrastructure facilities are
likely to attract more FDI.
Using two proxies for road network (total roads length and paved roads) and
electricity (installed power capacity and gross generation) in Argentina, Castro et
al. (2007) established that paved and reliable roads matter in FDI attraction. From the results, a 10 percent increase in per capita paved roads boost FDI on the
average of between 17 percent and 33 percent. Further, increasing energy supply
in geographically close provinces would augment FDI inflows between 12percent
In a study to establish the impact of FDI in Malawi, Kazembe and Namizinga
(2007) found out that investors attach more weight on the need to communicate
with clients at ease and operate efficiently under reliable utilities. To Kazembe and
Namizinga, such factors include functional transport, energy and communication
infrastructure and utilities. Unreliable power and water supply and high cost of
transport make it hard for international investors to manufacture and produce
efficiently, while better road networks enable investors to transport and supply
products at lower costs.
•
In a study on foreign investment and econorruc development in Costa Rica,Cordero and Paus (2008) established that the Costa Rican government' efforts to
address concerns on improved road access, telecommunications, uninterrupted
access to reliable electricity and water at reasonable prices, had contributed
towards attracting more FDI to the country. Cordero and Paus findings are similar
to Kazembe and Namizinga (2007) findings.
Jordaan (20 10), while studying foreign direct investment and neighbouring
influences, established that good quality and well-developed infrastructure
increases the productivity potential of investments in a country and therefore
stimulates FDI flows towards the country. Consistent with Asiedu (2002) and
Ancharaz (2003), Jordaan argued that the number of telephones per 1,000
reliability of the infrastructure. To the study further, it only includes fixed-line
infrastructure and not cellular (mobile) telephones, and omits other important
infrastructure facilities such as roads and rail transport, water and energy supply
and sources.
•
Using an econometric model based on cross-sectional analysis for 38 developing
countries over the period of 2000-2010, Demirhan and Masca (2011) analysed the
determinants of foreign direct investment in developing countries. The study used
growth of per capita real GDP as a proxy for market size since absolute GDP
reflects size of population rather than income; telephone main lines per 1,000
people as a proxy for infrastructure and degree of openness computed as the sum
of nominal export and import divided by the nominal GDP. According to the
study, market size, infrastructure and the willingness of a country to accept foreign
investment were found to positively affect FDI inflows, their effect being
significant. It means that better infrastructure is an important determinant in attracting FDI to developing countries.
Voorpijl (2011) analysed FDI in Kenya, with an emphasis on the gains and losses
of associated with foreign involvement. Using a qualitative approach with a sample of investors that had made along term investment, the study unearthed the
strengths of analysing the investment climate. This was necessary since the
investment climate determine the economic stage of a country and is a reflection
are the presence and access to a good infrastructural network and the presence of a
highly educated and relatively cheap but qualified labour force.
•
To establish the main determinants and impacts of foreign direct investment on
China's economy, Ang (2012) considered five key aspects including total inward
and outward FDI flows; FDI inflows in comparison with other capital sources;
main countries of origin and destination of investment; sectoral and geographical
distribution of FDI and forms of investment. On fitting a time-series econometric model, the study found out that size and growth of the Chinese economy; natural
and human resource endowments; physical, financial and technological
infrastructure; openness to international trade and access to international markets;
regulatory framework, and investment protection and promotion as the main
determinants. In the study, physical, financial and technological infrastructure
were found to be highly correlated with FDI inflows. This, Ang (2012) opines is as
a result of the multiplier effect of infrastructure development, key to this being
openness to international trade and access to international markets, which depends
on sound infrastructural facilities.
U sing cross-sectional data covering 18 Arab countries, Moosa (2012) empirically
argued that FDI can be explained in terms of the GDP growth rate, enrolment in
tertiary education, spending on research and development, country risk and
attention to education and research. Additionally, Moosa argued that openness of
the economy represents the FDI and exports relationship, while telephone lines per
1000 inhabitants is a measure of availability and cost of telecommunications. To
Moosa, energy availability and sustainability is of particularly importance to
efficiency seeking investors.
According to Dumon (2014), every economy requires infrastructure resources in
order to facilitate the sale of goods and services. To Dumon, roads, highways,
•
bridges and other forms of physical infrastructure should be present, maintained
and provide sufficient safety for the transportation of goods as well as for the
commute of employees. Lower transaction costs enables investors to earn returns
on their investments as their enterprises are able to generate profits.
Several studies have argued that good infrastructure is a necessary condition for
foreign investors to operate successfully. The positive effect of infrastructure on
FDI has been found to be sensitive to time periods and countries considered.
Rehman et al. (2011) found positive impact of infrastructure on FDI in Pakistan,
while Wheeler and Mody (1992) found that infrastructure quality is an important
variable for developing countries seeking to attract FDI from the United States.
Further, using a self-reinforcing model of FDI, Cheng and Kwan (2000) found
support for good infrastructure (density of roads) as a determinant of FDI into 29
The role of growth in attracting FDI has also been the subject of controversy.
Chakrabarti (2003) stated that a rapidly growing economy provides relatively
better opportunities for making profits than the ones growing slowly or not
growing at all. Chakrabarti found a significantly positive effect of growth on FDI. On the other hand, Hausmann and Fernandez (2000) found no relationship
between FDI flows and political risk. Using data on US FDI, Loree and Guisinger
(1995) found that political risk had anegative impact on FDI. In a study on capital
•
flows and FDI in developing countries, Edwards (2010) established that political
instability was significant, while political violence was insignificant.
2.4
Overview of Literature
There is varied opinion on the impact of FDI to host countries. Some scholars have
suggested that FDI growth has mainly negative effects for developing countries,
while others argue the effects are mainly positive. Those in support argue that FDI
provides developing countries with the needed capital, employment opportunities,
knowledge, skills and new technology. Those against argue that foreign investors
are interested in exploiting the local capabilities freely, while promoting private
investments.
From the literature analysis, it is evident that the determinants of FDI inflows are
many and varied. Most of these factors have been captured vividly by Chakrabarti
(2.003). Different studies have used different variables, some based on the
Chakrabarti proposals and others as constructed by the authors. From the analysis,
further, it is evident that most of the studies are in agreement on the levels of
variable measurement and description. It has been established that the different
perspectives employed by the different studies, methodologies, sample-selection,
data horizons and the fitted models coupled with the analysis tools, cause most of
the variations. However, a sizable number of the results are in consonance.
For example, factors like labour costs, trade tariffs and barriers, trade openness
• and balance, exchange rate, quality infrastructure, economic growth and tax
regimes have been found to be significant determinants ofFDI inflow. The level of
significance has been found different for different regions and income cohorts.
Hence, there are concerns on the reliability of the results of previous studies, in
relation to their robustness.
One notable factor that has been narrowly captured by most of the studies has been
infrastructure. Moosa (2012); Jordaan (2010); Asiedu (2002) and Ancharaz (2003)
have all used telephone lines per 1000 inhabitants to represent the whole
infrastructure spectrum. To them, this is part of the infrastructure needed to
conduct international business and is a measures of availability and cost of
telecommunications, which is important for multinationals to coordinate
cross-border activity. Nyaosi (2011) established that infrastructure affects FDI inflows
significantly and these findings were similar to those of Mwega (2009); UNCT AD
(2005); Calderon (2009) and World Bank (2009). All these studies used a few
among the omitted variables includes those on water and waste management,
which are key indicators of growth and their omission would not give
comprehensive results, hence policy decisions.
This study, therefore, takes cognizance of the fact that infrastructure comprises of
many sub-indicators and thus, takes into consideration most of the variables
considered in previous studies, in addition to other selected sub-indicators, to
•
construct infrastructure indices using Principal Component Analysis (PCA).Together with the infrastructure indices, other variables as presented in the
CHAPTER THR
EE
METHODOLOG
Y
3.
1
I
ntrodu
c
tion
The section presents the methodology of the study. It presents the research design
and conceptual framework, detailing the relationship between the dependent
variable and the explanatory variables. The section further presents the study
•
model, in theory and in concept, an explanation of the variables and their
measurements in the formulated model.
3.
2
Re
s
earch Design
This was a causality study and aimed at understanding the effects of infrastructure
development on FDI attraction in Kenya. The study was motivated by the need to
establish either an empirical association or non-spuriousness. The direction and
strength of the relationship were key in this study. The study used secondary,
quantitative and qualitative time series data, spanning from 1970 to 2013.
3.3
Conceptual Framework
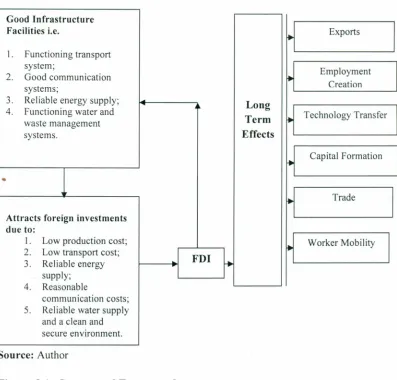
The following is the conceptual framework showing the relationship between
infrastructure development and FDI. It was expected that good infrastructure facilities would hasten production and distribution processes, hence spurring
Good Infrastructure
Facilities i.e.
•
ExportsI. Functioning transport
system;
Employment
2. Good communication
•
systems; Creation
3. Reliable energy supply; Long
4. Functioning water and Technology Transfer
waste management Term
•
systems. Effects
•
•
Capital Formation•
Trade
•
Attracts foreign investments due to:
I. Low production cost;
~ Worker Mobility
2. Low transport cost;
3. Reliable energy FDI ~ supply;
4. Reasonable
communication costs; 5. Reliable water supply
and aclean and secure environment.
Source: Author
Figure 3.1: Conceptual Framework
It was expected that a functioning transport system as well as an efficient and
reliable energy and water supply will cut down production costs. On the other
hand, good communication systems will hasten communication, both locally and
internationally. From literature, it has been established that investment decisions
are hinged on quality infrastructure systems. Thus, improved infrastructural
facilities lower the cost of doing business and hence improve the investment
climate. Besides infrastructure, other factors such as economic growth rate,
FDI in a specific country. FDI on the other hand leads to improvement of a
country's infrastructure, contributes to a country's capital formation hence
bridging the gap emanating from low domestic savings, creates employment,
results into technical transfers; with technical transfer, local firms crop-up.
3
.
4
T
h
e
or
e
ti
ca
l
M
od
e
l
As proposed by Kinda (2010), determinants of FDI and the decisions to invest in a
•
certain country fundamentally depends on the return on investment. The return on investment, profit, is the Total Revenue (TR) less Total Cost (TC).
Thus,
Profit =
f
(P,Q
,
TC) (3.1)Where P
=
Price of the Output,Q
On the other hand,
TC =IC+OC+ HC (3.2)
Where IC
=
Input Costs (i.e. labour, raw materials), OC=
Operation Costs, and HC=
Hidden cost.It follows that, factors that determine profit also determine FDI, hence,
FDII =
f
(P,Q,
TC) (3.3)Substituting (3.2) into (3.3)
FDII =
f
(P, Q,IC, ~C, HC) (3.4)From equation (3.4), it is evident that several factors attract FDI to a certain country and include, in this case, economic factors (transport infrastructure, energy
infrastructure, communication infrastructure, economic growth, and exchange
rate), social factors (water and waste management infrastructure, wage) and
political factors (security and openness to trade). This theoretical relationship can
be expressed as;
F~J/ =f (economic factors, social factors, political factors) (3.5)
3.5
Empirical Model
Using the theoretical model developed in equation (3.5), the FDI model is of the
form;
FDJ =po
+
LrIj Xji+
G (3.6)In equation (3.6), Xi represents Kenya's FDI determinants and in this case, as
presented in equation (3.5), they are economic, social and political factors.
Including specific factors that determine FDI in Kenya, the econometric model is
of the form;
FDJ/=f
en,
Eft, eft, WWft,EG/,ER/, WI,Sf, OJ (3.7)Where, FDI
=
Foreign Direct Investment, TI=
Transport Infrastructure Index, EI=
Energy Infrastructure Index, CI
=
Communication Infrastructure Index, WWI=
Water and Waste Infrastructure Index, EG
=
Economic Growth, ER=
ExchangeRate, SE
=
Security and took a value of 1 if insecurity situations were reported andzero otherwise, W
=
Nominal average earnings per person and 0=
Openness to3.6
Definition and Measurement of Variabl
es
Table 3.1: Variable Definition and Measurement
Variable Definition Measurement
Foreign Direct This is ameasure of net inflows in Kshs. It Ratio
Investment was the dependent variable
(FDI)
Transport Transport infrastructure: Air transport (no. of Ratio Infrastructure passengers and freight), Ianof tarmac ked
Index (TI) roads as a percentage of total road network in Kenya, Ianof railway line, portinfrastructure (containerport traffic innumbers),andno.of
•
passenger cars (per 1000 people).Energy Energy infrastructure: electric power Ratio
Infrastructure consumption per kWh; per capita
Index (EI) consumption of kilogrammes of oil
equivalent; energy generation in MW as a percentage ofdemand; renewable energy generation in MW as a percentage of total generation; percentage connection to the national grid.
Communication Communication infrastructure: fixed Ratio
Infrastructure broadband internet subscribers per 1000 Index (CI) people; telephone lines per 1000 people, ICT
goods exports (as a percentage of total goods exports), ICT goods imports (as a percentage of total goods imports), mobile cellular subscriptions (per 100 people).
Water and Water and waste management infrastructure: Ratio Waste Ianof sewer lines as a percentage of urban
Management population; water availability measured in Infrastructure M3 as a percentage of demand in M3;
Index (WWI) improved water source in urban areas (% of urban population with access).
Economic The level of economic growth expressed as a Ratio
Growth (EG) percentage
Exchange Rate Kenya's official exchange rate against the US Ratio
(ER) dollar
Wage (W) Nominal average earnings per person in Ratio
Kenya shillings
Security (SE) This was adummy variable. It proxies Nominal
Variable Definition Measurement
1992,1997,2002 and 2007/2008; terrorist attacks in 1998, 2001, 2012 and 2013. The year of incidence occurrence took the value of 1 and year of no occurrence took the value of 0
Openness (0) Trade openness expressed as the sum of Ratio export and import to GDP
Infrastructure comprises of many sub-indicators and thus, in this study, selected
sub-indicators were used to construct four (4) infrastructure indices using Principal •
Component Analysis (PCA). The index was defined as;
(3.8)
Where, IIi
=
Infrastructure Index for the ithcategory (i.e. TI, EI, CI and WWI) andWi is the weight of the /h indicator.
3.7
D
ata Ty
p
e
and Source
s
The study used annual secondary data from various sources, spanning 1970 to
2013. It was sourced from several websites and include that of Central Bank of
Kenya, World Bank and UNCTAD. Other sources included government statistical
abstracts (various) and economic survey (various).
3.8
Da
ta
Cl
e
aning and R
e
fin
e
ment
To avoid errors in the analysis, the data was cleaned and refined. Several
homoscedasticity) were done pnor to actual analysis to avoid admission of
spurious results. Data completeness was ensured.
3.9
Correl
a
tion Analysis
Pair-wise correlation analysis were done for the independent variables. The
correlation coefficient was used as a measure of the strength and the direction of a linear relationship between a pair of variables. The coefficient ranges from -1 to 1,
•
and if close to one (1), the relationship between the pair is strong, and vice versa.
When two independent variables are highly correlated, then model coefficients cannot be estimated with precision (Gujarati, 1999).
3
.
10
St
a
tionarity Anal
y
sis
To avoid admission of spurious results, the data was tested to ensure there is no trend or seasonality in the data. The unit root test was done using Augmented Dickey Fuller (ADF) test. The tests were done at levels and differences to
determine the order of integration. According to Gujarati (1999), ADF test
assumes that the error terms are independently and identically distributed.
The ADF involves the estimation of the following equation;
~Yt
=
0.+
Bl'+
rpYt-1+
J11 (3.9)Whose hypotheses are;
If a variable has unit roots, they were differenced until none exists, hence
determining the order of integration.
3
.
1
1
Co
int
eg
r
at
i
o
n
A
nal
ys
i
s
Long-term relationship between the variables was tested usmg the Johansen
Maximum Likelihood Cointegration test, given the multivariate nature of the
model. Prior to this, the model lag length was determined using
Schwartz-•
Bayesian Information Criterion, as the Johansen Maximum Likelihood method is
sensitive to the number of lags. With cointegration present then, an Error
Correction Mechanism was used to determine the speed and direction of
adjustment to shocks.
3
.
12
Data A
n
a
l
ys
i
s
To determine the effects of transport, energy, communication, water and waste
management infrastructure development on FDI inflows in Kenya, multiple
regression analysis was done, through estimation of 3.7. Prior to this, selected
sub-indicators were used to construct the four (4) infrastructure indices, using 3.8. It
was expected that coefficients resulting from regressing explanatory variables
against the dependent variable would explain how FDI responds to changes in the
explanatory variable. After estimation, model specification tests .(goodness of fit
and test for omitted variables) were done. The results were tabulated for ease of
CHAPTER FOUR
EMPIRICAL RESULTS AND DISCUSSION
4.1
Introduction
This Chapter presents the results from the analysis. The section presents the lag
length selection procedure, stationarity test, cointegration test, and both short and
long run regression results. An explanation is presented for each section.
•
4.2
Time Series Properties
4.2.1 Lag Length Determination
The model lag length was determined using Schwartz-Bayesian Information
Criterion (SBIC), as the Johansen Maximum Likelihood method for testing for
cointegration is sensitive to the number of lags. In this case, one lag was selected
for the model as shown in table A6 in the appendix. The lag length with the lowest
SBIC was selected.
4.2.2 Unit Root Test Results
To avoid admission of spurious results, the data was tested to ensure there was no
trend or seasonality. The test was done using Augmented Dickey Fuller (ADF)
test. The tests was done at levels and differences to determine the order of
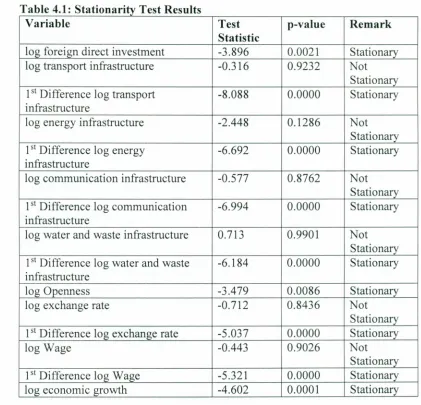
Table 4.1: Stationarity Test Results
Variable Test p-value Remark
Statistic
log foreign direct investment -3.896 0.0021 Stationary
log transport infrastructure -0.316 0.9232 Not
Stationary 15tDifference log transport -8.088 0.0000 Stationary
infrastructure
log energy infrastructure -2.448 0.l286 Not
Stationary 15tDifference log energy -6.692 0.0000 Stationary infrastructure
log communication infrastructure -0.577 0.8762 Not Stationary 15tDifference log communication -6.994 0.0000 Stationary infrastructure
log water and waste infrastructure 0.713 0.9901 Not Stationary 15tDifference log water and waste -6.184 0.0000 Stationary infrastructure
log Openness -3.479 0.0086 Stationary
log exchange rate -0.712 0.8436 Not
Stationary 15tDifference log exchange rate -5.037 0.0000 Stationary
log Wage -0.443 0.9026 Not
Stationary
l" Difference log Wage -5.321 0.0000 Stationary
log economic growth -4.602 0.0001 Stationary
Most of the variables, log of transport infrastructure, log of communication
infrastructure, log of energy infrastructure, log of water and waste infrastructure,
log of nominal wage and log of exchange rate were found to be integrated of first
order, I (1), while log of FDI, log of economic growth and log of openness were
found to be integrated of order zero, I (0). This meant that, log of transport
infrastructure, log of communication infrastructure, log of energy infrastructure,
rate were stationary at difference. The log of FDI, log of economic growth and log
of openness were stationary at level, meaning that the null hypotheses for the
presence of unit roots were rejected at 5 percent for these variables.
4.2.3 Cointegration Test
Having established that some of the variables in the study were I (0) and others I
(1), it was important to establish the existence of long run relationship between the
dependent and independent variables. Using the Johansen test for co integration,
the trace statistic was found to be smaller than the critical value at 5 percent level
of significance, with a maximum rank of 4. This implied that cointegration was
present and that there existed at least four (4) co-integrated equations, in ether bi
-directional or uni-directional relationship as shown in table A2 in the appendix.
This meant that the dependent and independent variables move closely to achieve
a long run equilibrium.
'!
4
.
3
Correlation A
n
a
l
ys
i
s
R
es
ult
s
Pair-wise correlation analysis was done for the independent variables, and the
results are shown in table A5 inthe appendix. The correlation coefficient was used
as a measure of the strength and the direction of a linear relationship between a
pair of variables. The coefficient ranges from -1 to 1, and if close to one (1), the
relationship between the pair is strong, and vice versa. The results indicated that
the log of Energy Infrastructure and the log of Transport Infrastructure, the log of
relationships. The log of Transport Infrastructure and the log of Communication
Infrastructure had a strong positive relationship, while the log of Communication
Infrastructure had a strong negative relationship with the log of Exchange Rate.
However, a Durbin-Watson (DW) statistic of 2.46 lies in the indecision quadrant
(is closer to 2 and far from the extreme values, 0 and 4), hence, the variables were
considered as having no serial correlation problem.
4.4
Diagnostic Test Result
s
Table 4.2 shows a summary of the diagnostic tests conducted. These include
normality tests, test for omitted variables, model specification, serial correlation, Iv
model fit and test for homoscedasticity. Several diagnostic tests were performed to
ensure soundness of the results as shown in the following table.
T hI 42a e
..
Summary 0r m
ragnos fICT
estsTest Description t-statistic p-value
Jarque-Bera For checking 0.89 0.641
normality
Ramsey RESET Test for omitted 0.58 0.632
Test variables
Durbin- Watson Test for serial 2.46
-Test correlation (if lies
close to 0 and 4, then presence of
co 11ineari ty)
Link Test Test for Model fit .067 0.454
White's Test Test for 44 0.429
homoscedasticity
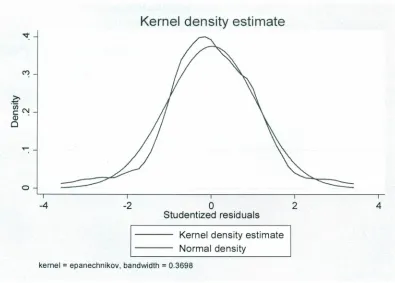
As the study model was multiple regression equation, the error term was expected
to be normally distributed, with a zero mean and constant variance. This test was
figure A 1 and figure A2 in the appendix. The plot showed that the error terms
were not normally distributed before transformation, but were after the data was
transformed. A Shapiro- Wilk test for normal data and larque-Bera Normality test
(as shown in table A8 in the appendix) supports the result. Hence, the assumption
that the residuals followed a normal distribution could not be rejected at 5 percent
level of significance.
Further, using the White's test, the error term was found to be homoscedastic with
a calculated Chi-square (43) value of 44.00 with probability 0.4290, implying that
the null hypothesis of constant variance could not be rejected at 5 percent level of
significance, as the probability was greater than 0.05 as shown in table A9 in the
appendix. Again, a Durbin-Watson (DW) statistic of 2.46 lies in the indecision
quadrant (is closer to 2 and far from the extreme values, 0 and 4), hence, the
variables were considered as having no serial correlation problem.
The data was also tested for linearity using a graph matrix.· The graph matrix
showed that the independent variables were not in linear relationship before
transformation, but were after the data was transformed.
Model specification tests were done using the Ramsey RESET test and the null
hypothesis was that the model had no omitted variables. The test results showed
that the model had no omitted variables [F (3, 32) =0.70, p>0.05)], while a test of
model specification showed that the model fitted well (p =0.449). Hence, the null
rejected at 5 percent level of significance. A CUSUM test, as shown in figure A4
and A5 in the appendix, shows that parameter constancy in the model is
maintained for entire study period. This supports the model stability test as shown
in figure A3 in the appendix.
4.5
Regres
s
ion Re
s
ults
The following table contains the multiple regression results from a model with the
log of FDI as the dependent variable, and log of transport infrastructure, log of
energy infrastructure, log of communication infrastructure, log of water and waste
infrastructure, log of trade openness, log of exchange rate, log of economic
growth, log of annual nominal wage and security, as explanatory variables.
T bl 43a e
..
Rearessron ResuItSVariable Coefficient t-statistic p-value
Constant 2416.455 0.41 0.686
log transport infrastructure 4.881** 4.26 0.000
log energy infrastructure 1.524 1.25 0.213
log communication 1.127** 9.77 0.000
infrastructure
log water and waste 0.605** 6.21 0.000
infrastructure
log exchange rate 0.602** 6.75 0.000
log economic growth 0.460** 2.80 0.005
log openness 0.624** 4.72 0.000
log wage -0.131 -1.50 0.132
Security -0.352 -0.93 0.353
.
R-squared =0.5604, Adjusted R-squared =0.4440, Root Mean Squared Error = 1.0713; P<0.05,
••p <0.01; F (9, 34)=4.81, P=0.004
The F-statistic (4.8) is statistically significant at 1 percent level of significance
meaning that all the independent variables as a group, explain 56.04 percent of the
the number of variables is small compared to the number of cases (in this case, 9
variables each with 44 cases). The model has a better fit since its Root Mean
Squared Error is 1.0713. The closer the Root Mean Squared Error to zero, the better the model. The model has a trend at 2416.455, meaning that in the absence of all the model variables, FDI inflows increase with a constant factor, equivalent
to the trend as shown in table A7 in the appendix.
4.5.1 Effects of Transport Infrastructure Development on FDI Inflows
The coefficient of the log of transport infrastructure index was significant at
percent level of significance (p<0.01), meaning that transport infrastructure was
important in attracting FDI. Consistent with theory, a percentage increase in transport infrastructure development index increases FDI inflows by 4.88 percent,
making transport infrastructure very important in attracting FDI. This means that an increase in air transport (passengers and freight), more kilometres of tarmacked
roads as a percentage of total road network, more kilometres of rail line,
improvement in port infrastructure (container port traffic), and increase in
passenger cars, are key determinants in attracting FDI to the country.
These findings are similar to those by Dumon (2014); Rehman et al. (2011); Cheng and Kwan (2000); Castrol et al. (2007); Kazembe and Namizinga (2007);
Demirhan and Masca (2011) and Jordaan (2010). Interestingly, although in