A Method of Cluster-Based Indexing of Textual Data
Akiko AizawaNational Institute of Informatics [email protected]
Abstract
This paper presents a framework for cluster-ing in text-based information retrieval systems. The prominent feature of the proposed method is that documents, terms, and other related el-ements of textual information are clustered si-multaneously into small overlapping clusters. In the paper, the mathematical formulation and implementation of the clustering method are briefly introduced, together with some experi-mental results.
1 Introduction
This paper is an attempt to provide a view of
indexing as a process of generating many small
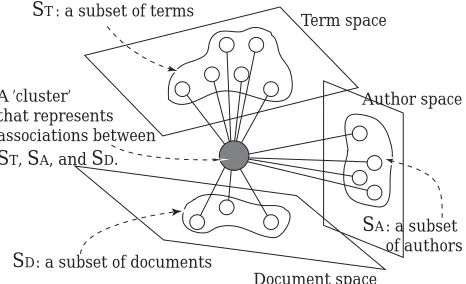
clusters overlapping with each other. Individ-ual clusters, referred to as micro-clusters in this paper, contain multiple subsets of associated el-ements, such as documents, terms, authors, key-words, and other related attribute sets. For ex-ample, a cluster in Figure 1 represents ‘a set of documents written by a specific community of authors related to a subject represented by a set of terms’.
Our motivations for considering such clusters are that (i) the universal properties of text-based information spaces, namely large scale, sparseness, and local redundancy (Joachims, 2001), may be better manipulated by focusing on only limited sub-regions of the space; and also that (ii) the multiple viewpoints of infor-mation contents, which a conventional retrieval system provides, can be better utilized by con-sidering not only the relations between ‘doc-uments’ and ‘terms’ but also associations be-tween other attributes such as ‘authors’ within the same unified framework.
Based on the background, this paper presents a framework of micro-clustering, within which we adopt a probabilistic formulation of
co-ST: a subset of terms
SD: a subset of documents
SA: a subset of authors A ’cluster’
that represents associations between ST, SA, and SD.
Term space
Document space
Author space
Figure 1: Cluster-based indexing of information spaces.
occurrences of textual elements. For simplic-ity, we focus primarily on the co-occurrences between ‘documents’ and ‘terms’ in our expla-nation, but the presented framework is directly applicable to more general cases with more than two attributes.
2 Background Issues
A view from indexing
become computationally infeasible when deal-ing with high-dimensional data.
A view from clustering
The document-clustering problem has also been extensively studied in the past (Iwayama and Tokunaga, 1995; Steinbach et al., 2000). The majority of the previous approaches to clus-tering construct either a partition or a hierarchy of target documents, where the generated clus-ters are either exclusive or nested. However, generating mutually exclusive or tree-structured clusters in general is a hard-constrained prob-lem and thus is likely to suffer high computa-tional costs when dealing with large-scale data. Also, such a constraint is not necessarily re-quired in actual applications, because ‘topics’ of documents, or rather ‘indices’ in our context, are arbitrarily overlapped in nature (Zamir and Etzioni, 1998).
Basic Strategy:
Based on the above observations, our basic strategy is as follows:
•Instead of generating component vectors with many non-zero elements, produce only limited subsets of elements, i.e., micro-clusters, with significance weights.
•Instead of transforming the entire co-occurrence matrix into a different feature space, extract tightly associated sub-structures of the elements on the graphical representation of the matrix.
•Use entropy-based criteria for cluster evalua-tion so that the sizes of the generated clusters can be determined independently of other ex-isting clusters.
•Allow the generated clusters to overlap with each other. By assuming that each element can be categorized into multiple clusters, we can reduce the problem to a feasible level where the clusters are processed individually.
Related studies:
Another important aspect of the proposed micro-clustering scheme is that the method em-ploys simultaneous clustering of its composing elements. This not only enables us to com-bine issues intermindexing anddocument clus-tering, as mentioned above, but also is useful for connecting matrix-based and graph-based
notions of clustering; the latter is based on the association networks of the elements ex-tracted from the original co-occurrence matri-ces. Some recent topics dealing with this sort of duality and/or graphical views include: the Information Bottleneck Method (Slonim and Tishby, 2000), Conceptual Indexing (Dhillon and Modha, 1999; Karypis and Han, 2000), and Bipartite Spectral Graph Partitioning (Dhillon, 2001), although each of these follows its own mathematical formulation.
3 The Clustering Method
3.1 Definition of Micro-Clusters
LetD={d1,· · ·, dN} be a collection of N tar-get documents, and let SD be a subset of doc-uments such that SD ⊆ D. Likewise, let T =
{t1,· · ·, tM} be a set of M distinct terms that appear in the target document collection, and let ST be a subset of terms such that ST ⊆T. A cluster, denoted as c, is defined as a combi-nation ofST and SD:
c= (ST, SD). (1)
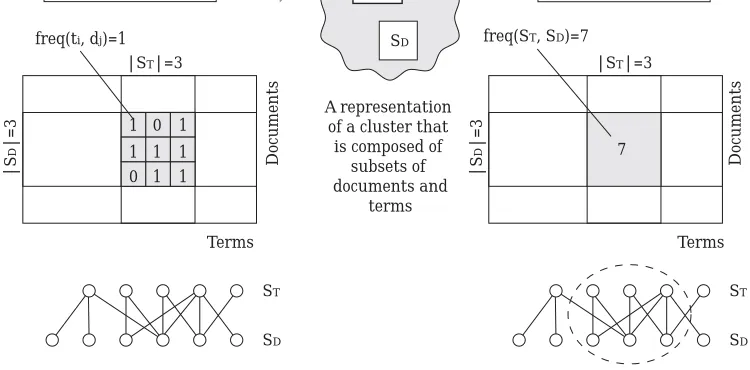
The co-occurrences of terms and documents can be expressed as a matrix of sizeM×N in which the (i, j)-th cell indicates that ti (∈T) appears in dj (∈D). We make the value of the (i, j)-th cell equal tof req(ti, dj). Although we primarily assume the value is either ‘1’ (exist) or ‘0’ (not exist) in this paper, our formulation could eas-ily be extended to the cases where f req(ti, dj) represents the actual number of times that ti appears indj.
The observed total frequency ofti over all the documents inDis denoted asf req(ti, D). Simi-larly, the observed total frequency ofdj, i.e. the total number of terms contained in dj, is de-noted as f req(T , dj). These values correspond to summations of the columns and the rows of the co-occurrence matrix. The total frequency of all the documents is denoted as f req(T , D). Thus,
f req(T, D) = ti∈T
f req(ti, D) = dj∈D
f req(T, dj)
=
ti∈T
dj∈D
f req(ti, dj). (2)
We sometimes use f req(ti) for f req(ti, D),
Documents
Terms
A representation of a cluster that
is composed of subsets of documents and
terms SD
ST
c(ST,SD)
freq(ti, dj)=1 freq(ST, SD)=7
0
0 1 1
1
1 1 1 |ST|=3
|S
D
|=3
Documents
Terms 7
1
Before agglomeration After agglomeration
|S
D
|=3
|ST|=3
ST
SD
ST
SD
Figure 2: Example of a cluster defined on a co-occurrence matrix.
When a cluster c is being considered, T and D in the above definitions are changed toST and
SD. In this case,f req(ti, SD) and f req(ST, dj) represent the frequencies of ti and dj within c= (ST, SD), respectively. In the co-occurrence matrix, a cluster is expressed as a ‘rectangular’ region if terms and documents are so permuted (Figure 2).
3.2 Probabilistic Formulation
The view of the co-occurrence matrix can be further extended by assigning probabilities to each cell. With the probabilistic formulation, ti and dj are considered as independently ob-served events, and their combination as a sin-gle co-occurrence event (ti, dj). Then, a cluster c = (ST, SD) is also considered as a single co-occurrence event of observing one of ti ∈ ST within one of dj ∈SD.
In estimating the probability of each event, we use a simple discounting method similar to the absolute discounting in probabilistic lan-guage modeling studies (Baayen, 2001). The method subtracts a constant value δ, called a discounting coefficient, from all the observed term frequencies and estimates the probability of ti as:
P(ti) =f req(ti)−δ
F . (3)
Note that the discounting effect is stronger for low-frequency terms. For high-frequency terms,
P(ti) ≈ f req(ti)/F. In the original definition, the value of δ was uniquely determined, for ex-ample asδ = mM(1) withm(1) being the number of terms that appear exactly once in the text. However, we experimentally vary the value of δ in our study, because it is an essential factor for controlling the size and quality of the generated clusters.
Assuming that the probabilities assigned to documents are not affected by the discounting, P(dj|ti) =f req(ti, dj) / f req(ti). Then, apply-ing P(ti, dj) = P(dj|ti)P(ti), the co-occurrence probability of ti and dj is given as:
P(ti, dj) = f req(ti)−δ
f req(ti) ·
f req(ti, dj)
F . (4)
Similarly, the co-occurence probability of ST andSD is given as:
P(ST, SD) =f req(ST)−δ
f req(ST) ·
f req(ST, SD)
F . (5)
3.3 Criteria for Cluster Evaluation
joint distributionP(T,D). By the general defi-nition of traditional information theory, the mu-tual information betweenT and D, denoted as
I(T,D), is calculated as: the mutual information after agglomerating ST and SD into a single cluster (Figure 2) is calcu-lated as:
The fitness of a cluster, denoted as
δI(ST, SD), is defined as the difference of the two information values given by Eqs.(6) and (7):
δI(ST, SD) =I(T,D)− I(T,D) the above equation is always negative or zero. However, with discounting, the value becomes positive for uniformly dense clusters, because the frequencies of individual cells are always smaller than their agglomeration and so the dis-counting effect is stronger for the former.
Using the same formula, we calculated the significance weights ti inc= (ST, SD) as:
δI(ti, SD) = dj∈SD
P(ti, dj)log P(ti, dj)
P(ti)P(dj), (9)
and the significance weights ofdj as:
δI(ST, dj) = ti∈ST
P(ti, dj)log P(ti, dj)
P(ti)P(dj). (10)
In other words, all the terms and documents in a cluster can be jointly ordered according to their contribution in the entropy calculation given by Eq. (7).
To summarize, the proposed probabilistic formulation has the following two major fea-tures. First, clustering is generally defined as an operation of agglomerating a group of cells in the contingency table. Such an interpreta-tion is unique because existing probabilistic ap-proaches, including those with a duality view, agglomerate entire rows or columns of the con-tingency table all at once. Second, the estima-tion of the occurrence probability is not simply in proportion to the observed frequency. The discounting scheme enables us to trade off (i) the loss of averaging probabilities in the ag-glomerated clusters, and (ii) the improvement of probability estimations by using larger sam-ples sizes after agglomeration.
It should be noted that although we have re-stricted our focus to one-to-one correspondences between terms and documents, the proposed framework can be directly applicable to more general cases with k(≥ 2) attributes. Namely, given k random variables X1,· · ·, Xk, Eq. (8) can be extended as:
δI(SX1,· · ·, SXk)
3.4 Cluster Generation Procedure
The cluster generation process is defined as the repeated iterations of cluster initiation and clus-ter improvement steps (Aizawa, 2002).
(10). If the performance of the target cluster is improved after the elimination, then the corre-sponding term or document is removed. When finished with all the terms and documents in the cluster, the newly generated cluster is tested to see whether the evaluation value given by Eq. (8) is positive. Clusters that do not satisfy this condition are discarded. Note that the resulting cluster is only locally optimized, as the improve-ment depends on the order of examining terms and documents for elimination.
At the initiation step, instead of randomly selecting an initiating term, our current im-plementation enumerates all the existing terms ti ∈ T. We also limit the sizes of ST and SD to kmax = 50 to avoid explosive computation caused by high frequency terms. Except for kmax, the discounting coefficient δ is the only parameter that controls the sizes of the gener-ated clusters. The effect of δ is examined in detail in the following experiments.
4 Experimental Results
4.1 The Data Set
In our experiments, we used NTCIR-J11, a Japanese text collection for retrieval tasks that is composed of abstracts of conference papers organized by Japanese academic societies. In preparing the data for the experiments, we first selected 52,867 papers from five different so-cieties: 23,105 from the Society of Polymer Science, Japan (SPSJ), 20,482 from the Japan Society of Civil Engineers (JSCE), 4,832 from the Japan Society for Precision Engineering (JSPE), 2,434 from the Ecological Society of Japan (ESJ), and 2,014 from the Japanese So-ciety for Artificial Intelligence (JSAI).
The papers were then analyzed by the mor-phological analyzer ChaSen Ver.2.02 (Mat-sumoto et al., 1999) to extract nouns and com-pound nouns using the Part-Of-Speech tags. Next, the co-occurrence frequencies between documents and terms were collected. After pre-processing, the number of distinctive terms was 772,852 for the 52,867 documents.
4.2 Clustering Results
In our first experiments, we used a framework of unsupervised text categorization, where the quality of the generated clusters was evaluated
1http://research.nii.ac.jp/ntcir/
by the goodness of the separation between dif-ferent societies. To investigate the effect of the discounting parameter, it was given the values δ= 0.1,0.3,0.5,0.7,0.9,0.95.
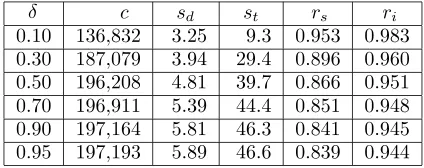
Table 1 compares the total number of gener-ated clusters (c), the average number of docu-ments per cluster (sd), and the average number of terms per cluster (st), for different values of
δ. We also examined the ratio of unique clus-ters that consist only of documents from a sin-gle society (rs), and an inside-cluster ratio that is defined as the average relative weight of the dominant society for each cluster (ri). Here, the weight of each society within a cluster was cal-culated as the sum of the significance weights of its component documents given by Eq. (10).
The results shown in Table 1 indicate that re-ducing the value ofδ improves the quality of the generated clusters: with smallerδ, the single so-ciety ratio and the inside-cluster ratio becomes higher, while the number of generated clusters becomes smaller.
Table 1: Summary of clustering results.
δ c sd st rs ri
0.10 136,832 3.25 9.3 0.953 0.983 0.30 187,079 3.94 29.4 0.896 0.960 0.50 196,208 4.81 39.7 0.866 0.951 0.70 196,911 5.39 44.4 0.851 0.948 0.90 197,164 5.81 46.3 0.841 0.945 0.95 197,193 5.89 46.6 0.839 0.944
4.3 Categorization Results
In our second experiment, we used a frame-work of supervised text categorization, where the generated clusters were used as indices for classifying documents between the existing so-cieties, and the categorization performance was examined.
For comparison, two supervised text categoriza-tion methods, naive Bayes and Support Vector Machine (SVM), were also applied to the same training and test sets.
The results are shown in Table 2. In this case, the performance was better for larger δ, indicating that the major factor determining the categorization performance was the num-ber of clusters rather than their quality. For δ = 0.5∼0.95, each tested document appeared in at least one of the generated clusters, and the performance was almost comparable to the per-formance of standard text categorization meth-ods: slightly better than naive Bayes, but not so good as SVM. We also compared the perfor-mance for varied sizes of training sets and also using different combination of societies, but the tendency remained the same.
Table 2: Summary of categorization results.
δ correct judge F-value 0.10 2,370 2,446 0.932 0.30 2,520 2,623 0.957 0.50 2,575 2,641 0.975 0.70 2,583 2,641 0.978 0.90 2,584 2,641 0.978 0.95 2,583 2,641 0.978 naive Bayes 2,579 2,641 0.977 SVM 2,602 2,641 0.985
4.4 Further Analysis
Analysis of categorization errors
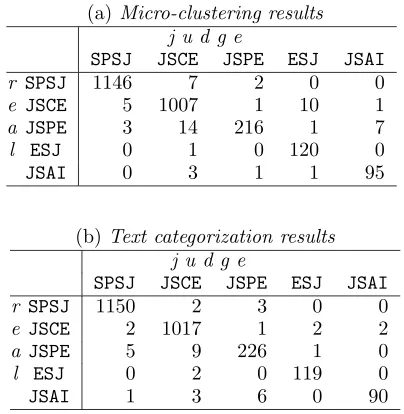
Table 3 compares the patterns of misclassi-fication, where the columns and rows repsent the classified and the real categories, re-spectively. It can be seen that as far as mi-nor categories such as ESJ and JSAI are con-cerned, the proposed micro-clustering method performed slightly better than SVM. The rea-son may be that the former method is based on locally conformed clusters and less affected by the skew of the distribution of category sizes. However, the details are left for further investi-gation.
In addition, by manually analyzing the indi-vidual misclassified documents, it can be con-firmed that most of them dealt with inter-domain topics. For example, nine out of the ten
JSCE documents misclassified as ESJ were re-lated to environmental issues; six out of the 14
JSPEdocuments misclassified asJSCE, as well as all sevenJSPE documents misclassified asJSAI, were related to the application of artificial intel-ligence techniques. These were the major causes of the performance difference of the two meth-ods.
Table 3: Analysis of miss-classification.
(a)Micro-clustering results j u d g e
SPSJ JSCE JSPE ESJ JSAI
r SPSJ 1146 7 2 0 0
e JSCE 5 1007 1 10 1
a JSPE 3 14 216 1 7
l ESJ 0 1 0 120 0
JSAI 0 3 1 1 95
(b)Text categorization results j u d g e
SPSJ JSCE JSPE ESJ JSAI
r SPSJ 1150 2 3 0 0
e JSCE 2 1017 1 2 2
a JSPE 5 9 226 1 0
l ESJ 0 2 0 119 0
JSAI 1 3 6 0 90
Effect of local improvement:
We also tested the categorization perfor-mance without local improvement where the top 50 terms at most survive unconditionally after forming the initial clusters. In this case, the clustering works similarly to the automatic rel-evance feedback in information retrieval. Us-ing the same data set, the result was 2,564 cor-rect judgments (F-value 0.971), which shows the effectiveness of local improvement in reducing noise in automatic relevance feedback.
Effect of cluster duplication check:
perfor-mance obtained for δ = 0.9 was 2,582 correct judgments (F-value 0.978) with 137,867 (30% reduced) clusters.
The results indicate that the system does not necessarily require expensive redundancy checks for the generated clusters as a whole. Such con-sideration becomes necessary when the formu-lated clusters are presented to users, in which case, the duplication check can be applied only locally.
5 Discussion
In this paper, we reported a method of gener-ating overlapping micro-clusters in which doc-uments, terms, and other related elements of text-based information are grouped together.
Comparing the proposed micro-clustering method with existing text categorization meth-ods, the distinctive feature of the former is that the documents on borders are readily viewed and examined. In addition, the terms in the cluster can be further utilized in digesting the descriptions of the clustered documents. Such properties of micro-clustering may be particu-larly important when the system actually inter-acts with its users.
For comparison purposes, we have used only the conventional documents-and- terms feature space in our experiments. However, the pro-posed micro-clustering framework can be ap-plied more flexibly to other cases as well. For example, we have also generated clusters using the co-occurrences of the triple of documents, terms, and authors. Although the performance was not much different in terms of text catego-rization (2,584 correct judgments out of 2,639 judgments, the precision slightly improved), we can confirm that many of the highly ranked clus-ters contain documents produced by the same group of authors, emphasizing the characteris-tics of such generated clusters.
Future issues include: (i) enhancing the prob-abilistic models considering other discounting techniques in linguistic studies; (ii) developing a strategy for initiating clusters by combining different attribute sets, such as documents or authors; and also (iii) establishing a method of evaluating overlapping clusters. We are also looking into the possibility of applying the pro-posed framework to Web document clustering problems.
References
A. Aizawa. 2000. The feature quantity: An informa-tion theoretic perspective of tfidf-like measures. InProc. of ACM SIGIR 2000, pages 104–111. A. Aizawa. 2002. An approach to microscopic
clus-tering of terms and documents. InProc. of the 7th Pacific Rim Conference on Artificial Intelligence (to appear).
R. H. Baayen. 2001. Word frequency distributions. Kluwer Academic Publishers.
S. Deerwester, S. T. Dumais, G. W. Furnas, T. K. Landauer, and R. Harshman. 1990. Indexing by latent semantic analysis. Journal of American So-ciety of Information Science, 41:391–407.
I. S. Dhillon and D. S. Modha. 1999. Concept decomposition for large sparse text data using clustering. Technical Report Research Report RJ 10147, IBM Almaden Research Center.
I. S. Dhillon. 2001. Co-clustering documents and words using bipartite spectral graph partitioning. Technical Report 2001-05, UT Austin CS Dept. M. Iwayama and T. Tokunaga. 1995. Cluster-based
text categorization: a comparison of category search strategies. In Proc. of ACM SIGIR’95, pages 273–281.
T. Joachims. 2001. A statistical learning model of text classification for support vector machines. In
Proc. of ACM SIGIR 2001, pages 128–136. G. Karypis and E.-H. Han. 2000. Fast supervised
dimensionality reduction algorithm with applica-tions to document categorization and retrieval. In
Proc. of the 9th ACM International Conference on Information and Knowledge Management, pages 12–19.
Y. Matsumoto, A. Kitauchi, T. Yamashita, Y. Hi-rano, K. Matsuda, and M. Asahara. 1999. Mor-phological analysis system chasen 2.0.2 users manual. NAIST Technical Report NAIST-IS-TR99012, Nara Institute of Science and Technol-ogy.
N. Slonim and N. Tishby. 2000. Document cluster-ing uscluster-ing word clusters via the information bot-tleneck method. In Proc. of ACM SIGIR 2000, pages 2008–2015.
M. Steinbach, G. Karypis, and V. Kumar. 2000. A comparison of document clustering techniques. In
KDD Workshop on Text Mining.