Taxonomy Learning using Term Specificity and Similarity
Pum-Mo Ryu
Computer Science Division, KAIST
KORTERM/BOLA
Korea
[email protected]
Key-Sun Choi
Computer Science Division, KAIST
KORTERM/BOLA
Korea
[email protected]
Abstract
Learning taxonomy for technical terms is difficult and tedious task, especially when new terms should be included. The goal of this paper is to assign taxonomic relations among technical terms. We pro-pose new approach to the problem that relies on term specificity and similarity measures. Term specificity and similarity are necessary conditions for taxonomy learning, because highly specific terms tend to locate in deep levels and semanti-cally similar terms are close to each other in taxonomy. We analyzed various fea-tures used in previous researches in view of term specificity and similarity, and ap-plied optimal features for term specificity and similarity to our method.
1
Introduction
Taxonomy is a collection of controlled vocabu-lary terms organized into a hierarchical structure. Each term in a taxonomy is one or more parent-child relationships to other terms in the taxon-omy. Taxonomies are useful artifacts for orga-nizing many aspects of knowledge. As compo-nents of ontologies, taxonomies can provide an organizational model for a domain (domain on-tology), or a model suitable for specific tasks (task ontologies) (Burgun & Bodenreider, 2001). However their wide usage is still hindered by time-consuming, cost-ineffective building proc-esses.
The main paradigms of taxonomy learning are on the one hand pattern based approaches and on the other hand distributional hypothesis based approaches. The former is approaches based on matching lexico-syntactic patterns which convey
taxonomic relations in a corpus (Hearst, 1992; Iwanska et al., 2000), and the latter is statistical approaches based on the distribution of context in corpus (Cimiano et al., 2005; Yamamoto et al., 2005; Sanderson & Croft, 1999). The former fea-tures a high precision and low recall compared to the latter. The quality of learned relations is higher than those of statistical approaches, while the patterns are rarely applied in real corpus. It is also difficult to improve performance of pattern based approaches because they are simple and clear. So, many researches have been focused on raising precision of statistical approaches.
We introduce new distributional hypothesis based taxonomy learning method using term specificity and term similarity. Term specificity is a measure of information quantity of terms in given domain. When a term has much domain information, the term is highly specific to the domain, and vice versa (Ryu & Choi, 2005). Be-cause highly specific terms tend to locate in low level in domain taxonomy, term specificity can be used as a necessary condition for taxonomy learning. Term similarity is degree of semantic overlap among terms. When two terms share many common characteristics, they are semanti-cally similar to each other. Term similarity can be another necessary condition for taxonomy learning, because semantically similar terms lo-cate near by in given domain taxonomy. The two conditions are generally valid for terms in a taxo-nomic relation, while terms satisfying the condi-tions do not always have taxonomic relation. So they are necessary conditions for taxonomy learning.
Based on these conditions, it is highly prob-able that term t1 is an ancestor of term t2 in
do-main taxonomy TD, when t1 and t2 are
semanti-cally similar enough and the specificity of t1 is
lower than that of t2 in D as in Figure 1. However,
speci-ficity of t1 is lower than that of t3 because t1 is not
similar to t3 on the semantic level.
t1
t2 t3
Similarity
Specificity
high low
Depth
high low
Figure 1. Term specificity and term similarity in a domain taxonomy TD
The strength of this method lies in its ability to adopt different optimal features for term specific-ity and term similarspecific-ity. Most of current re-searches relied on single feature such as adjec-tives of terms, verb-argument relation, or co-occurrence ratio in documents according to their methods. Firstly, we analyze characteristics of features for taxonomy learning in view of term specificity and term similarity to show that the features embed characteristics of specificity and similarity, and finally apply optimal features to our method.
Additionally we tested inside information of terms to measure term specificity and similarity. As multiword terms cover the larger part of tech-nical terms, lexical components are featuring information representing semantics of terms (Cerbah, 2000).
The remainder of this paper is organized fol-lows. Characteristics of term specificity are de-scribed in Section 2, while term similarity and its features are addressed in Section 3. Our taxon-omy learning method is discussed in Section 4. Experiment and evaluation are discussed in tion 5, and finally, conclusions are drawn in Sec-tion 6.
2
Term Specificity
Specificity is degree of detailed information of an object about given target object. For example, if an encyclopedia contains detailed information about ‘IT domain’, then the encyclopedia is ‘IT
specific encyclopedia’. In this context, specificity
is a function of objects and target object to real number. Traditionally term specificity is widely used in information retrieval systems to weight index terms in documents (S. Jones, 1972; Ai-zawa, 2003; Wong & Yao, 1992). In information retrieval context, term specificity is function of index terms and documents. On the other hand, term specificity is the function of terms and tar-get domains in taxonomy learning context (Ryu & Choi 2005). Term specificity to a domain is
quantified to a positive real number as shown in Eq. (1).
( |
)
Spec t D
∈
R
+ (1)where t is a term, and Spec(t|D) is the specificity of t in a given domain D. We simply use Spec(t) instead of Spec(t|D) assuming a particular do-main D in this paper.
Understanding the relation between domain concepts and their lexicalization methods is needed, before we describe term specificity measuring methods. Domain specific concepts can be distinguished by a set of what we call
‘characteristics’. More specific concepts are
cre-ated by adding characteristics to the set of char-acteristics of existing concepts. Let us consider two concepts: C1 and C2. C1 is an existing
con-cept and C2 is a newly created concept by
com-bining new characteristics to the characteristic set of C1. In this case, C1 is an ancestor of C2
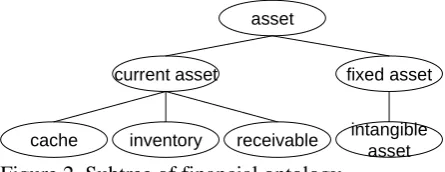
(ISO, 2000). When domain specific concepts are lexicalized as terms, the terms' word-formation is classified into two categories based on the com-position of component words. In the first cate-gory, new terms are created by adding modifiers to existing terms. Figure 2 shows a subtree of financial ontology. For example ‘current asset’ was created by adding the modifier ‘current’ to its hypernym ‘asset’. In this case, inside informa-tion is a good evidence to represent the charac-teristics. In the second category, new terms are created independently of existing terms. For ex-ample, ‘cache’, ‘inventory’, and ‘receivable’ share no common words with their hypernyms
‘current asset’ and ‘asset’. In this case, outside
information is used to differentiate the character-istics of the terms.
asset
current asset fixed asset
cache inventory receivable intangible asset
Figure 2. Subtree of financial ontology
fre-quently modified in text. This feature has been discussed to measure specificity of nouns in (Caraballo, 1999; Ryu & Choi, 2005) and to build taxonomy of Japanese nouns (Yamamoto et al., 2005). Inversed specificity of a term can be measured by entropy of adjectives as shown Eq. (2).
1
( ) ( | ) log ( | )
adj
adj
Spec t − = −
∑
P adj t P adj t (2)where P(adj|t), the probability that adj modifies t, is estimated as freq(adj,t)/freq(t). The entropy is the average information quantity of all (adj,t) pairs for term t. Specific terms have low entropy, because their adjective distributions are simple.
For verb-argument distribution, we assume that domain specific terms co-occur with selected verbs which represent special characteristics of terms while general terms are associated with multiple verbs. Under this assumption, we make use of syntactic dependencies between verbs ap-pearing in the corpus and their arguments such as subjects and objects. For example, ‘inventory’1, in Figure 2, shows a tendency to be objects of specific verbs like ‘increase’ and ‘reduce’. This feature was used in (Cimiano et al., 2005) to learn concept hierarchy. Inversed specificity of a term can be measured by entropy of verb-argument relations as Eq. (3).
1
( ) ( | ) log ( | )
arg
arg
v arg arg
v
Spec t − = −
∑
P t v P t v (3)where P(t|varg), the probability that t is argument of varg, is estimated as freq(t,varg)/freq(varg). The entropy is the average information quantity of all (t,varg) pairs for term t.
Conditional probability of term co-occurrence in documents was used in (Sanderson & Croft, 1999) to build term taxonomy. This statistics is based on the assumption that, for two terms, ti
and tj, ti is said to subsume tj if the following two
conditions hold,
P(ti|tj) = 1 and P(tj|ti)<1 (4)
In other words, ti subsumes tj if the documents
which tj occurs in are a subset of the documents
which ti occurs in, therefore ti can be parent of tj
in taxonomy. Although a good number of term pairs are found that adhere to the two
1 ‘Inventory’ consists of a list of goods and materials held
available in stock (http://en.wikipedia.org/wiki/Inventory).
tion conditions, it is noticed that many are just failing to be included because a few occurrences of the subsumed term, tj, does not co-occur with
ti. Subsequently, the conditions are relaxed and
subsume function is defined as Eq. (5). In case of
P(ti|tj)>P(tj|ti), subsume(ti,tj) returns 1, otherwise
returns 0.
1 if ( | ) ( | ) ( , )
0 otherwise
i j j i
i j
P t t P t t subsume t t = ⎨⎧ >
⎩ (5)
We apply this function to calculate term speci-ficity as shown Eq. (6) where a term is specific when it is subsumed by most of other terms. Specificity of t is determined by the ratio of terms that subsume t over all co-occurring terms.
1 ( , )
( ) j n j
coldoc
subsume t t
Spec t
n ≤ ≤
=
∑
(6)where n is number of terms co-occurring terms with t.
Finally, inside-word information is important to compute specificity for multiword terms. Con-sider a term t that consists of two words like t =
w1w2. Two words, w1 and w2, have their unique characteristics and the characteristics are summed up to the characteristic of t. Mutual in-formation is used to estimate the association be-tween a term and its component words. Let
T={t1,…,tN} be a set of terms found in a corpus, and W={w1,…,wM} be a set of component words composing the terms in T. Assume a joint prob-ability distribution P(ti,wj), probability of wj is a component of ti, is given for ti and wj. Mutual information between ti and wj compares the prob-ability of observing ti and wj together and the probability of observing ti and wj independently. The mutual information represents the reduction of uncertainty about ti when wj is observed. The summed mutual information between ti and W, as in Eq. (7), is total reduction of uncertainty about
ti when all component words are observed.
( , ) ( ) log
( ) ( )
j
i j
in i
w W i j
P t w Spec t
P t P w ∈
=
∑
(7)compared with ‘bond’ to ‘debenture bond’ or
‘financial’, ‘product’ to ‘financial product’.
3
Term Similarity
We evaluate four statistical and lexical features, related to taxonomy learning, in view of term similarity. Three statistical features have been used in existing taxonomy learning researches.
(Sanderson & Croft, 1999) used conditional probability of co-occurring terms in same docu-ment in taxonomy learning process as shown in Eq. (4). This feature can be used to measure similarity of terms. If two terms co-occur in common documents, they are semantically simi-lar to each other. Based on this assumption, we can calculate term similarity by comparing the frequency of co-occurring ti and tj together and
(Yamamoto et al., 2005) used adjective pat-terns to make characteristics vectors for terms in Complementary Similarity Measure (CSM). Al-though CSM was initially designed to extract superordinate-subordinate relations, it is a simi-larity measure by itself. They proposed two CSM measures; one is for binary images in which val-ues in feature vectors are 0 or 1, and the other is for gray-scale images in which values in feature vectors are 0 through 1. We adapt gray-scale measure in similarity calculation, because it showed better performance in their research.
(Cimiano et al., 2005) applied Formal Concept Analysis (FCA) to extract taxonomies from a text corpus. They modeled the context of a term as a vector representing syntactic dependencies. Similarity based on verb-argument dependencies is calculated using cosine measure as Eq. (9).
2 2 Above three similarity measures are valid when
terms, ti and tj, appear in corpus one or more times.
The last similarity measure is based on inside information of terms. Because many domain terms are multiword terms, component words are clues for term similarity. If two terms share many common words, they share common char-acteristics in given domain. For example, four words ‘asset’, ‘current asset’, ‘fixed asset’ and
‘intangible asset’ share characteristics related to
‘asset’ as in Figure 2. This similarity measure is
shown in Eq. (10). most of term pairs, it is difficult to catch reliable results for all possible term pairs.
4
Taxonomy Learning Process
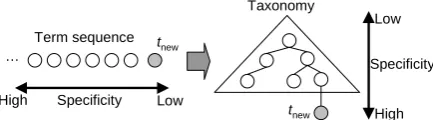
We model taxonomy learning process as a se-quential insertion of new terms to current taxon-omy. New taxonomy starts with empty state, and changes to rich taxonomic structure with the re-peated insertion of terms as depicted in Figure 3. Terms to be inserted are sorted by term specific-ity values. Term insertion based on the increas-ing order of term specificity is natural, because the taxonomy grows from top to down with term insertion process in increasing specificity se-quence.
Figure 3. Terms are inserted to taxonomy in the sequence of specificity
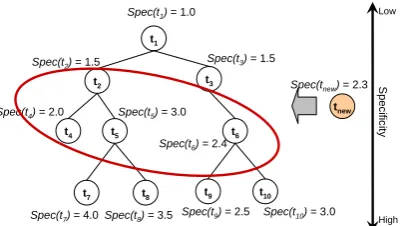
According to above assumption, our system selects possible hypernyms of a new term, tnew in
current taxonomy as following steps:
• Step 1: Select n-most similar terms to tnew
from current taxonomy
• Step 2: Select candidate hypernyms of tnew
• Step 3: Insert tnew as hyponyms of candidate
hypernyms
For example, suppose t2, t4, t5 and t6, are four
most similar terms to tnew in Figure 4. Two terms
t2 and t4 are selected as candidate hypernyms of
tnew, because specificity of the terms is less than
specificity of tnew.
Figure 4. Selection of candidate hypernyms of
tnew from taxonomy using term specificity and
similarity
5
Experiment and Evaluation
We applied our taxonomy learning method to set of terms in existing taxonomy. We removed all relations from the taxonomy, and made new taxonomic relations among the terms. The learned taxonomy was then compared to original taxonomy. Our experiment is composed of four steps. Firstly, we calculated term specificity us-ing specificity measures discussed in chapter 2, secondly, we calculated term similarity using similarity measures described in chapter 3, thirdly, we applied the best specificity and simi-larity features to our taxonomy building process, and finally, we evaluated our method and com-pared with other taxonomy learning methods.
Finance ontology 2 which was developed within the GETESS project (Staab et al., 1999) was used in our experiment. We slightly modi-fied original ontology. We unimodi-fied different ex-pressions of same concept to identical expression. For example, 'cd-rom drive' and 'cdrom drive' are unified as 'cd-rom drive' because the former is more usual expression than the latter. We also removed terms that are not descendents of 'root' node to make the taxonomy have single root node. The taxonomy consists of total 1,819 nodes and 1,130 distinct nodes. Maximum and average depths are 15 and 5.5 respectively, and
2
The ontology can be downloaded at http://www.aifb.uni-karlsruhe.de/WBS/pci/FinanceGoldStandard.isa. P. Cimiano and his colleagues added English labels for the originally German labeled nodes (Cimiano et al., 2005)
maximum and average children nodes are 32 and 3.5 respectively.
We considered Reuters215783 corpus, over 3.1 million words in title and body fields. We parsed the corpus using Connexor functional depend-ency parser4 and extracted various statistics: term frequency, distribution of adjectives, distribution of co-occurring frequency in documents, and verb-argument distribution.
5.1 Term Specificity
Term specificity was evaluated based on three criteria: recall, precision and F-measure. Recall is the fraction of the terms that have specificity values by the given measuring method. Precision is the fraction of relations with correct specificity values. F-measure is a harmonic mean of preci-sion and recall into a single measure of overall performance. Precision (Pspec), recall (Rspec), F-measure (Fspec) is defined as follows:
#
of R p c with correct specificity P original taxonomy, and a relation is valid when the specificity of two terms are measured by the given method. If the specificity of child term, c, is larger than that of parent term, p, then the rela-tion is correct.
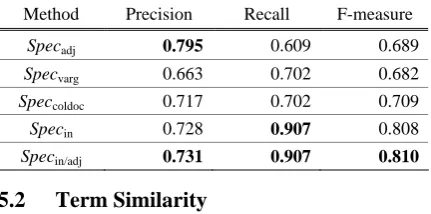
We tested four specificity measuring methods discussed in section 2 and the result is shown in Table 1. Specadj showed the highest precision as
we anticipated. Because domain specific terms have sufficient information in themselves; they are rarely modified by other words in real text. However, Specadj showed the lowest recall for
data sparseness problem. As mentioned above, it is hard to collect sufficient adjectives for domain specific terms from text. Specvarg showed the
lowest precision. This result indicates that distri-bution of verb-argument relation is less corre-lated to term specificity. Specin showed the
high-est recall because it measures term specificity using component words contrary to other meth-ods. Speccoldoc showed comparable precision and
We harmonized Specin and Specadj to Specin/adj
as described in (Ryu & Choi, 2005) to take ad-vantages of both inside and outside information. Harmonic mean of two specificity values was used in Specin/adj method. Specin/adj showed the
highest F-measure because precision was higher than that of Specin and recall was equal to that of
Specin.
Table 1. Precision, recall and F-measure for term specificity
Method Precision Recall F-measure
Specadj 0.795 0.609 0.689
Specvarg 0.663 0.702 0.682
Speccoldoc 0.717 0.702 0.709
Specin 0.728 0.907 0.808
Specin/adj 0.731 0.907 0.810
5.2 Term Similarity
We evaluated similarity measures by comparing with taxonomy based similarity measure. (Bu-danitsky & Hirst, 2006) calculated correlation coefficients (CC) between human similarity rat-ings and the five WordNet based similarity measures. Among the five computational meas-ures, (Leacock & Chodorow, 1998)’s method showed the highest correlation coefficients, even though all of the measures showed similar rang-ing from 0.74 to 0.85. This result means that tax-onomy based similarity is highly correlated to human similarity ratings. We can indirectly evaluate our similarity measures by comparing to taxonomy based similarity measure, instead of direct comparison to human rating. If applied similarity measure is qualified, the calculated similarity will be highly correlated to taxonomy based similarity. Leacock and Chodorow pro-posed following formula for computing the scaled semantic similarity between terms t1 and t2
in taxonomy.
1 2 1 2
( , ) ( , ) log
2 max ( )
LC
t Taxonomy
len t t Sim t t
depth t ∈
= −
× (12)
where the denominator includes the maximum depth of given taxonomy, and len(t1, t2) is
num-ber of edges in the shortest path between word t1
and t2 in the taxonomy.
Besides CC with ontology based similarity measures, recall of a similarity measures is also important evaluation factor. We defined recall of similarity measure, RSim, as the fraction of the
term pairs that have similarity values by the given measuring method as Eq. (13).
# #
Sim
similarity measured term pairs R
all possible term pairs
= (13)
We also defined F-measure for a similarity measure, Fsim, as harmonic means of CC and Rsim.
Because CC is a kind of precision, Fsim is overall
measure of precision and recall.
We calculated term similarity between all pos-sible term pairs in finance ontology using the measures described in section 3. Additionally we introduced new similarity measure Simin/varg
which is combined similarity of Simvarg and Simin.
Simvarg and Simin between two terms are
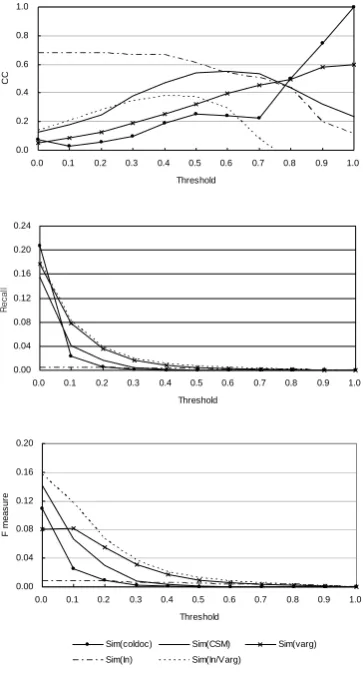
harmo-nized to Simin/varg. We also calculated SimLC based on finance ontology, and calculated CC between SimLC and results of other measures. Figure 5 shows variation of CC and recall as threshold of similarity changes from 0.0 to 1.0 for five similarity measures. Threshold is directly proportional to CC and inversely proportional to recall in ideal case. We normalized all similarity values to [0.0, 1.0] in each measure. CC grows as threshold increases in Simcoldoc and Simvarg as we
expected. CC of CSM measure, Simcsm, increased
as threshold increased and decreased when threshold is over 0.6. For example two terms ‘ as-set’ and ‘current asset’ are very similar to each other based on SimLC measure, because edge count between two terms is one in finance ontol-ogy. The former can be modified many adjec-tives such as ‘intangible’, ‘tangible’, ‘new’ and
‘estimated’, while the latter is rarely modified by
other adjectives in corpus because it was already extended from ‘asset’ by adding adjective ‘ cur-rent’. Therefore, semantically similar terms do not always have similar adjective distributions. CC between Simin and SimLC showed high curve in low threshold, but downed as threshold in-creased. Similarity value above 0.6 is insignifi-cant, because it is hard to be over 0.6 using Eq. (10). For example, similarity between ‘executive
board meeting’ and ‘board meeting’ is 0.8, the
maximum similarity in our test set. The average of inside-word similarity is 0.41.
Simvarg showed higher recall than other
meas-ures. This means that verb-argument relation is more abundant than other features in corpus.
SimIn showed the lowest recall because we could
get valid similarity using Eq. (10). Simvarg
The combined similarity measure, Simin/varg,
complement shortcomings of SimIn and Simvarg.
SimIn showed high CC but low recall. Contrarily
Simvarg showed lowCC but high recall. Simin/varg
showed the highest F-measure.
5.3 Taxonomy learning
In order to evaluate our approach we need to as-sess how good the automatically learned tax-onomies reflect a given domain. The goodness is evaluated by the similarity of automatically learned taxonomy to reference taxonomy. We used (Cimiano et al., 2005)’s ontology evaluation method in which lexical recall (LRTax), precision
(PTax) and F-measure (FTax) of learned taxonomy
are defined based on the notion of taxonomy overlap. LRTax is defined as the ratio of number
of common terms in learned taxonomy and ence taxonomy over number of terms in refer-ence taxonomy. PTax is defined as ratio of
taxon-omy overlap of learned taxontaxon-omy to reference taxonomy. FTax is harmonic mean of LRTax and
Figure 5 Correlation coefficient between SimLC and other similarity measures. Recall and F-measure of similarity F-measures
We generated four taxonomies, Tcoldoc, Tcsm,
Tfca, Tspec/sim, using four taxonomy learning
meth-ods: term co-occurring method, CSM method, FCA method and our method. We applied Spe-cin/adj in specificity measuring and Simin/varg in
similarity calculation because they showed the highest F-measure. In our method, the most probable one term was selected as hypernym of newly inserted term in each learning step.
Figure 6 shows variations of lexical recall, precision and F-measure of four methods as threshold changes. Threshold in each method represent different information to each other. Threshold in Tcsm is variation of CSM values.
Threshold in Tcoldoc is variation of probability of
two terms co-occur in a document. Threshold in
Tfca is normalized frequency of contexts.
Thresh-old in Tspec/sim, is variation of similarity.
Tspec/sim showed the highest lexical recall.
Lexical recall is tightly related to recall in simi-larity measures. Simin/varg showed the highest
re-call in similarity measures. Tfca and Tcsm showed
higher precision than other taxonomies. It is as-sumed that precision of taxonomy depends on
the precision of specificity measures and the CC of similarity measures. In actual case, Simvarg
showed the most plausible curve in CC and Spe-cadj showed the highest precision in specificity.
Verb-argument relation and adjective-term rela-tion are used in FCA and CSM methods respec-tively. Tspec/sim and Tcoldoc showed higher
F-measure curve than other two taxonomies due to high lexical recall. Although our method showed plausible F-measure, it showed the lowest preci-sion. So other combination of similarity and specificity measures are needed to improve pre-cision of learned taxonomy.
6
Conclusion
We have presented new taxonomy learning method with term similarity and specificity taken from domain-specific corpus. It can be applied to different domains as it is; and, if we have a syn-tactic parser available, to different languages. We analyzed the features used in previous researches in view of term specificity and similarity. In this analysis, we found that the features embed the characteristics of both conditions.
Compared to previous approaches, our method has advantages in that we can use different fea-tures for term specificity and similarity. It makes easy to analyze errors in taxonomy learning step, whether the wrong relations are caused by speci-ficity errors or by similarity errors. The main drawback of our method, as it is now, is that the effect of wrong located terms in upper level propagates to lower levels.
Until now, researches on automatic ontology learning especially taxonomic relation showed very low precision. Human experts’ intervention is inevitable in automatic learning process to make applicable taxonomy. Future work is to make new model where human experts and sys-tem work interactively in ontology learning process in order to balance cost and precision.
Reference
S. Caraballo, E. Charniak. 1999. Determining the Specificity of Nouns from Text. Proceedings of the 1999 Joint SIGDAT Conference on Empirical Methods in Natural Language Processing and Very Large Corpora, pp. 63-70
P. Cimiano, A. Hotho, S.Staab. 2005. Learning Con-cept Hierarchies from Text Corpora using Formal Concept Analysis. Journal of AI Research, Vol. 24, pp. 305-339
M. Hearst. 1992. Automatic Acquisition of Hypo-nyms from Large Text Corpora. Proceedings of the
14th International Conference on Computational Linguistics
L. Iwanska, N. Mata and K. Kruger. 2000. Fully automatic acquisition of taxonomic knowledge from large corpora of texts. In Iwanska, L. & Shapiro, S. (Eds.), Natural Language Processing and Knowledge Processing, pp. 335-345, MIT/AAAI Press.
E. Yamamoto, K. Kanzaki and H. Isahara. 2005. Ex-traction of Hierarchies Based on Inclusion of Co-occurring Words with Frequency Information. Proceedings of 9th International Joint Conference on Artificial Intelligence, pp. 1160-1167
A. Burgun, O. Bodenreider. 2001. Aspects of the Taxonomic Relation in the Biomedical Domain, Proceedings of International Conference on For-mal Ontology in Information Systems, pp. 222-233
Mark Sanderson and Bruce Croft. 1999. Deriving concept hierarchies from text. Proceedings of the 22th Annual ACM S1GIR Conference on Research and Development in Information Retrieval, pp. 206-213, 1999
Karen Sparck Jones. 1972. Exhausitivity and Speci-ficity Journal of Documentation Vol. 28, Num. 1, pp. 11-21
S.K.M. Wong, Y.Y. Yao. 1992. An Information-Theoretic Measure of Term Specificity, Journal of the American Society for Information Science, Vol. 43, Num. 1. pp.54-61
ISO 704. 2000. Terminology work-Principle and methods. ISO 704 Second Edition
A. Aizawa. 2003. An information-theoretic perspec-tive of tf-idf measures. Journal of Information Processing and Management, vol. 39
Alexander Budanitsky, Graeme Hirst. 2006 Evaluat-ing WordNet-based Measures of Lexical Semantic Relatedness. Computational Linguistics. Vol. 32 NO. 1, pp. 13-47(35)
Claudia Leacock, Martin Chodorow. 1998. Combin-ing local context and WordNet similarity for word sense identification. In Christian Fellbaum, editor, WordNet: An Electronic Lexical Database. The MIT Press, pp. 265-283
Pum-Mo Ryu, Key-Sun Choi. 2005. An Information-Theoretic Approach to Taxonomy Extraction for Ontology Learning, In P. Buitelaar et al. (eds.), On-tology Learning from Text: Methods, Evaluation and Applications, Vol. 123, Frontiers in Artificial Intelligence and Applications, IOS Press