Building RDF Content for Data-to-Text Generation
Laura Perez-Beltrachini CNRS/LORIA Nancy (France) [email protected]
Rania Mohamed Sayed Universit´e de Lorraine
Nancy (France) [email protected]
Claire Gardent CNRS/LORIA Nancy (France) [email protected]
Abstract
In Natural Language Generation (NLG), one important limitation is the lack of common bench-marks on which to train, evaluate and compare data-to-text generators. In this paper, we make one step in that direction and introduce a method for automatically creating an arbitrary large repertoire of data units that could serve as input for generation. Using both automated metrics and a human evaluation, we show that the data units produced by our method are both diverse and coherent.
1 Introduction
In Natural Language Generation, one important limitation is the lack of common benchmarks on which to train, evaluate and compare data-to-text generators. In this paper, we make one step in that direction and introduce a method to automatically create an arbitrary large repertoire of data units which could serve as input for data-to-text generation. We focus on generation from RDFS data where the communicative goal is to describe entities of various categories (e.g., astronauts or monuments).
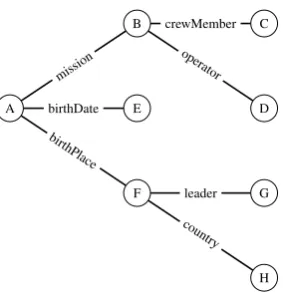
RDF data consists of (subject property object) triples (e.g., (Alan Bean occupation Test pilot)) – as illustrated in Figure 1, RDF data can be represented by a graph in which edges are labelled with properties and vertices with subject and object resources. To construct a corpus of RDF data units which could serve as input for NLG, we introduce a content selection method which, given some DBPedia entity, retrieves DBPedia subgraphs that encode relevant and coherent knowledge about that entity.
Our approach differs from previous work on content selection in that it leverages the categorial infor-mation provided by large scale knowledge bases about entities of a given ontological type. Based on this ontological knowledge, we learn two types of category-specific bigram models: one model (S-Model) for bigrams occurring in sibling triples (triples with a share subject) and one model (C-Model) for bigrams
occurring in chained triples (the object of one triple is the subject of the other). The intuition is that these two models capture different types of coherence, namely, topic-based coherence for theS-Model and discourse-based coherence for theC-Model.
Using these bigram models of RDF properties, we formulate the content selection task as an Inte-ger Linear Programming problem and select for a given entity of categoryC, subgraphs with maximal probability that is, subgraphs which contain properties that are true of that entity, that are typical of that category and that support the generation of a coherent text.
We evaluate the impact of our n-gram models on content selection (how well do they help support the selection of a coherent and diverse set of data units?) using quantitative metrics, a human evaluation and a qualitative analysis.
2 Related Work
Our approach has similarity with approaches on entity summarisation, content planning from DBpe-dia data and ILP (Integer Linear Programming) approaches for content planning. There is also a vast literature on using ILP for natural language processing.
Entity Summarisation (Cheng et al., 2015) presents an approach which focuses on a task very similar to ours, namely the task of selecting, for a given entitye, a subgraph of the knowledge graph whose root ise. The goal is to generate entity summaries that is, sets of facts which adequately summarise a given entity. The method used extends a standard random surfer model navigating the knowledge graph based on metrics indicating (i) the informativeness of a fact and (ii) the relatedness between two facts. In this way, the selected subgraphs are both coherent (solutions which maximise relatedness are preferred) and informative (facts that helps distinguishing the entity to be summarised from others are preferred).
We depart from (Cheng et al., 2015) both in terms of goals and of methods.
In terms of goals, while (Cheng et al., 2015) aim to produce entity summaries, our goal is to produce a large set of content units that are varied both in terms of content and in terms of structure. In particular, one important difference is that we produce trees of varying shapes and depths while the graphs produced by (Cheng et al., 2015) are restricted to trees of depth one i.e., set of DBpedia triples whose subject is the entity to be described. As discussed in Section 5.1, this allows us to produce knowledge trees which, because they vary in shape, will give rise to different linguistic structures and will therefore better support the creation of a linguistically varied benchmark for Natural Language Generation.
Our approach also departs from (Cheng et al., 2015)’s in that the methods used are very different. While we use Integer Linear Programming and language models to select DBpedia subgraphs that are both discourse- and topic-coherent, (Cheng et al., 2015) use a random surfer model, pointwise mutual information and probabilistic estimates to measure relatedness and informativeness. Generally, the two methods are complementary using different resources, algorithms and metrics thereby opening interest-ing possibilities for combination. It would be interestinterest-ing for instance, to investigate how modifyinterest-ing our ILP formulation to integrate the relatedness metrics used by (Cheng et al., 2015) would impact results. Content Planning (Biran and McKeown, 2015) describes a discourse planning approach applied to the generation of comparison stories from DBpedia data. Given two DBpedia entitye1ande2, they first select all DBpedia triples whose subject is either e1 ore2. Based on the shape of the triples (shared entities or predicates) and on the property they include, they then enrich this set of DBpedia triples with discourse relations. For instance, if two triples share the same predicate and object, an expansion relation is added between the two triples (e.g., “John has a ball. Mary also has a ball”). Discourse planning then consists in finding a path through the resulting multigraphs of potential relations between DBpedia triples using an bigram model over discourse relations. Good discourse plans are those which maximise the probability of a sequence of discourse relations. In this way, the proposed approach determines both the order of the events and the discourse relation holding between them.
(Lampouras and Androutsopoulos, 2013) present an Integer Linear Programming model of content selection, lexicalisation and aggregation for generating text from OWL ontologies. The objective func-tion used in their ILP model maximises the total importance of selected facts and minimizes the number of distinct elements mentioned in each sentence thereby favouring aggregated sentences i.e., sentences where repeated elements are avoided through e.g., ellipsis or coordination.
(Bouayad-Agha et al., 2011) introduces an ontology driven content selection procedure in which a base domain ontology is used to infer new facts. For instance, given the numerical scores of two teams playing in the same game, a result event will be inferred between the winner and the loser and a causal relation will be inferred between the number of goals of a given team and this result event. Content selection proceeds in three steps. First, a set of hand written rules is used to select a subset of the knowledge base. Second, relevance scores learned from a parallel data/text corpus are used to select the most relevant individual and relation instances. Third, hand-written templates are used to determine the content to be included in the generated text.
models. However their approach investigate discourse planning not content selection and relatedly, the basic units of their bigram models are discourse relations rather than triples. Our approach also differs from (Barzilay and Lapata, 2005) in that it is unsupervised and does not require an aligned data-text corpus.
Finally, the work presented here is closely related to a simpler proposal we introduced in (Mohammed et al., 2016). It differs from it in that it defines the notions of chain, sibling and mixed models for n-grams of DBpedia properties; relate them to the notion of topic- and discourse-coherence; and provide a comparative evaluation of their impact on content selection.
Integer Linear Programming and NLP. Finally, there has been much work in recent years on using ILP for natural language processing. In particular, (Kuznetsova et al., 2012) proposes an ILP formulation for the generation of natural image descriptions from visual and text data and (Filippova and Strube, 2008) uses ILP to model sentence compression. The ILP formulation of our content selection method is most similar to that proposed for sentence compression in (Filippova and Strube, 2008). One important difference though is both the application (content selection rather than sentence compression) and the way in which relevance is computed. While (Filippova and Strube, 2008) uses weights derived from a treebank to determine the relative importance of an edge, we use bigram models over DBpedia properties to estimate the relative importance of DBpedia triples.
3 Task and Method
Given an entityeof categoryCand its associated DBpediaentity graphGe, our task is to select a (target) subgraphTeofGesuch that:
• Te isrelevant: the DBpedia properties contained inTeare commonly (directly or indirectly) asso-ciated with entities of typeC
• Te maximises topic-based coherence: DBpedia triples that often co-occur in type C are selected together
• Tesupportsdiscourse coherence: the set of DBpedia triples contained inTe capture a sequence of entity-based transitions which supports the generation of discourse coherent texts i.e., texts such that the propositions they contain are related through shared entities.
To implement these constraints, we first build bigram models of properties for DBpedia categories. We then use these models and Integer Linear Programming to retrieve from DBpedia, entity graphs with maximal probability.
3.1 Building Bigram Models for DBpedia Categories
For each DBpedia categories (e.g., Astronaut or University), we learn two bigram modelsSandC, each
designed to capture different aspects of content coherence.
The S(ibling)-model consists of bigrams that are sibling properties in DBpedia. Two properties
are sibling of each other if they occur in triples sharing the same subject. Thus, the DBpedia graph shown in Figure 1 contains 5 S-bigrams namely, birthPlace-mission, birthDate-mission, birthDate-birthPlace, country-leaderandcrewMember-operator1. TheS-model aims to capture
local coherence i.e., topic-based associations between DBpedia properties.
In contrast to the S-model, theC(hain)-model aims to capture discourse coherence i.e., associations between DBpedia triples that involve a shared entity other than the entity being described. It con-sists of DBpedia triples that are related by a shared entity. The DBpedia graph shown in Figure 1 contains 4 C-bigrams namely, mission-crewMember, mission-operator, birthPlace-country and
birthPlace-leader.
1Sibling bigrams (S-bigrams) are normalised using alphabetical order. Thus, given the two triples(A mission B), (A
A
B C
D E
F G
H mission
crewMember
birthDate
operator
birthPlace
[image:4.595.230.372.58.209.2]leader country
Figure 1: Example DBpedia Graph (To save space subject and object names have been replaced by capital letters).
3.2 Extracting DBpedia Subgraphs
We use the two bigram models just described and an interpolation (M-Model) of these two models to select from an entity graph subtrees whose coherence is either topic-based (S-Model), discourse-based
(C-Model) or both (M-Model).
The ILP formulation of the task is as follows.
Representing triples. Given an entity graph Gefor the DBpedia entityeof categoryC (e.g. Astro-naut), for each triplet= (s, p, o)inGe, we introduce a binary variablexps,osuch that:
xt=xps,o= (
1 if the triple is preserved
0 otherwise
Because we use bigrams to capture local and discourse coherence (properties that often co-occur to-gether), we also have variablesyt1,t2 for bigrams of triples such that:
yt1,t2 = (
1 if the pair of triples is preserved
0 otherwise
For theS-Model, these binary variables capture pairs of triples which share the same subject. That is, for
each bigram of triplest1 = (s1, p1, o1)andt2 = (s2, p2, o2)inGe such thats1 = s2, we introduce a binary variableyt1,t2.
Similarly, for theC-Model, we introduce a binary variableyt1,t2 for each pair of triples such that the
object of one is the subject of the other. That is, (t1, t2) is a C-bigram iff t1 = (s1, p1, o1), t2 = (s2, p2, o2)ando1 =s2.
Maximising Relevance and Coherence. To maximise relevance and coherence, we seek to find a sub-tree of the input graphGewhich maximises theS-bigram probability (S-Model), theC-bigram probability (C-Model) or an interpolation of both (M-Model).
For theS-and theC-Model, we maximise the following objective function over the set of all bigrams
Y from the set of triplesX:
S(X) = PY yti,tj . P(ti, tj) (1)
whereyti,tjis the ILP binary variable for(ti, tj)andP(ti, tj)is the bigram probability for categoryC.
LetBcbe the set of property bigrams occurring in the entity graphs of all DBPedia entities of categoryC. Letcount(b,C) be the number of timeboccurs inBc, then the bigram probabilityP(b)ofbfor category Cis defined as follows:
P(b) = P count(b,C)
bi∈BCcount(bi,C)
For the S-Model, onlyS-bigrams are included in the counts while for the C-Model, onlyC-bigram
counts. For theM-Model, the objective function to be maximised is defined as:
S(X) = γ∗PY yti,tj . P(ti, tj) + (1−γ) P
Zztk,tl . P(tk, tl) (3)
whereyti,tj is restricted toS-bigrams andztk,tltoC-bigrams andγ is a parameter to balance the
contri-bution of local- or discourse- probabilities.
Consistency Constraints. We ensure consistency between the triple and the bigram variables so that if a bigram is selected then so are the corresponding triples (eq. 5). Conversely, eq. 6 requires that if two triplestiandtjare selected then so is the corresponding bigramyti,tj2
∀i, j(yi,j ≤xiandyi,j ≤xj) (5)
yi,j+ (1−xi) + (1−xj)≥1 (6)
Ensuring Discourse Coherence (Tree Shape). Solutions are constrained to be trees by requiring that each object has at most one subject (eq. 7) and all triples are connected (eq. 8).
∀o∈X,X s,p
xp
s,o ≤ 1 (7)
∀o∈X,X s,p
xp
s,o − |X1 |
X
u,p xp
o,u≥ 0 (8)
whereX is the set of triples that occur in the solution (except the root node). This constraint makes sure that ifohas a child then it also has a head.
Restricting the size of the resulting tree. Solutions are constrained to containαtriples:
X
x
xps,o = α (9)
4 Experimental Setup
We test our approach on 3 DBPedia categories chosen to be diverse in that they represent different levels of animacy namely,Monument, UniversityandAstronaut. These provide with different sets of DBPedia properties for the evaluation.
Building bigram models of DBpedia properties. To build the bigram models, we extract from DB-pedia the graphs associated with all entities of those categories up to depth 5 and separately extract
C-bigrams andS-bigrams. Table 1 shows some statistics for these graphs. We build theC-Model and the S-Model using the SRILM toolkit.
Building Entity Graphs. For each of the three categories, we take 5 randomly chosen entities and extract their DBpedia graph up to depth 23. Table 2 shows some statistics for these entities.
2Note that these constraints do not require that every selected triple be part of at least one bigram containing that triple. We
have only recently added this constraint (eq. 4) to further improve topic coherence.
∀i, j s.t. i=t or j=t, xt<=Xyi,j (4)
3It would of course be possible to extract deeper graphs using but this would required building higher order n-gram models
Category Entities Triples Properties
Astronaut 110 1664033 4167
Monument 500 818145 6521
[image:6.595.319.484.60.135.2]University 500 969541 7441
Table 1: Category Graphs
Entity A M U
d1 d2 d1 d2 d1 d2
e1 14 24 13 18 6 20
e2 21 32 20 21 13 21
e3 16 28 7 14 6 10
e4 12 24 6 14 9 16
e5 15 22 4 11 27 34
Table 2: Size in number of triples for each En-tity Graph for each category (A = Astronaut, M = Monument, U = University) and depth (d1 = Depth 1 and d2 = Depth 2).
Selecting Data Units. To ensure that our content selection procedure produces varied data with respect to both form and content, we run the ILP program on entities belonging to three DBPedia categories (Astronaut, University, Monument) and using each of the bigram models (S-Model and C-Model) and
their combination (M-Model). Using different DBPedia categories ensures that the selected data units vary in terms of RDF resources (entities and properties). Using the different bigram models permit producing data units exhibiting different levels of topic- and discourse-coherence. The intuition is that theS-Model will yield data units where topic-based coherence dominates, the C-Model discourse data units emphasizing transition-based, discourse coherence andM-Model data units which display a balance
between topic-based and discourse coherence. We setγ to 0.4 (eq.3), after running several experiments we observed that this weight balanced the solutions favouringC-bigrams which in general have smaller probability values thanS-bigrams.
We run the ILP withα(the number of triples occurring in the solution) ranging from 3 to 10 and input entity graphs with depth 1 and 2.
5 Evaluation
Our goal is to generate a large corpus of data units which could be used as a basis to build a data-to-text benchmark for training, testing and comparing data-to-text generators. In the evaluation, we therefore focus on assessing (i) the diversity and (ii) the coherence of the selected data units.
5.1 Diversity
As discussed in the preceding sections, the three ILP models generate solutions with slightly different properties. This can be viewed as a controlledsamplingprocedure. Using the different ILP models, we can sample subgraphs of the same entity graph which have the same size but are markedly distinct.
To better assess the degree to which the solutions generated by our models differ from each other, we compute two metrics designed to capture both the overlap between the solutions produced and the number of distinct shapes found.
Number of Distinct Solution Shapes. The shape of the trees extracted from an entity graph will impact the possible syntactic structure of the corresponding text. For instance, trees such as (1a) where the subject entity is shared by two triples, will naturally induce the use of an adjective modifier (1b). In contrast, trees such as (1d) where the object entity of a triple is the subject of another triple naturally suggests the use of a participial or a relative clause (1d-e).
(1) a. (Alan Bean occupation Test pilot) (Alan Bean nationality USA)
b. Alan Bean was anAmericantest pilot
c. (Alan Bean mission Apollo 12) (Apollo 12 operator NASA)
d. Alan Bean flew on the Apollo 12 missionoperated byNASA
e. Alan Bean flew on the Apollo 12 missionwhich was operated byNASA
Oeof subject entitiese0 ∈Ueother thaneand (iii) the numberIeof triplest∈Uewhose subject is not e. That is, an input shape is defined as a triple(De, Oe, Ie)indicating the numberDeof triples directly connected to the entityebeing described, the numberOeof subject entities other than this entity and the numberIeof triples indirectly connected toe.
When considering the 10 best solutions produced by theM-Model on the entity graphs of the 15 entities
mentioned above, the total number of distinct input shapes is 75 with a minimum, a maximum and an average number of instances per input shape of 1, 24 and 5.31 respectively.
Overlap. To assess the degree to which the solutions produced by our approach differ from each other we compute the average overlap between solutions for the same configuration both within and across models. A configuration is defined by the number of triples appearing (3 to 10) in the solution, the depth of the input graph (1 or 2) and the model used (S-Model,C-Model orM-Model). For each configuration,
the average overlap is defined as Pi,jO(si,sj)
N wheresi, sj are solutions produced in that configuration, N is the number of distinct pairs produced by that configuration and the overlap,O(si, sj), between two solutions is the ratio between the number of property they share and the number of triples contained in
(si, sj)4.
Table 6 (left) shows the results for the three models given 16 configurations and 3 DBpedia categories. The 16 configurations correspond to solutions of size 3 to 10 on graphs of depth 1 and 2.
With an average overlap within and across models ranging from 0.18 to 0.31, these results indicate a good level of diversity whereby theC-Model and theM-Model are found to be slightly better at providing
solutions with small overlap (avg. 0.24 and 0.26 respectively) than theS-Model (avg. 0.31).
Similarly, Table 6 (right) shows that the overlap across models is relatively low (Min: 0.18, Max: 0.24) indicating that solutions produced for the same configuration by different models are usually markedly distinct (no more than a quarter or a small half of the triples are shared between any two solutions).
In sum, by modifying the ILP parameters to select various numbers of triples, we can generate solu-tions of different sizes whilst the 3 ILP models permit producing solusolu-tions with relatively small overlap both within and across models. That is, our content selection method can be used to automatically create a graduated benchmark for natural language generation in which the inputs are of increasing size and exhibit a good level of semantic variability. Using crowdsourcing, these RDF input could be associated with appropriate verbalisations whereby annotators could be gradually trained to verbalise the data by exposing them to input of gradually increasing length.
5.2 Coherence
Because they are retrieved from DBpedia, the data units selected by our approach are semantically co-herent overall. In particular, the triples that are directly connected to the entity being described are all relevant. However when selecting a subtree of the input entity graph, the coherence between siblings and between chained triples may decrease. For instance, given the entity graph shown in Figure 1, subgraph (2a) is more topically-coherent that subgraph (2b). Similarly, subgraph (2c) is more discourse-coherent that subgraph (2d).
(2) a. (A birthDate E) (A birthPlace F)
b. (A birthDate E) (A mission B)
c. (A mission B) (B crewMember C)
d. (A birthPlace F) (F leader G)
We compare our approach with a baseline where a subtree of DBpedia triples is randomly selected from the entity graph using an automatic metric and a human evaluation.
4Since theS-Model is designed to favour sibling or topically related triples but not triples related by a shared entity, we
Min Max Avg # Solns d1 S-ModelBL 00 1.752 0.440.31 400271
d2
BL 0 2 0.73 218
C-Model 0 1.94 0.59 382
M-Model 0 1.25 0.43 152
[image:8.595.79.270.62.134.2]S-Model 0.07 1.29 0.54 123
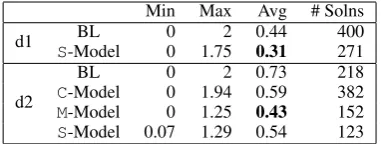
Table 3: Averaged number of irrelevant prop-erty descriptions for solutions of depth 1 (d1) and 2 (d2) on the Astronaut category.
BL S-Model C-Model M-Model
C (3) 6 18 1 2
M (2) 15 11 20 13
L (1) 10 2 9 15
[image:8.595.319.541.62.135.2]Avg 1.87 2.52 2.27 2.43
Table 4: Coherence scores for the different models (C = Coherent, M = Medium, L = Less coherent).
Number of Irrelevant Triples. We quantify the number of irrelevant triples contained in solutions pro-duced by the different models by first, manually labelling each property present in the Astronaut graph as relevant or irrelevant and second, counting the number of irrelevant properties occurring in the solutions produced by the baseline and the 3 ILP models. In practice, irrelevant properties are properties that are indirectly related to the entity being described. For instance, theleaderproperty shown in Figure 1 is
much less relevant when describing an astronaut than thecrewMemberor themissionproperty.
Table 3 shows the results. The baseline consistently shows a higher number of irrelevant properties indicating that our method is efficient in filtering them out. For depth 2, the M-Model shows the best
results. The lower score (higher number of irrelevant properties) of the S-Model shows that selecting
triples based on sibling bigrams only, fails to eliminate indirectly related triples which are irrelevant to the entity being described. Sibling properties are selected for entities related to the entity being described which are not relevant in context. For instance, in Figure 1, the S-bigramleader-country has little
relevance when describing the target entity A. For the C-Model, examination of the distribution per solution size shows that the number of irrelevant properties increases with the solution size. This is explained by the fact that as the number of triples in the solution increases, the number ofC-bigrams to be
selected increases leading to the selection of bigrams (e.g.,birthPlace-leader) with lower probability. Human Evaluation. Using the Crowdflower platform, we ran a human evaluation to compare the coherence of the solutions produced by the different models. The annotators were shown two data units of the same size but produced by different content selection models and were asked to rate the coherence of each dataset as coherent (3), medium (2) or less coherent (1).
To assess the impact of the S-Model on topic-based coherence, we compared theS-Model with the
baseline. The evaluation was carried out on 23 pairs of data units ranging from size 3 to 10 and de-scribing entities of all three categories. We collected 10 judgements for each pair (230 judgements total). Similarly, we compare theM-Model and theC-Model to assess the extent to which theM-Model is
success-ful in combining discourse- and topic-based coherence. Table 4 summarises the results. For all models, the scores are much higher than for the baseline indicating that the bigrams we learn successfully model coherence. TheS-Model has the highest coherence, which is unsurprising as only graphs of depth 1 are
considered and properties that are directly related to the entity being described are by definition rele-vant. TheC-Model andM-Model also achieve relatively high scores thereby confirming the good results obtained with the other metrics (number of irrelevant properties)5.
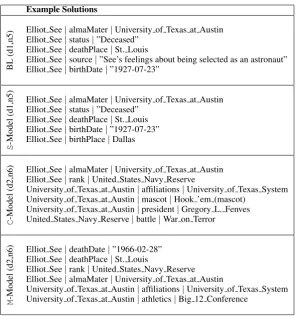
Qualitative Analysis. Table 5 shows some example output produced by the variants of our model which illustrate the main differences between the baseline and the three ILP models.
The baseline model tends to generate solutions with little cohesion between triples. Facts are enumer-ated which range over distinct topics. BL solutions also often include properties such as “source” which are generic rather than specific to the type of entity being described.
In contrast, S-Model solutions often contain sets of topically related properties (e.g., birth date and
birth place) whileC-Model solutions enumerate facts (affiliations, mascot, president, battle) about related
5The average confidence score produced by Crowdflower for the ratings is 0.63. Running a Fisher's exact test we obtain
Example Solutions
BL
(d1,n5)
Elliot See|almaMater|University of Texas at Austin Elliot See|status|”Deceased”
Elliot See|deathPlace|St. Louis
Elliot See|source|”See’s feelings about being selected as an astronaut” Elliot See|birthDate|”1927-07-23”
S
-Model
(d1,n5)
Elliot See|almaMater|University of Texas at Austin Elliot See|status|”Deceased”
Elliot See|deathPlace|St. Louis Elliot See|birthDate|”1927-07-23” Elliot See|birthPlace|Dallas
C
-Model
(d2,n6)
Elliot See|almaMater|University of Texas at Austin Elliot See|rank|United States Navy Reserve
University of Texas at Austin|affiliations|University of Texas System University of Texas at Austin|mascot|Hook ’em (mascot)
University of Texas at Austin|president|Gregory L. Fenves United States Navy Reserve|battle|War on Terror
M
-Model
(d2,n6)
Elliot See|deathDate|”1966-02-28” Elliot See|deathPlace|St. Louis
Elliot See|rank|United States Navy Reserve Elliot See|almaMater|University of Texas at Austin
[image:9.595.151.448.58.375.2]University of Texas at Austin|affiliations|University of Texas System University of Texas at Austin|athletics|Big 12 Conference
Table 5: Example content selections for the Astronaut entity Elliot See.
entities (University of Texas, Austin and United States Navy Reserve). The M-Model lies in between,
producing solutions that include both information about related entities and topic-grouped (death date, death place) facts about the entity being described.
Depth 1 Depth 2
S-Model C-Model M-Model
n3 0.18 0.16 0.24
n4 0.29 0.21 0.35
n5 0.29 0.23 0.27
n6 0.27 0.23 0.23
n7 0.34 0.25 0.27
n8 0.36 0.26 0.24
n9 0.34 0.27 0.25
n10 0.39 0.30 0.25
Avg. 0.31 0.24 0.26
Depth 2 Depth1 vs. Depth 2 C-Model S-Model S-Model M-Model C-Model M-Model
n3 0.21 0.10 0.12
n4 0.25 0.15 0.19
n5 0.25 0.16 0.19
n6 0.23 0.17 0.21
n7 0.25 0.19 0.25
n8 0.26 0.20 0.23
n9 0.26 0.21 0.22
n10 0.25 0.27 0.20
Avg. 0.24 0.18 0.20
Table 6: Quantifying the overlap between solutions (left) and between models (right).
6 Conclusion
[image:9.595.92.461.469.590.2]We are currently working on exploiting this content selection procedure to semi-automatically con-struct a large data-to-text resource for training and testing RDF verbalisers. To associate the RDF subtrees we produce with the verbalisations required by supervised learning and evaluation, we plan to explore different methods including, the automatic generation of output using existing symbolic generators, the manual and semi-automatic validation of these automatically generated texts and the verbalisation of data units by humans, using crowdsourcing.
Acknowledgements
We thank the French National Research Agency for funding the research presented in this paper in the context of the WebNLG project.
References
Regina Barzilay and Mirella Lapata. 2005. Collective content selection for concept-to-text generation. In ceedings of the conference on Human Language Technology and Empirical Methods in Natural Language Pro-cessing, pages 331–338. Association for Computational Linguistics.
Or Biran and Kathleen McKeown. 2015. Discourse planning with an n-gram model of relations. InProceedings of the conference on Human Language Technology and Empirical Methods in Natural Language Processing, pages 1973–1977. Association for Computational Linguistics.
Nadjet Bouayad-Agha, Gerard Casamayor, and Leo Wanner. 2011. Content selection from an ontology-based knowledge base for the generation of football summaries. InProceedings of the 13th European Workshop on Natural Language Generation, pages 72–81. Association for Computational Linguistics.
Gong Cheng, Danyun Xu, and Yuzhong Qu. 2015. Summarizing entity descriptions for effective and efficient human-centered entity linking. InProceedings of the 24th International Conference on World Wide Web, pages 184–194. ACM.
Katja Filippova and Michael Strube. 2008. Dependency tree based sentence compression. InProceedings of the Fifth International Natural Language Generation Conference, pages 25–32. Association for Computational Linguistics.
Polina Kuznetsova, Vicente Ordonez, Alexander C Berg, Tamara L Berg, and Yejin Choi. 2012. Collective generation of natural image descriptions. InProceedings of the 50th Annual Meeting of the Association for Computational Linguistics: Long Papers-Volume 1, pages 359–368. Association for Computational Linguistics. Gerasimos Lampouras and Ion Androutsopoulos. 2013. Using integer linear programming in concept-to-text
generation to produce more compact texts. InACL (2), pages 561–566. Citeseer.