University of South Carolina
Scholar Commons
Theses and Dissertations
2016
Electrochemical Reduction Of Carbon Dioxide
On Carbon Nanostructures: Defect Structures &
Electrocatalytic Activity
Pranav Parag Sharma University of South Carolina
Follow this and additional works at:https://scholarcommons.sc.edu/etd
Part of theChemical Engineering Commons
This Open Access Dissertation is brought to you by Scholar Commons. It has been accepted for inclusion in Theses and Dissertations by an authorized administrator of Scholar Commons. For more information, please [email protected].
Recommended Citation
ELECTROCHEMICAL REDUCTION OF CARBON DIOXIDE ON
CARBON NANOSTRUCTURES: DEFECT STRUCTURES &
ELECTROCATALYTIC ACTIVITY
by
Pranav Parag Sharma
Bachelor of Technology
National Institute of Technology, Warangal, 2007
Master of Science Clarkson University, 2010
Submitted in Partial Fulfillment of the Requirements
For the Degree of Doctor of Philosophy in
Chemical Engineering
College of Engineering & Computing
University of South Carolina
2016
Accepted by:
Xiao-Dong Zhou, Major Professor
Bihter Padak, Committee Member
John R. Regalbuto, Committee Member
John W. Weidner, Committee Member
Guiren Wang, Committee Member
DEDICATION
ACKNOWLEDGEMENTS
I would like to express my gratitude towards my advisor Dr. Xiao-Dong Zhou,
for his continuous guidance, support and encouragement during this doctoral work. He
always encouraged me to think deeply and this has helped me improve as a researcher. I
also thank my thesis committee members, Dr. Bihter Padak, Dr. John R. Regalbuto and
Dr. Guiren Wang for their time and suggestions.
I would like to thank Dr. Jingjie Wu at Rice University and Dr. Fu-Sheng Ke at
Wuhan University for helping me throughout my doctoral study with valuable
discussions. I am grateful to Dr. Perry J. Pellechia at the Department of Chemistry for
helping me with nuclear magnetic resonance spectroscopy measurements.
I would also like to acknowledge the help provided by my colleagues at Rice
University, especially, Dr. Ram Yadav for synthesizing the N-doped carbon
nanostructures and Mingjie Liu with density functional theory calculations.
Finally, I thank all my friends and family members, especially, my wife Udita,
ABSTRACT
The advantages of the electrochemical conversion of carbon dioxide to fuels using
renewable energy sources are two-fold: (1) it has the potential to accomplish a
carbon-neutral energy cycle and (2) it can provide an approach to tackle the environmental
challenges caused by anthropogenic carbon dioxide emissions. Although
thermodynamically possible, the kinetics of carbon dioxide reduction to fuels remains
challenging and therefore, an efficient and robust electrocatalyst is needed to promote the
reaction. The ideal catalyst for the electrochemical CO2 reduction must be capable of
mediating multiple proton-coupled electron transfer reactions at low overpotentials,
suppressing the concurrent hydrogen evolution reaction, converting CO2 to desired
chemicals with high selectivity, and achieving long-term stability. Extensive research has
been carried out on metallic electrocatalysts during the past three decades; however, none
of these materials are simultaneously efficient and stable for practical purposes. This
Ph.D. dissertation focuses on the investigation of the electro-reduction of CO2 on carbon
nanostructures with a focus on understanding the relationship between defect structures
and electrocatalytic activity.
The initial focus of this work was to accomplish active performance and
durability for electrosynthesis of fuels from CO2 using cost-effective catalysts. N-doped
carbon nanotubes (NCNTs) were demonstrated as highly efficient, selective and more
these NCNTs was further benchmarked against other metallic catalysts reported in
literature (Chapter 2). Compared to noble metals Ag & Au, these NCNTs exhibited a
lower overpotential to achieve similar selectivity towards CO formation. The second part
of this work was a study of the dependence of catalytic activity, i.e., the overpotential and
selectivity for CO formation on the defect structures (pyridinic, graphitic, pyrrolic-N)
inside NCNTs. The presence of both pyridinic and graphitic-N was found to significantly
decrease the absolute overpotential and increase the selectivity towards CO formation
(Chapter 3). The third part of this thesis work was to investigate CO2 reduction on
N-doped graphene, in order to explore morphology effects on catalytic activity of NCNTs
towards CO formation (Chapter 4). Overall, pyridinic-N defects exhibited the highest
catalytic activity; thereby suggesting the directions for developing carbon nanostructures
TABLE OF CONTENTS
DEDICATION ... iii
ACKNOWLEDGEMENTS ... iv
ABSTRACT ...v
LIST OF TABLES ...x
LIST OF FIGURES ... xi
LIST OF SYMBOLS ... xvi
LIST OF ABBREVIATIONS ... xvii
Chapter 1: Introduction and Thesis Objectives...1
1.1Rising CO2 Levels ...1
1.2Electrochemical Reduction of CO2 ...2
1.3Thermodynamic Aspects: CO2 Electro-reduction ...2
1.4Kinetic Aspects: CO2 Electro-reduction ...4
1.5Thesis Objectives ...7
References ...9
Chapter 2: Achieving Highly Efficient, Selective and Stable CO2 Reduction on Nitrogen- doped Carbon Nanotubes ...14
2.1Introduction ...14
2.2Experimental Methods ...15
2.3Results & Discussion ...18
References ...36
Chapter 3: Nitrogen Doped Carbon Nanotube Arrays for High Efficiency Electrochemical Reduction of CO2: On the Understanding of Defects, Defect Density, and Selectivity ...39
3.1Introduction ...39
3.2Experimental Methods ...40
3.3Results & Discussion ...43
3.4Conclusions ...56
References ...57
Chapter 4: Incorporation of Nitrogen Defects for Efficient Reduction of CO2 via Two-Electron Pathway on Three-Dimensional Graphene Foam ...61
4.1Introduction ...61
4.2Experimental Methods ...63
4.3Results & Discussion ...65
4.4Conclusions ...76
References ...77
Chapter 5: Electrocatalytic Conversion of Carbon Dioxide to Fuels: A Review on the Interaction between CO2 and the Liquid Electrolyte ...80
5.1CO2 in Aqueous Electrolyte ...82
5.2CO2 in Organic Solvents ...103
5.3CO2 in Ionic Liquids ...108
5.4Summary ...118
References ...119
Chapter 6: Summary and Future Directions ...129
6.2Future Directions ...131
Appendix A: Selective Formation of C2 Products from the Electrochemical Conversion of
CO2 on Cu Electrodes Comprised of Nanoporous Ribbon Arrays ...134
Appendix B: Electrocatalytic Activity of Rutile Titanium Dioxide towards the
Conversion of Carbon Dioxide to CO and Formate ...148
Appendix C: The Role of Nonstoichiometry on the Electrocatalytic Properties of TiO2-x
towards the Conversion of Carbon Dioxide to Fuels ...161
LIST OF TABLES
Table 1.1 Equilibrium standard reduction potentials for conversion of CO2 to various
products ...3
Table 1.2 Products from CO2 reduction at different metal electrodes under various
conditions ...6
Table 2.1 Kinetic data of NCNTs, Au and Ag for electroreduction of CO2 to CO. j0
denotes the exchange current density ...34
Table 3.1 Double layer capacitance for various electrodes. The geometric area of all electrodes is 1 cm2 ...52
Table 4.1 Apparent exchange current density of N-doped graphene, N-doped CNTs, and metal electrodes ...70
Table 4.2 Gas permeability of various electrodes measured at a compression ratio of 10% ...73
Table 5.1 Products from CO2 reduction in different electrolyte systems at various metal
electrodes ...84
Table 5.2 Thermodynamic Gibbs energy of formation of various species at 25°C and 1 atm...87
Table 5.3 Comparison of solubility of CO2 in water, and water containing NaCl in
different concentrations at 1 bar pressure and various temperatures ...89
Table 5.4 Comparison of solubility of CO2 in water, and water containing NaCl in
different concentrations at 303.15 K and various pressures ...89
Table 5.5 Calculated asymmetric stretching frequencies for CO2 and H2O in CO2-(H2O)
n, n=1,2,…,8. CO2 and H2O are denoted by C and W respectively ...100
LIST OF FIGURES
Figure 1.1 Global energy consumption in 2014 showing dependency on fossil fuels ...3
Figure 1.2 Commonly proposed CO2 reduction routes in aqueous acidic medium ...5
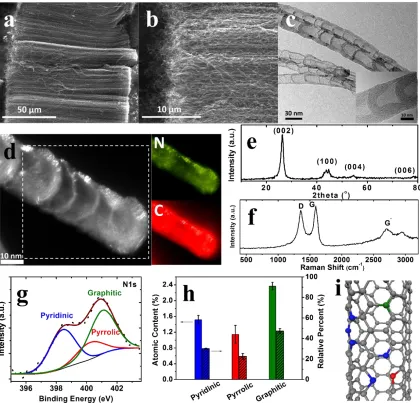
Figure 2.1 Physical characterization of NCNTs. (a) and (b) SEM images of NCNTs at low and high magnification, respectively. (c)TEM images of NCNTs, inset showing a single multi-wall NCNT. (d) EELS element mapping of N and C. (e) XRD pattern. (f) Raman spectrum. (g) A representative XPS of N 1s for NCNTs. The N1s is deconvoluted into three peaks representing three different N functionalities. (h) Statistic N atomic content and relative percent. (i) A schematic of graphitic, pyrrolic and pyridinic N
configuration ...20
Figure 2.2 TEM characterization of NCNTs. (a) Low magnification images of NCNTs and (b) the corresponding tube diameter distribution ...21
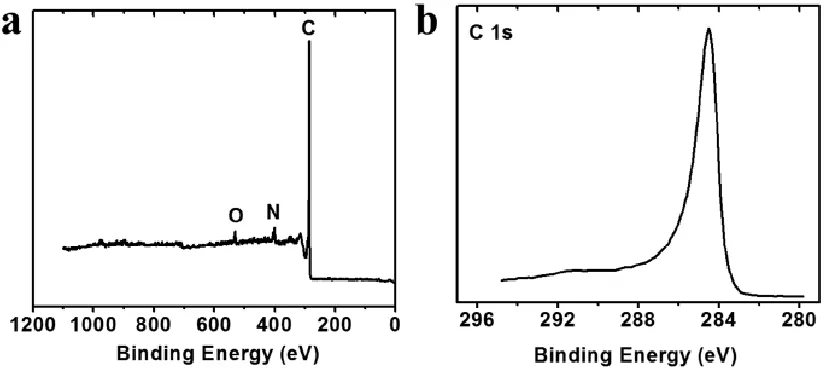
Figure 2.3 XPS characterization of NCNTs. (a) Survey scan of NCNTs showing C, N and O elements. (b) Fine scan of C 1s ...21
Figure 2.4 SEM images of pure CNTs. (a) A low magnification image showing the CNT arrays. (b) A high resolution image ...22
Figure 2.5 Microstructural characterization of pure CNTs. (a) XRD showing the same peak diffraction as NCNTs. A small diffraction peak assigned to iron species was
observed. (b) Raman spectrum ...22
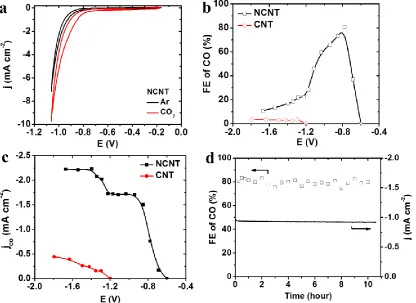
Figure 2.6 Performance of NCNTs for selectively electrochemical reduction of CO2 to
CO. (a) CVs for NCNTs in Ar and CO2 saturated 0.1 M KHCO3 electrolyte, 50 mV s-1.
(b) Dependence of FE of CO on applied cell potential during electrocatalysis of CO2
reduction for both NCNTs and CNTs catalysts. (c) Partial current density of CO versus applied cell potential for NCNTs and CNTs catalysts. (d) Stability of performance of NCNTs for CO2 reduction operated at potentiostatic mode of -0.8 V for 10 h. Both
current density and FE of CO maintain steady over the duration of test ...24
Figure 2.7 Electrochemical activity of Ag nanoparticles for CO2 reduction. (a) Faradaic
efficiency for CO, and (b) total current density at each tested cell voltage ...25
Figure 2.8 Electrochemical activity of Au powder for CO2 reduction. (a) Faradaic
Figure 2.9 Comparison of overpotential and yield of CO of NCNTs with metal catalysts. For Au, Ag, and MoS2 catalyst, the lowest overpotential is chosen to reach a comparable
FE of CO of around 80%. For Zn, Cu, and Sn catalyst, the overpotential for the maximum FE of CO is used ...26
Figure 2.10 Electrochemical activity of Zn powder for CO2 reduction. (a) Faradaic
efficiency of CO and formate, and (b) total current density at each tested cell voltage ....27
Figure 2.11 Electrochemical activity of Cu nanoparticles for CO2 reduction. (a) Faradaic
efficiency for CO, formate and C2H4, (b) Faradaic efficiency for CH3OH and C2H5OH,
and (b) total current density at each tested cell voltage ...27
Figure 2.12 Cyclic voltammetry of NCNTs and CNTs in the electrolyte of 0.1 M KOH saturated with Ar. Scan rate: 50 mV/s. ...28
Figure 2.13 Physical characterization of NCNTs after long term operation. (a) Low magnification TEM images, (b) a high magnification TEM image of a single NCNT, (c) the survey spectrum of XPS, the F coming from the Nafion binder, (d) and (e) fine scans of C1s and N1s respectively ...29
Figure 2.14 Kinetic activity of NCNTs and metal catalysts. (a) The correlation of calculated adsorption energies of the key bound intermediates of COOH* and CO*. (b) The experimental Tafel plots of NCNTs, Au and Ag electrodes ...33
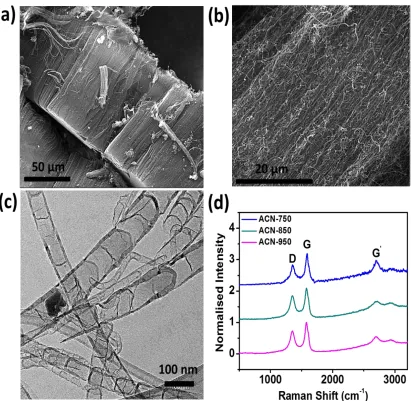
Figure 3.1 Physical characterization of as-synthesized NCNTs (a, b) Cross-sectional SEM images, (c) TEM image, (d) Raman spectra of NCNTs synthesized using ACN precursor at various temperatures ...44
Figure 3.2 Raman spectra of NCNTs synthesized using dimethyl formamide (DMF) and triethylamine (TEA) precursors at 850 °C, denoted by DMF-850 and TEA-850
respectively ...45
Figure 3.3 XPS results of N 1s of NCNTs synthesized using ACN precursor at various growth temperatures and comparison of different N contents in the synthesized
NCNTs ...45
Figure 3.4 (a) Faradaic efficiency for CO versus potential on NCNTs synthesized using different precursors and growth temperatures. (b) Tafel plots for CO formation on NCNTs ...47
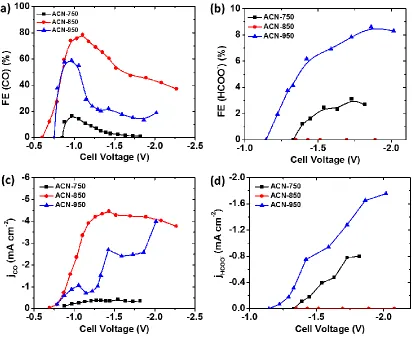
Figure 3.5 Dependence of electrocatalytic performance of NCNTs synthesized using acetonitrile (ACN) precursor at growth temperatures, i.e., 750, 850 and 950°C. (a)
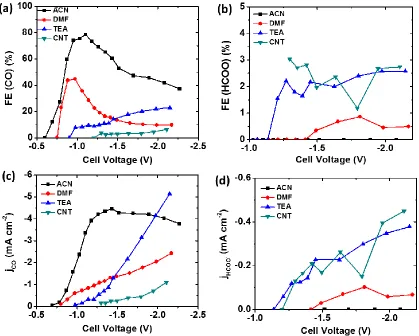
Figure 3.6 Electrocatalytic performance of NCNTs synthesized at 850°C using different precursors, i.e., acetonitrile (ACN), dimethylformamide (DMF) and triethylamine (TEA) in comparison to pristine CNTs (CNT). (a) Faradaic efficiency for CO, (b) Faradaic efficiency for formate, (c) Partial current density for CO and (d) Partial current density for formate at different measured cell voltages ...49
Figure 3.7 Cyclic voltammograms of different electrodes studied in 0.1 M Na2SO4 at
various scan rates for estimation of double layer capacitance. (a) Carbon gas diffusion layer (GDL) (b) Pristine CNTs (c) NCNTs synthesized using DMF precursor (NCNTs-DMF) (d) NCNTs synthesized using TEA precursor (NCNTs-TEA). The geometric area of all electrodes is 1 cm2 ...50
Figure 3.8 Comparison of double layer capacitance values for different NCNT electrodes. The geometric area of all electrodes is 1 cm2 ...53
Figure 3.9 (a) The onset potential and maximum Faradaic efficiency for CO formation as a function of N-content in the synthesized NCNTs (b) Schematic illustrating CO
formation on the NCNTs and free energy diagram at equilibrium potential for CO2
reduction on different N-defects, i.e. pyridinic, pyrrolic and graphitic N in comparsion to pristine CNTs. C, O and H atoms are represented by grey, red and white spheres, while pyridinic, pyrrolic and graphitic N defects are shown using blue, pink and green spheres respectively ...54
Figure 4.1 Raman spectra of pristine graphene and N-doped graphene ...66
Figure 4.2 Physical characterization of N-doped graphene foam. (a) A SEM image showing a representative graphene foam with an open frame structure. (b) High magnification SEM image of a NG-800 sheet. (c) TEM image of a NG-800 sheet. (d) High resolution TEM image of NG-800 sheet, and inset is the FFT pattern. (e) XPS of N 1s. (f) N content distribution as a function of different doping temperatures ...67
Figure 4.3 A representative XPS of NG-800. (a) Survey scan and (b) fine scan of
C 1s ...68
Figure 4.4 Performance of NG-800 for CO2 reduction over long-term operation. Total
current density versus time (–, left axis) and FE for CO production versus time (, right axis) in 0.1 M KHCO3 (pH 6.8 after CO2 saturation) at (a) -0.30, (b) -0.40, (c) -0.50 V
and (d) -0.58 V versus RHE ...68
Figure 4.5 Comparison of the electrocatalytic activities of nitrogen-doped graphene with doping temperature ranging from 700 to 1000 °C. (a) Faradaic efficiency of CO vs potential. (b) Faradaic efficiency of HCOO- vs potential. (c) Maximum Faradaic
efficiency of CO and its corresponding potential versus N functionality content ...72
Figure 4.7 DFT modeling of CO2 electrocatalysis on NG. (a) Free energy diagram of
electrochemical reduction of CO2 to CO on NG and (b) schematic of N configuration and
CO2 reduction pathway ...75
Figure 5.1 The Keeling curve, carbon dioxide concentrations at the Mauna Loa Observatory ...81
Figure 5.2 A schematic of the full electrochemical cell featuring a buffer layer circulating a liquid-electrolyte ...83
Figure 5.3 Performance of full electrochemical cell with and without a buffer layer ...83
Figure 5.4 Variations in concentration of CO2, HCO3- and CO32- with pH of the aqueous medium. DIC = 2.1 mmol/kg, Salinity, S = 35 and T = 25 °C. (K1* = K1; K2* = K2) ...88
Figure 5.5 Illustration of the effect of temperature, pressure and salinity (ionic strength) on the concentration of CO2, HCO3- and CO32- species. (K1* = K1; K2* = K2) ...90
Figure 5.6 Diffusion coefficients of CO2 in ultra-pure DI water at different temperatures and pressures ...92
Figure 5.7 Calculated NEXAFS carbon K-edge spectra for various species (Adapted) ...94
Figure 5.8 Pair correlation function between water and carbon dioxide. a) C atom in CO2 b) O atom in CO2. Solid and dashed lines refer to O and H sites in water respectively ....95
Figure 5.9 Structures of CO2-H2O complex in a T and H-type configuration ...95
Figure 5.10 Optimized structure of CO2-H2O dimer ...97
Figure 5.11 Optimized structure of CO2-H2O trimer ...97
Figure 5.12 Gibbs free energy change with temperature for CO2-(H2O) n, n=1,2,..,8 ...99
Figure 5.13 Schematic illustration of processes in the double layer that play a role in the kinetics of CO2 to CO conversion on a Ag cathode when using (a) KOH or (b) KCl as the electrolyte ...102
Figure 5.14 Nyquist plot for different electrolytes obtained via electrochemical impedance spectroscopy at a cell potential of -2.25 V ...102
Figure 5.15 Optimized structure of complex formed during CO2 and DME interaction ...105
Figure 5.17 Raman spectra of acetaldehyde (A) the carbonyl stretch region in He (black) and CO2 (red). (B) the aldehydic C-H stretch in He (black) and CO2 (blue). Insets show
the intensity changes upon complexation ...107
Figure 5.18 A schematic of how the free energy of the system changes during the reaction CO2 + 2H+ + 2e– ⇌ CO + H2O in water or acetonitrile (solid line) or EMIM-BF4 (dashed
line) ...109
Figure 5.19 Structure of [emim] cation in an ionic liquid ...110
Figure 5.20 Correlation between gas-phase cation-anion interaction energy and the experimental CO2 solubility at 1 bar and 298 K for four ionic liquids with the same
[emim] cation but different anions (Top). Correlation between the gas-phase CO2 anion
interaction energy and the experimental CO2 solubility at 1 bar and 298 K for four ionic
liquids with the same [emim] cation but different anions (Bottom) ...111
Figure 5.21 The spatial radial distribution function of CO2 (yellow) around B(CN)4 (left)
and emim (right) ...114
Figure 5.22 Raman spectra of [bmim][PF6]-CO2 system at 313 K. From top to bottom 1)
[bmim][PF6]-CO2 at 140 bar. 2) [bmim][PF6] without CO2. 3) Pure CO2. Arrows indicate
bands of pure CO2 ...115
Figure 5.23 Reaction Pathways for the Electrochemical Reduction of CO2 in the (A)
LIST OF SYMBOLS
ΔG Gibbs free energy of reaction
E0 Equilibrium potential
ƞ Overpotential for an electrochemical reaction
μ Chemical potential of a species
k Boltzmann’s constant
K Equilibrium constant for a reaction
R Universal gas constant
S Entropy
T Absolute temperature
D Diffusivity
LIST OF ABBREVIATIONS
ACN ... Acetonitrile
AES ... Auger Electron Spectroscopy
CHE... Computational Hydrogen Electrode
CNTs ... Pristine Carbon Nanotubes
CRR... Carbon Dioxide Reduction Reaction
CVD ... Chemical Vapor Deposition
DMF ... Dimethyl Formamide
DFT ... Density Functional Theory
DOS... Density of States
ECSA ... Electrochemical Surface Area
EELS ... Electron Energy Loss Spectroscopy
EIS... Electrochemical Impedance Spectroscopy
FE ... Faradaic Efficiency
FEG ...Field Emission Gun
GC ... Gas Chromatography
GDE ... Gas Diffusion Electrode
GDL ... Gas Diffusion Layer
HER...Hydrogen Evolution Reaction
HRTEM... High Resolution Transmission Electron Microscopy
NCNTs ... N-doped Carbon Nanotubes
NMR ... Nuclear Magnetic Resonance
OER... Oxygen Evolution Reaction
ORR ... Oxygen Reduction Reaction
PEMFC ... Proton Exchange Membrane Fuel Cell
SCE ... Saturated Calomel Electrode
SEM ... Scanning Electron Microscopy
TEA ... Triethylamine
TEM ... Transmission Electron Microscopy
TSP ... Sodium 3-(trimethylsilyl) Proportionate 2, 2, 3, 3-d (4)
XPS ... X-ray Photoelectron Spectroscopy
Chapter 1
Introduction and Thesis Objectives
1.1 Rising CO2 Levels
The current global power consumption is ~ 15 TW, which is projected to double by
2050 and then to more than triple by the end of the century.1 A statistical review done by
British Petroleum in 2015 shows that 86% of our energy needs are met from fossil fuels,
i.e. coal, oil and natural gas (Figure 1.1). There are, however, major drawbacks of using
fossil fuels as energy sources such as its limited availability and environmental concerns.
CO2 is the chief greenhouse gas generated by the combustion of fossil fuels and its
concentration in atmosphere has increased tremendously from 320 ppm in 1960 to ~ 400
ppm in March, 2015 (www.CO2now.org). If the concentration of CO2 is allowed to
increase further, it might lead to an increase in global temperatures and considerable
changes in global climate.2, 3, 4, 5, 6 Hence, it is of paramount importance to reduce CO2
emission and develop means to capture and utilize CO2, thereby decreasing its
accumulation in the atmosphere. A possible way of recycling CO2 from the atmosphere is
to make useful fuels or industrial chemicals by reducing it using electricity generated
from renewable energy sources, such as solar and/or wind energy, resulting in a
1.2 Electrochemical Reduction of CO2
A number of reviews are available that summarize the literature on the
electrochemical CO2 reduction.10, 11, 12, 13 Electrochemical reduction of CO2 coupled with
renewable energy sources can potentially offer a synthetic route to generate carbon
neutral fuels or industrial chemicals that are conventionally derived from petroleum. The
thermodynamic stability of CO2, however, makes the activation of CO2 difficult and an
input electrical energy is needed to drive the CO2 reduction process. Electrolyzers can be
employed by applying a potential difference between two electrodes (anode and cathode),
thereby allowing electrochemical reduction of CO2 at cathode.14, 15 In this regard, solid
oxide electrolysis cells can be used at high temperatures (750-900°C) at high current
densities, however, only CO can be produced at these process conditions.15 On the other
hand, low temperature CO2 electrolysis (25-100°C) might offer a cost-effective method
capable of producing various hydrocarbons, alcohols, formic acid etc., from CO2
reduction.16, 17, 18, 19, 20
1.3 Thermodynamic Aspects: CO2 Electro-reduction
The equilibrium reduction potentials vs. RHE for the formation of various
products from CO2 at pH 0 ([H+] = 1 M) are listed in Table 1.1. These energy barriers
can be further reduced by decreasing the pH, however, as it can be seen because of the
involvement of protons that CO2 reduction reaction competes with concurrent hydrogen
evolution reaction (HER). The equilibrium reduction potential for hydrogen evolution
Figure 1.1. Global energy consumption in 2014 showing dependency on fossil fuels (British Petroleum Statistical Review, 2015)
Table 1.1. Equilibrium standard reduction potentials for conversion of CO2 to various products
CO
2 + 4H +
+ 4e
= C + 2H
2O E
eq
= 0.21 V
CO
2 + 2H +
+ 2e
= CO + H
2O E
eq
= -0.10 V
CO
2 + 2H +
+ 2e
= HCOOH E
eq
= -0.20 V
2CO
2 + 2H +
+ 2e
= H2C2O4 E eq
= -0.50 V
CO
2 + 4H +
+ 4e
= CH2O + H
2O E
eq
= -0.07 V
CO
2 + 6H +
+ 6e
= CH3OH + H
2O E
eq
= 0.02 V
CO
2 + 8H +
+ 8e
= CH
4 + 2H2O E eq
= 0.17 V
2CO
2 + 12H +
+ 12e
= C
2H4 + 4H2O E eq
= 0.06 V
2CO
2 + 12H +
+ 12e
= C
2H5OH + 3H2O E eq
1.4 Kinetic Aspects: CO2 Electro-reduction
The electrochemical reduction of CO2 proceeds through four principal pathways21
(Figure 1.2). (1) a reaction between CO2- (ad) and CO2 (g) giving CO (g) through
disproportionation; (2) formation of a •CO2- radical, with the end product dependent upon
the nature of the electrolyte; (3) formation of a •COOH (ad) species leading to the
formation of formate; and (4) formation of a range of adsorbed reduced CO2 (i.e., COxy-)
species, giving yields of CO, hydrocarbons and alcohols.21 The involvement of multiple
proton-electron transfer in CO2 reduction tends to make it sluggish and therefore, a
catalyst is needed to improve its kinetics.22, 23, 24, 25 In general, an underlying requirement
for a desirable electrocatalyst for CO2 reduction is its capability of mediating multiple
electron and proton transfers at relatively low overpotentials while suppressing the
competing hydrogen evolution reaction.26, 27, 28 Metals have been extensively studied as
electrocatalysts for this purpose in both aqueous and non-aqueous medium as detailed in
the Table 1.2.21 Out of these metals, Sn17, 29, 30, 31, 32, 33, 34 and Cu35, 36, 37 and are
considered as promising electrocatalysts for CO2 conversion to fuels because of their low
cost, easy availability and reasonable overall Faradaic efficiency towards CO2 reduction.
Cu is particularly interesting because of its unique ability to form hydrocarbons and
alcohols at high reaction rates from CO2 reduction.16, 38, 39, 40, 41 The stability of both these
catalysts, however, is a concern as the catalytic activity degrades within few hours.18, 34
Therefore, a catalyst capable of reducing CO2 with high energy efficiency (> 60%) and
selectivity (Faradaic efficiency > 90%), in a long-term operation at high current densities
Figure 1.2. Commonly proposed CO2 reduction routes in aqueous acidic medium21
Non-metallic catalysts for electrochemical CO2 reduction, on the other hand, have
received little attention. Oxide-derived catalysts, specifically, Au and Cu have been
demonstrated to achieve a higher catalytic activity than the respective polycrystalline
metal electrodes.12, 18, 19, 42 The difference in catalytic activity of these electrodes stems
from high density of step defects18, 43, 44, 45 or presence of grain boundaries on the catalyst
employed for efficient and selective CO2 reduction to CO48 and formate49; however, the
dependency of electrocatalytic activity on different defect structures remains unknown.
Table 1.2. Products from CO2 reduction at different metal electrodes under
various conditions Metals Valence Electron Configuration Electrolyte (Aqueous/No n-aqueous) Major Products Selectivity (Maximum Faradaic efficiency, %) Reference Pb, Hg, Sn, In, Bi s/sp
Aqueous HCOOH
(all) 90 17
Non-aqueous
(Propylene carbonate)
(COOH)2
for Pb, Hg 80 50
Non-aqueous (Methanol) CO (disproport -ionation) for Sn
72 51
Cu 4s1/d group
Aqueous
CO 30
10
HCOOH 35
CH4 40
C2H4 20
C2H5OH 22 52
Non-aqueous
(Propylene carbonate)
CO/(COO H)2
70 53
Non-aquoeus
(Methanol)
HCOOH 17
54
CH4 22
C2H4 20
1.5 Thesis Objectives
With this given background, this thesis focuses on the development of metal free
electrocatalysts for CO2 reduction. In this regard, N-doped carbon nanotubes (NCNTs)
(Chapter 2) were studied as electrocatalysts for CO2 reduction and their catalytic activity
was demonstrated. The origin of activity towards CO2 reduction in these materials was
also explored. After demonstrating the superior catalytic activity of NCNTs towards the
electrochemical reduction of CO2 in comparison to expensive noble metals, i.e., Ag &
Au, the role of precursors and growth temperatures on the defect structure and
Pd,Pt orbital HCOOH
for Pd 100 55
Non-aqueous
(Propylene carbonate)
CO/(COO H)2
60 53
Fe, Co, Rh, W,
Ir, Re
Partly filled d-orbital
Aqueous H2 (all) 100 56
Non-aqueous
(Methanol) CO/(COO H)2 for Re
87 57
Zn, Ag, Au, Cd
s only/s1
Aqueous
CO (disproport
ionation) for Zn, Ag,
Au
94 58
Non-aqueous
(Methanol)
CO for Zn,
Ag, Au 70 51
Non-aqueous (1-Ethyl-3-methylimidaz olium tetrafluorobor ate)
consequently the catalytic activity was studied systematically (Chapter 3). Finally, to
unravel the role of morphology on the catalytic activity of the NCNTs, N-doped graphene
References
1. Lewis NS, Nocera DG. Powering the planet: Chemical challenges in solar energy utilization. Proceedings of the National Academy of Sciences103, 15729-15735 (2006).
2. Hansen J, et al. Ice melt, sea level rise and superstorms: evidence from
paleoclimate data, climate modeling, and modern observations that 2 °C global warming is highly dangerous. Atmos Chem Phys Discuss15, 20059-20179 (2015).
3. McGlade C, Ekins P. The geographical distribution of fossil fuels unused when limiting global warming to 2 [deg]C. Nature517, 187-190 (2015).
4. Jenkinson DS, Adams DE, Wild A. Model estimates of CO2 emissions from soil
in response to global warming. Nature351, 304-306 (1991).
5. Norby RJ, Luo Y. Evaluating ecosystem responses to rising atmospheric CO2 and
global warming in a multi-factor world. New Phytologist162, 281-293 (2004).
6. Joos F, Plattner G-K, Stocker TF, Marchal O, Schmittner A. Global Warming and Marine Carbon Cycle Feedbacks on Future Atmospheric CO2. Science284,
464-467 (1999).
7. Olah GA, Prakash GKS, Goeppert A. Anthropogenic Chemical Carbon Cycle for a Sustainable Future. Journal of the American Chemical Society133, 12881-12898 (2011).
8. Olah GA, Goeppert A, Prakash GKS. Chemical Recycling of Carbon Dioxide to Methanol and Dimethyl Ether: From Greenhouse Gas to Renewable,
Environmentally Carbon Neutral Fuels and Synthetic Hydrocarbons. The Journal of Organic Chemistry74, 487-498 (2009).
9. Lackner KS. A Guide to CO2 Sequestration. Science300, 1677-1678 (2003).
10. Hori Y, Vayenas CG, White RE, Gamboa-Aldeco ME. Modern Aspects of Electrochemistry (2008).
11. Gattrell M, Gupta N, Co A. J Electroanal Chem594, 1 (2006).
12. Jhong H-RM, Ma S, Kenis PJA. Electrochemical conversion of CO2 to useful
chemicals: current status, remaining challenges, and future opportunities. Current Opinion in Chemical Engineering2, 191-199 (2013).
631-14. Delacourt C, Ridgway PL, Kerr JB, Newman J. Design of an Electrochemical Cell Making Syngas ( CO + H2 ) from CO2 and H2O Reduction at Room
Temperature. Journal of The Electrochemical Society155, B42-B49 (2008).
15. Ebbesen SD, Mogensen M. Electrolysis of carbon dioxide in Solid Oxide Electrolysis Cells. Journal of Power Sources193, 349-358 (2009).
16. Kuhl KP, Cave ER, Abram DN, Jaramillo TF. New insights into the
electrochemical reduction of carbon dioxide on metallic copper surfaces. Energy & Environmental Science5, 7050-7059 (2012).
17. Wu J, Risalvato FG, Sharma PP, Pellechia PJ, Ke F-S, Zhou X-D.
Electrochemical Reduction of Carbon Dioxide: II. Design, Assembly, and Performance of Low Temperature Full Electrochemical Cells. Journal of The Electrochemical Society160, F953-F957 (2013).
18. Li CW, Kanan MW. CO2 Reduction at Low Overpotential on Cu Electrodes
Resulting from the Reduction of Thick Cu2O Films. Journal of the American
Chemical Society134, 7231-7234 (2012).
19. Chen Y, Li CW, Kanan MW. Aqueous CO2 Reduction at Very Low Overpotential
on Oxide-Derived Au Nanoparticles. Journal of the American Chemical Society
134, 19969-19972 (2012).
20. Chen Y, Kanan MW. Tin Oxide Dependence of the CO2 Reduction Efficiency on
Tin Electrodes and Enhanced Activity for Tin/Tin Oxide Thin-Film Catalysts.
Journal of the American Chemical Society134, 1986-1989 (2012).
21. Chaplin RPS, Wragg AA. Effects of process conditions and electrode material on reaction pathways for carbon dioxide electroreduction with particular reference to formate formation. J Appl Electrochem33, 1107-1123 (2003).
22. Kortlever R, Shen J, Schouten KJP, Calle-Vallejo F, Koper MTM. Catalysts and Reaction Pathways for the Electrochemical Reduction of Carbon Dioxide. The Journal of Physical Chemistry Letters6, 4073-4082 (2015).
23. Studt F, et al. Discovery of a Ni-Ga catalyst for carbon dioxide reduction to methanol. Nat Chem6, 320-324 (2014).
24. Kumar B, et al. New trends in the development of heterogeneous catalysts for electrochemical CO2 reduction. Catalysis Today.
25. Lim RJ, et al. A review on the electrochemical reduction of CO2 in fuel cells,
26. Jones J-P, Prakash GKS, Olah GA. Electrochemical CO2 Reduction: Recent
Advances and Current Trends. Israel Journal of Chemistry54, 1451-1466 (2014).
27. Shen J, et al. Electrocatalytic reduction of carbon dioxide to carbon monoxide and methane at an immobilized cobalt protoporphyrin. Nat Commun6, (2015).
28. Schneider J, Jia H, Muckerman JT, Fujita E. Thermodynamics and kinetics of CO2, CO, and H+ binding to the metal centre of CO2 reductioncatalysts. Chemical
Society Reviews41, 2036-2051 (2012).
29. Zhang S, Kang P, Meyer TJ. Nanostructured Tin Catalysts for Selective Electrochemical Reduction of Carbon Dioxide to Formate. Journal of the American Chemical Society136, 1734-1737 (2014).
30. Choi SY, Jeong SK, Kim HJ, Baek I-H, Park KT. Electrochemical Reduction of Carbon Dioxide to Formate on Tin–Lead Alloys. ACS Sustainable Chemistry & Engineering4, 1311-1318 (2016).
31. Yadav RM, et al. Carbon Nitrogen Nanotubes as Efficient Bifunctional Electrocatalysts for Oxygen Reduction and Evolution Reactions. ACS Applied Materials & Interfaces, (2015).
32. Wu J, Sharma PP, Harris BH, Zhou X-D. Electrochemical reduction of carbon dioxide: IV dependence of the Faradaic efficiency and current density on the microstructure and thickness of tin electrode. Journal of Power Sources258, 189-194 (2014).
33. Wu J, Risalvato FG, Ma S, Zhou X-D. Electrochemical reduction of carbon dioxide III. The role of oxide layer thickness on the performance of Sn electrode in a full electrochemical cell. Journal of Materials Chemistry A2, 1647-1651 (2014).
34. Wu J, Risalvato FG, Ke F-S, Pellechia PJ, Zhou X-D. Electrochemical Reduction of Carbon Dioxide I. Effects of the Electrolyte on the Selectivity and Activity with Sn Electrode. Journal of The Electrochemical Society159, F353-F359 (2012).
35. Feng X, Jiang K, Fan S, Kanan MW. A Direct Grain-Boundary-Activity
Correlation for CO Electroreduction on Cu Nanoparticles. ACS Central Science2, 169-174 (2016).
36. Verdaguer-Casadevall A, et al. Probing the Active Surface Sites for CO
37. Li CW, Ciston J, Kanan MW. Electroreduction of carbon monoxide to liquid fuel on oxide-derived nanocrystalline copper. Nature508, 504-507 (2014).
38. Sen S, Liu D, Palmore GTR. Electrochemical Reduction of CO2 at Copper
Nanofoams. ACS Catalysis4, 3091-3095 (2014).
39. Kas R, Kortlever R, Milbrat A, Koper MTM, Mul G, Baltrusaitis J. Electrochemical CO2 reduction on Cu2O-derived copper nanoparticles:
controlling the catalytic selectivity of hydrocarbons. Physical Chemistry Chemical Physics16, 12194-12201 (2014).
40. Durand WJ, Peterson AA, Studt F, Abild-Pedersen F, Nørskov JK. Structure effects on the energetics of the electrochemical reduction of CO2 by copper
surfaces. Surface Science605, 1354-1359 (2011).
41. Nie X, Esopi MR, Janik MJ, Asthagiri A. Selectivity of CO2 Reduction on Copper
Electrodes: The Role of the Kinetics of Elementary Steps. Angewandte Chemie International Edition52, 2459-2462 (2013).
42. Lu Q, et al. A selective and efficient electrocatalyst for carbon dioxide reduction.
Nat Commun5, (2014).
43. Kas R, Kortlever R, Yılmaz H, Koper MTM, Mul G. Manipulating the Hydrocarbon Selectivity of Copper Nanoparticles in CO2 Electroreduction by
Process Conditions. ChemElectroChem2, 354-358 (2015).
44. Peterson AA, Abild-Pedersen F, Studt F, Rossmeisl J, Norskov JK. How copper catalyzes the electroreduction of carbon dioxide into hydrocarbon fuels. Energy & Environmental Science3, 1311-1315 (2010).
45. Xie J-F, Huang Y-X, Li W-W, Song X-N, Xiong L, Yu H-Q. Efficient
electrochemical CO2 reduction on a unique chrysanthemum-like Cu nanoflower
electrode and direct observation of carbon deposite. Electrochimica Acta139, 137-144 (2014).
46. Nursanto EB, et al. Gold catalyst reactivity for CO2 electro-reduction: From nano
particle to layer. Catalysis Today.
47. Won DH, Choi CH, Chung J, Chung MW, Kim E-H, Woo SI. Rational Design of a Hierarchical Tin Dendrite Electrode for Efficient Electrochemical Reduction of CO2. ChemSusChem8, 3092-3098 (2015).
49. Zhang S, et al. Polyethylenimine-Enhanced Electrocatalytic Reduction of CO2 to
Formate at Nitrogen-Doped Carbon Nanomaterials. Journal of the American Chemical Society136, 7845-7848 (2014).
50. Jitaru M, Lowy DA, Toma M, Toma BC, Oniciu L. Electrochemical reduction of carbon dioxide on flat metallic cathodes. J Appl Electrochem27, 875-889.
51. Ohta K, Kawamoto M, Mizuno T, Lowy AD. Electrochemical reduction of carbon dioxide in methanol at ambient temperature and pressure. J Appl Electrochem28, 717-724.
52. Hori Y, Murata A, Takahashi R. Formation of hydrocarbons in the
electrochemical reduction of carbon dioxide at a copper electrode in aqueous solution. Journal of the Chemical Society, Faraday Transactions 1: Physical Chemistry in Condensed Phases85, 2309-2326 (1989).
53. Ikeda S, Takagi T, Ito K. Selective Formation of Formic Acid, Oxalic Acid, and Carbon Monoxide by Electrochemical Reduction of Carbon Dioxide. Bulletin of the Chemical Society of Japan60, 2517-2522 (1987).
54. Kaneco S, Iiba K, Ohta K, Mizuno T. Electrochemical reduction of carbon dioxide on copper in methanol with various potassium supporting electrolytes at low temperature. J Solid State Electrochem3, 424-428.
55. Podlovchenko BI, Kolyadko EA, Lu S. Electroreduction of carbon dioxide on palladium electrodes at potentials higher than the reversible hydrogen potential.
Journal of Electroanalytical Chemistry373, 185-187 (1994).
56. Azuma M, Hashimoto K, Hiramoto M, Watanabe M, Sakata T. Electrochemical Reduction of Carbon Dioxide on Various Metal Electrodes in Low‐Temperature Aqueous KHCO 3 Media. Journal of The Electrochemical Society137,
1772-1778 (1990).
57. Schrebler R, Cury P, Herrera F, Gómez H, Córdova R. Study of the
electrochemical reduction of CO2 on electrodeposited rhenium electrodes in
methanol media. Journal of Electroanalytical Chemistry516, 23-30 (2001).
58. Ohmori T, Nakayama A, Mametsuka H, Suzuki E. Influence of sputtering parameters on electrochemical CO2 reduction in sputtered Au electrode. Journal
of Electroanalytical Chemistry514, 51-55 (2001).
59. Rosen BA, et al. Ionic Liquid–Mediated Selective Conversion of CO2 to CO at
Chapter 2
Achieving Highly Efficient, Selective and Stable CO
2Reduction on
Nitrogen-doped Carbon Nanotubes
2.1 Introduction
Mastery of the electrochemical conversion of carbon dioxide and water to fuels
using renewable electricity has the potential to shed light on understanding the nature of
artificial photosynthesis and offer an approach to mitigate the negative impact of
anthropogenic carbon dioxide emissions on the planet.1, 2, 3, 4 The field, however, has not
substantially advanced in the last 30 years primarily because of the challenge of
discovery of chemically active and structurally stable electrocatalysts and membrane
architectures. An ideal catalyst for the electroreduction of CO2, e.g. CO2 + 2H+ + 2e- →
CO + H2O, is capable of mediating proton-coupled electron transfer, possessing a low
overpotential for CO2 activation while being sluggish towards hydrogen evolution,
exhibiting a preferable selectivity towards a target product, and retaining structural
integrity over a long operation. Significant progress has been made since 2011,2, 5, 6
addressing the chemical activity originated from oxide scale or tuned ionic-liquid/catalyst
interfaces. Silver and gold can selectively convert CO2 to CO, a feedstock for the
synthesis of methanol in the Fischer-Tropsch process,1, 5 while the ionic liquid can
kinetics. Copper and tin are known non-precious metallic catalysts. Copper is found to be
active towards the formation of hydrogen carbon and alcohols.7, 8, 9, 10 Tin exhibits a
superior selectivity towards the formation of formate with a Faradaic efficiency up to
98%.3 A rapid performance degradation was observed in both Sn- and Cu-based electrode
after approximately 1 h from the start of CO2 electrolysis.11, 12, 13, 14 As a result, it is
compelling to search for efficient, durable and inexpensive alternatives to metal
electrocatalysts for CO2 conversion.
Nitrogen-doped carbon nanotubes (NCNTs) are known to be an effective
electrocatalyst for oxygen reduction. The activity of NCNT catalyst is originated from its
both local defects that mediate the electronic structure,15, 16 and its surface morphology
that regulates atomic arrangement and coordination.16 So far there are very limited
reports on the use of CNTs or NCNTs as the catalyst for the electroreduction of CO2.
CNTs have been applied as the support for the catalytically active species rather than a
catalyst itself.17, 18 NCNTs with a modification of polyethyleneimine was ever found to
function as a catalyst to reduce CO2 to formate but at a high overpotential.19 The activity
of NCNTs towards the reduction of CO2 remains largely unknown. The aim of this
chapter is to report the recent investigation on the use of NCNTs as the catalysts for the
direct conversion of CO2 to fuel with an unprecedented low overpotential (0.18 V), high
selectivity (80%), and durability.
2.2 Experimental Methods
Material Synthesis: The NCNTs were synthesized by liquid chemical vapor
The quartz tube with diameter 5 cm and length 1 m was placed in a three zone horizontal
furnace with the heating zone of 81 cm. The furnace was heated to desired temperature
from the room temperature under the argon ambience. When the optimum temperature
reached, the precursors were injected by the syringe pump in the quartz tube with the
flow rate of 12 ml hr-1 in Ar/H2 (80:20) atmosphere with a flow rate of 1000 SCCM.
After the experiment the furnace was cooled down in Ar atmosphere. The pristine CNT
arrays were synthesized by injecting benzene and ferrocene solution under similar growth
conditions to NCNTs. The details about the experimental procedure are given
elsewhere.20, 21 KHCO3 (99.7%), Nafion perfluorinated resin solution (5 wt.%) and
isopropanol (99.5%) were purchased from Sigma-Aldrich; hydrogen (99.999%), argon
(99.999%), helium (99.999%), and carbon dioxide (99.999%) were purchased from
Airgas; Nafion 212 membrane was purchased from Dupont; Pt/C (60%) was obtained
from Johnson Matthey; Ag powder (APS 20- 40 nm), Au powder (ASP 500-800 nm), Cu
powder (APS 200-300nm) and Zn powder (6 µm) were purchased from Alfa Aesar. The
graphite gas diffusion layer (GDL 10 BC) was ordered from SGL group. All chemicals
were used without further purification. Electrolyte solutions were prepared with DI water
(Siemens, Labstar).
Catalyst Characterization: The morphology of the materials were characterized
by scanning electron microscope (SEM, FEI Quanta 400 FEG ESEM) and high
resolution field emission gun transmission electron microscope (TEM, JEOL 2100 FEG
TEM). The crystallinity was measured by powder X-ray diffraction (XRD) collected by
Rigaku D/Max Ultima II. The microstructure was studied by Raman spectra using
composition was investigated by X-ray photoelectron spectroscopy (XPS, PHI Quantera
XPS) on PHI-5000C ESCA system with Al Ka x-ray as an excitation source.
Electrochemical Measurements: The N-doped carbon nanotubes (NCNTs) gas
diffusion electrodes (NCNTs GDEs) were prepared from the NCNT arrays. In short, a
suspension of NCNTs array particles and Nafion perfluorinated resin solution along with
a 50/50 mixture of water and isopropanol were formed by ultrasonicating for at least 30
min before being sprayed onto GDLs to form GDEs with a NCNTs loading of 0.3~0.5
mg cm-2. The NCNTs GDEs were then heat-treated at 130 °C for 30 min in the vacuum
oven and allowed to cool slowly back to room temperature before testing. The other
metals (Cu, Zn, Au and Ag) based GDEs followed the same preparation procedure and
their loadings were ~ 1.5 mg cm-2. The anode, Pt GDE, with a Pt loading of 0.3 mg cm-2
was made as the similar procedure as NCNTs GDE. The Pt GDE was hot-pressed at 130
°C and 50 PSI for 5 min with a Nafion 212 membrane which prevents CO diffusing to Pt
anode. The geometric surface area of GDE was 3.8 cm2. The electrochemical test was
carried out in a custom-designed full electrochemical cell with NCNTs GDE as the
cathode electrode, Pt GDE as the anode electrode and 0.1 M KHCO3 as the electrolyte.
The cell runs at room temperature and ambient pressure. The cyclic voltammetry was
carried out in the potential range of 0.15 ~ -1.0 V. The CO2 reduction was conducted
under potentiostatic mode for 30 min at each potential by employing
potentiostat/galvanostat (Solartron 1470E). All the cell potentials were corrected by the
IR drop. The ohmic resistance of the full electrochemical cell was measured from the
electrochemical impedance spectroscopy at open circuit voltage, with an amplitude of 5
Product Quantification: Gas products from the outlet of the cathodic
compartment were vented directly into the gas-sampling loop of the gas chromatography
(GC, Inficon Micro 3000 GC). A GC run was initiated every 10 minutes. The gas
concentration was averaged over three measurements. Liquid products were identified
using 1D 1H nuclear magnetic resonance (NMR) spectroscopy (Varian Mercury/VX 400
MHz spectrometer) using the WET solvent suppression pulse sequence. The sodium
3-(trimethylsilyl) propionate 2, 2, 3, 3-d (4) (TSP) was used as the internal standard to
quantify the liquid product concentration.
2.3 Results & Discussion
Structural Characterization: The NCNTs were synthesized by liquid chemical
vapor deposition (CVD) method injecting liquid precursor acetonitrile and dicyandiamide
with ferrocene in Ar/H2 atmosphere at 850 oC. Spraying of the precursor solution leads to
a homogeneous NCNT deposition along the heating zone inside the quartz tube. The
SEM investigation reveals the formation of well aligned NCNT arrays (Figures 2.1a &
b). TEM analysis explores the details of microstructure that the NCNTs are multiwalled
with a bamboo- shaped morphology due to nitrogen incorporation and free from
amorphous and vitreous carbon (Figure 2.1c & inset). The electron energy loss
spectroscopy (EELS) elemental mapping shows homogeneous N distribution in the single
NCNT (Figure 2.1d). In addition to morphology the structural characterizations were
performed by XRD and Raman spectroscopy. The sharpness of the (002) peak shows the
high crystallinity and graphitic nature of NCNTs (Figure 2.1e). Raman spectrum shows a
intensity ratio of the D to G modes (Id/Ig) for the NCNTs is 0.87, which increases as
compared to that of pristine CNT (Id/Ig = 0.58) due to nitrogen incorporation.27
The doping of nitrogen in carbon nanotubes leads to local distortion in graphitic
sheets due to differences in atomic masses and chemical bond lengths of carbon and
nitrogen and thus responsible for increase in Id/Ig ratio for NCNTs as compared to pristine
CNTs. The atomic configuration and stoichiometric composition of NCNTs were
analyzed by XPS. The total N atomic content [N/(C+N)] in the NCNTs calculated from
integrated peak area under C1s and N1s signal divided by their atomic sensitivity factor,
comes around 5.0 at.%. The high resolution N1s spectra as shown in Figure 2.1g
deconvolutes into sub-peaks at around 398.5, 400.8 and 401.5 eV, revealing three N
configurations in the carbon sp2 network corresponding to pyridinic, pyrrolic and
graphitic N, respectively as shown in the schematic (Figure 2.1i). The graphitic N has the
highest relative concentration followed by pyridinic and pyrrolic N. The individual
atomic content for pyridinic, pyrrolic and graphitic N is 1.5 at.%, 1.1 at.% and 2.4 at.%,
respectively (Figure 2.1h).
Electrocatalytic Activity: The activity of NCNTs towards the electrocatalytic reduction
of CO2 was evaluated in a full electrochemical cell employing a circulating electrolyte of
0.1 M KHCO3 as shown in the previous work.28 A catalyst ink was prepared from the
NCNTs mixing with Nafion dispersion, isopropanol and deionized water and then
sprayed onto carbon paper with a diffusion layer, to form a gas diffusion electrode
cathodic electrode for CO2 reduction. The cyclic voltammetry (CV) curves of NCNTs
acquired in Ar saturated 0.1 M KHCO3 show the onset potential of -0.82 V for hydrogen
evolution reaction (HER) which indicates high overpotential (-0.41 V) with reference to
the apparent standard cell potential (-0.41 V under pH = 7 for 0.1 M KOH) for HER
(Figure 2.6a). The suppression of HER on NCNTs is beneficial for CO2 reduction. When
the gas supply is replaced with CO2, the reduction current increased significantly.
Figure 2.2. TEM characterization of NCNTs. (a) Low magnification images of NCNTs and (b) the corresponding tube diameter distribution
Figure 2.4. SEM images of pure CNTs. (a) A low magnification image showing the CNT arrays. (b) A high magnification image.
Figure 2.5. Microstructural characterization of pure CNTs. (a) XRD showing the same peak diffraction as NCNTs. A small diffraction peak assigned to iron species was observed. (b) Raman spectrum. The ID/IG is 0.58.
This increment in reduction current indicates some CO2 reduction reaction in addition to
the HER. The change in reduction current, however, is not a conclusive evidence for CO2
reduction since the hydrogen evolution and CO2 reduction are often interconnected and
Consequently, the reduction products were monitored under potentiostatic electrolysis to
further confirm the occurrence of CO2 reduction. During the electrolysis of CO2, the
cathodic compartment of the cell was continuously purged with CO2 gas and vented
directly into the sampling loop of a GC to enable the quantification of the gas phase
products. The liquid-phase products were measured by 1H NMR after electrolysis at each
potential. NCNTs exhibit activity to the exclusive formation of CO while no liquid
product is detected by NMR throughout the applied cell potential range. The CO starts to
be formed with a Faradaic efficiency (FE) of 37% at an applied cell potential as low as
-0.70 V which corresponds to an overpotential of -0.18 V with respect to the apparent
standard cell potential of -0.52 V for CO2 reduction to CO in the electrolyte of 0.1 M
KHCO3 (Figure 2.6b).28 NCNTs display lower onset overpotential and higher
correspondent FE of CO than that for Ag nanoparticles (-0.27 V with FE of CO 17%) and
Au powder (-0.27 V with FE of CO 12%) under the identical testing conditions. This
onset overpotential is also lower than that recently reported using carbon nanofibers
(-0.23 V) mediated by ionic liquid of EMIM-BF4.29 The maximum FE of CO reaches
around 80% at -0.78 V which also corresponds to a low overpotential of -0.26 V.
The achievable maximum FE of CO for NCNTs is comparable to that for Ag
nanoparticles and Au powder; however, the overpotential to reach this highest FE of CO
is far lower for NCNTs compared to noble metal Ag and Au catalysts, which means more
energy efficient for NCNTs than Ag and Au. The least overpotential required for Ag and
Au catalysts in the literatures was compared to reach the comparable FE of CO of around
Figure 2.6. Performance of NCNTs for selectively electrochemical reduction of CO2 to
CO. (a) CVs for NCNTs in Ar and CO2 saturated 0.1 M KHCO3 electrolyte, 50 mV s-1.
(b) Dependence of FE of CO on applied cell potential during electrocatalysis of CO2
reduction for both NCNTs and CNTs catalysts. (c) Partial current density of CO versus applied cell potential for NCNTs and CNTs catalysts. (d) Stability of performance of NCNTs for CO2 reduction operated at potentiostatic mode of -0.8 V for 10 h. Both
current density and FE of CO maintain steady over the duration of test.
metal catalysts such as Sn, Zn and Cu are also included in the Figure 2.9 for comparison.
To reach 80% FE of CO, NCNTs show much lower overpotential than most of the Ag
and Au electrodes except oxide-derived Au nanoparticles and ionic liquid mediated Ag
powder.1, 5 These two cases are distinct from conventional polycrystalline metal catalysts
with aqueous electrolyte. Oxide derived Au electrode comprised of 20-40 nm Au
electrode possibly due to the presence of highly active sites on its grain boundary
surfaces as similar as oxide derived Cu electrodes.30 The enhancement of activity for Ag
powder is attributed to the presence of ionic liquid 1-ethyl-3- methylimidazolium
tetrafluoroborate (EMIM-BF4) that complexes with the (CO2)- intermediate to lower the
initial reduction barrier.5
Figure 2.7. Electrochemical activity of Ag nanoparticles for CO2 reduction. (a) Faradaic
efficiency for CO, and (b) total current density at each tested cell voltage.
Figure 2.8. Electrochemical activity of Au powder for CO2 reduction. (a) Faradaic
Figure 2.9. Comparison of overpotential and yield of CO of NCNTs with metal catalysts. For Au, Ag, and MoS2 catalyst, the lowest overpotential is chosen to reach a comparable
Figure 2.10. Electrochemical activity of Zn powder for CO2 reduction. (a) Faradaic
efficiency of CO and formate, and (b) total current density at each tested cell voltage.
Figure 2.11. Electrochemical activity of Cu nanoparticles for CO2 reduction. (a) Faradaic
efficiency for CO, formate and C2H4, (b) Faradaic efficiency for CH3OH and C2H5OH,
As a benchmark, CO2 reduction was also performed on pristine CNT arrays. These CNTs
show poor activity towards CO2 reduction. The formation of CO starts at a cell potential
of -1.38 V that is more negative than that for NCNTs. Moreover, the FE of CO is around
3.5% at this potential, much lower than that for NCNTs (Figure 2.6b). In addition to CO,
formate is detected for CO2 reduction on CNTs but has a low yield as similar as CO with
a FE around 2.0-3.5% in the applied potential range of -1.38 ~ -2.10 V. The effect of
trace metal (i.e. Fe in this case) on the catalytic activity towards ORR is an issue under
debate. Actually, Fe has been proven to have no activity towards CO2 reduction, resulting
in H2 evolution of ~100% in Faradaic efficiency.31 The CNTs sample containing
relatively higher Fe residuals than NCNTs were chosen intentionally, as evidenced by the
higher current density of Fe residual redox peaks in the CV performed in a glassy carbon
electrode (Figure 2.12). The much lower activity of CNTs than NCNTs suggests the
active sites are mainly attributed to N-doping rather than the Fe residuals.
Partial current density for CO production (jCO) as a function of potential was extracted
from data for the constant potential electrolyses (Figure 2.6c). The jCO for NCNTs is one
order of magnitude higher than that for CNTs. The huge difference in activity between
CNTs and NCNTs indicates the significant role of N dopant playing in the
electrocatalysis process. The CO2 reduction kinetics is facilitated as the cell potential
sweeps cathodically leading to the increase of jCO for NCNTs. The jCO for NCNTs
undergoes a plateau as the cell potential shifts more negatively beyond overpotential
-0.41 V, reflecting mass transport limitation of CO2 to the electrodes (Figure 2.6c). The
FE of CO decreases after the achievement of mass transport limitation because more
electrons are consumed by HER than CO2 reduction reaction (Figure 2.6b).
Figure 2.13. Physical characterization of NCNTs after long term operation. (a) Low magnification TEM images, (b) a high
magnification TEM image of a single NCNT, (c) the survey spectrum of XPS, the F coming from the Nafion binder, (d) and (e) fine scans of C1s and N1s respectively.
The stability is equally important to the activity when developing catalysts for
CO2 reduction. Severe degradation occurs to the metal catalysts, like Cu and Au, and so
far the mechanism is still obscure.1, 2, 32 Thus, the long-term performance of NCNTs
catalysts was tested at constant cell potential of -0.8 V for 10 hours. The current density
maintains a steady value at around -1.0 mA cm-2 throughout the duration of the test.
Moreover, the FE of CO only fluctuates slightly around 80% over the test duration. After
the long-term running, the morphology was analyzed and surface chemistry of the
NCNTs electrode. The NCNTs keep the bamboo morphology after electrolysis of 10 h. In
the electrolyzed electrode, the respective concentration for pyridinic, pyrrolic and
graphitic N is 1.4%, 1.3% and 2.0%, which falls into the statistic region of N composition
for the fresh electrodes, showing the robustness of NCNTs electrodes under reduction
condition (Figure 2.13). These results clearly reveal that NCNTs act as highly active and
Mechanistic Insights: In order to understand the mechanism of electrocatalytic
CO2 reduction to CO with such a superior activity for NCNTs in terms of high efficiency
and selectivity, the following three questions are open to be answered. (1) Why does the
pathway only produce CO, without any hydrocarbons and alcohols? (2) Why is such a
small overpotential in electrocatalysis of CO2 reduction to CO possible? (3) Why do the
NCNTs reduce CO2 to CO with high yield/Faradaic efficiency? A mechanism was
proposed to address the above three questions based on computational hydrogen
electrode (CHE) model 26 and density functional theory (DFT) simulations implemented
in Vienna Ab-initio Simulation Package (VASP) 33. The answers to these questions
should also shed light on modification of carbon nanostructures to further improve the
activity.
The reaction mechanism of electroreduction of CO2 to CO was considered on
pristine CNTs and NCNTs surface through the adsorbed intermediates COOH* and CO*.
Similar intermediates have been proposed for the electroreduction of CO2 on late
transition metals like Au, Pt and Cu.26, 34 The elemental reaction steps for the CO2
electrocatalytic reduction to CO are shown in Eqs. (1-3).34
(1)
(2)
(3)
where * denotes a free step site. This reaction mechanism involves two coupled
desorption (Eq. 3). The overpotential strongly depends on free energies of the first two
electrochemical steps. For NCNTs, the activation of CO2 to form adsorbed COOH* is
associated with an uphill process of the first electron-proton pair transfer at 0 V vs. RHE.
After the adsorption of COOH, the free-energy pathway becomes thermodynamically
downhill to transfer the second electron-proton pair to form adsorbed CO. This CO is
weakly bound to NCNTs surface, leading to the production of CO gas. The
potential-limiting step is the formation of adsorbed COOH*, requiring an onset potential of -0.30 V
vs. RHE at which the step becomes exergonic (downhill in free energy) at the pyridinic N
site. It implies an existence of limiting (least-negative) overpotential of -0.20 V which is
close to the experimental observation as shown in Figure 2.6b. The calculated limiting
overpotential for pyridinic N is lower than theoretical values for Cu (-0.31 V), Au (-0.63
V) and Ag (-0.79 V).26, 35 The most efficient N configuration is pyridinic N followed by
pyrrolic and graphitic N. In the case of CNTs, the potential-limiting step is also the
formation of adsorbed COOH*, but requiring an overpotential of -1.9 V, much higher
than that for NCNTs, which is in agreement with the experimental data as seen in Figure
2.6b.Moreover, in order to elucidate the high selectivity of NCNTs towards CO
production, the kinetic activity towards CO production was correlated with the adsorption
energies of COOH (EB[COOH]) and CO (EB[CO]).34, 35 Essentially, a highly selective catalyst
for CO2 reduction to CO is required to possess the capability of immobilizing COOH but
loosening CO at the same time. In other words, it requires strong COOH binding but a
Figure 2.14. Kinetic activity of NCNTs and metal catalysts. (a) The correlation of calculated adsorption energies of the key bound intermediates of COOH* and CO*. The binding energy data for lattice surface (211) of metals are adopted from Ref. 35. DFT calculations were done by Mingjie Liu at Rice University. (b) The experimental Tafel plots of NCNTs, Au and Ag electrodes.
The EB[COOH] and EB[CO] for pristine and different N functionalities doped CNTs were
calculated, and the results are shown in Figure 2.14a. The data of metal catalysts from
ref. 35 are also included in Fig. 6a. For the elemental metal catalysts, the EB[COOH] and
EB[CO] are linearly correlated with a small positive slope less than one (around 0.73),
which suggests that increasing the bonding strength of COOH to the metal surface is
accompanied by a sharp increase of CO adsorption energy. Therefore, all elemental
metals are off the maximum of kinetic activity to electroreduce CO2 to CO. For the CNTs
materials, the ΔECOOH versus ΔECO is also positively linear. However, the slope for the
linear relationship has a much larger magnitude of around 37, and thus a significant
increase of EB[COOH] only causes a slight increase of EB[CO] in NCNTs, which fulfills the
profile indicates the highest selective site towards CO production is pyridinic N followed
by pyrrolic and graphitic N.
Table 2.1. Kinetic data of NCNTs, Au and Ag for electroreduction of CO2 to CO. j0
denotes the exchange current density
Material Tafel Slope
(mV/dec) j0 (mA/cm 2
)
NCNTs 203 2.9E-02
Au powder 254 7.3E-03
Ag
nanoparticles 220 9.7E-03
The pyridinic N has very negative value of EB[COOH] as reactive metals like Pt and
N so that COOH can bind tightly. On the other hand, it owns a weak EB[CO] similar with
Au and Ag which renders the feasible desorption of adsorbed CO*. Both pyrrolic and
graphitic N are also calculated to have stronger EB[COOH] and weaker EB[CO] than the most
CO selective elemental metal catalysts like Au and Ag. As a result, gas product of CO is
favorably produced on NCNTs instead of hydrocarbons and alcohols, as CO is released
easily from active N sites on NCNTs before it can be further reduced by the successive
electrons. The binding energy profile of COOH and CO for the three N configurations
provides insight into the high FE of CO up to 80% for NCNTs in these measurements.
For the CNTs, although the binding energy for both COOH and CO is reasonable for
selective CO production, the free energy barrier for the first electron-proton pair transfer
is too high resulting in a very high onset overpotential at which the HER is also promoted
and predominates over CO2 reduction. Therefore, CNTs exhibit a low yield of CO. In